Mapping the binding site of ligands to proteins using chemical exchange parameters by NMR spectroscopy
Bạn đang xem bản rút gọn của tài liệu. Xem và tải ngay bản đầy đủ của tài liệu tại đây (7.92 MB, 112 trang )
MAPPING THE BINDING SITE OF LIGANDS TO PROTEINS USING CHEMICAL
EXCHANGE PARAMETERS BY NMR SPECTROSCOPY
JANARTHANAN KRISHNAMOORTHY (M.Tech)
A THESIS SUBMITTED
FOR THE DEGREE OF DOCTOR OF PHILOSOPHY
STRUCTURAL BIOLOGY LABS
DEPARTMENT OF BIOLOGICAL SCIENCES
NATIONAL UNIVERSITY OF SINGAPORE
2010
Dedicated to
The α and the ω, the good Shephard,
my teachers, parents and friends
Declaration
The work in this thesis is based on research carried out by the author at the NMR Structural
biology lab, the Department of Biological Sciences, Singapore. This work has been supervised
by Associate professor Dr. Henry Mok and co-supervised by Associate professor Dr. Yang
Daiwen and submitted after their prior approval. No part of this thesis has been submitted
elsewhere for any other degree or qualification and all the work is original unless referenced
apropriately in the text.
Name: K.Janarthanan
Date: 12
st
November 2010
Copyright © 2010 by K. Janarthanan.
“The copyright of this thesis rests with the author. The quotations from it shall be published with
the author’s prior consent and information derived from it should be properly acknowledged”.
iii
Acknowledgements
I would like to express my sincere thanks to my advisor Assoc. Prof. Henry Mok, whose
guidance throughout these year has instilled a clinical approach and discipline in my research.
Discussing with Dr. Henry is always a pleasure as, he always gives new direction and approach
in solving tough problems. I admire Dr. Henry’s clarity and simplicity in explaining difficult
concepts, which inspires me to emulate in my academic carrier. I extend my gratefulness for
the generous assistance offered by Dr. Henry for academic trainings and conferences. I would
also like to thank Assc. Prof. Yang Daiwen for his kind co-supervision. Dr. Yang’s critical and
pragmatic way of thinking had helped me switch to a different school of thoughts during the
course of my research.
My sincere thanks to Prof. Kini, along with Prof. Liou Cherng and Prof. Yao sho qin, who
inspired me to choose suitable systems to work on, during my priliminary examination.
I owe my deepest gratitude to Prof. Bergie Englert and Prof. Choo Ho Hiap, whose lectures
on quantum mechanics helped me address my research problems from a theoretical point of
view. The wonderful moments spent in those lecture halls are always memberable in my life
for their simplified approach which drew not only passion towards science but also the good
nature in me.
My special thanks to Prof. Anil Kumar for arranging a summer training course at IISC and
introducing me to Prof. Ramanathan, Dr. Ragathoma, Dr. Athreya, Dr. Mahesh, Dr. Jeyanthy,
Sangeerth and Jarina.
My heartfelt thanks to Prof. James Keeler for the generously distributed notes on NMR.
Many thanks to Prof. Alex Bain, whose suggestions through emails has helped me complete
the final part of this thesis. My word of appreciation to Prof. Ramakrishna and Dr. Naveen
iv
whose valuable codes and time helped me implement the automation part of analysis in this
work.
It is my pleasure to thank my colleagues Dr. Fan, Anir, Olga, Siew leong, Yvonne, Rika,
Zheng yu, Zou zimming, Karthik, Long dong and others for their wonderful company during
my research. Iam grateful to Dr. Sanjay ghosh, Prof. P. V. Sundaram, Dr. Vaidyalingam, Mrs.
Susan, Mrs. Vasanty, Mr. Robertson, who helped me in my yesteryears and would be more than
happy to see me graduate.
I thank my parents and brothers, Ganesh, Sethu and Adisa, who shared their care and con-
cern during those critical times when I was looking for support. Finally, words cannot express
the beauty of the intelligent design, whose game called ‘life’, within the confines of laws called
‘nature’, amazes me to wonder and to explore, what life is all about. Thanks to the creative
mind who is behind this very existence.
v
Table of content
Declaration iii
Acknowledgements iv
Summary x
List of tables xii
List of figures xiii
Acronyms xiv
Nomenclature xvii
1 Introduction 1
1.1 Has structural biology delivered what it has promised? . . . . . . . . . . . 1
1.2 Protein-ligand interaction and drug discovery . . . . . . . . . . . . . . . . . 2
1.3 Techniques to investigate protein-ligand interaction . . . . . . . . . . . . . 3
1.4 NMR based methods for protein-ligand interaction . . . . . . . . . . . . . 3
1.4.1 Exchange NOESY experiment . . . . . . . . . . . . . . . . . . . . . . . 4
vi
1.4.2 Saturation transfer difference experiment . . . . . . . . . . . . . . . . . 6
1.4.3 waterLOGSY . . . . . . . . . . . . . . . . . . . . . . . . . . . . . . . . . 6
1.4.4 HSQC perturbation experiments . . . . . . . . . . . . . . . . . . . . . . 7
1.4.5 Isotope edited or filtered experiments . . . . . . . . . . . . . . . . . . . 9
1.4.6 CPMG experiments . . . . . . . . . . . . . . . . . . . . . . . . . . . . . 10
1.5 Proteins involved in cancer: an excellent target system for drug design . . 10
1.5.1 Mechanism of Apoptosis . . . . . . . . . . . . . . . . . . . . . . . . . . . 11
1.5.2 Structure aided drug design for cancer treatment . . . . . . . . . . . . . 14
1.6 Using NMR to understand the dynamic protein-ligand interactions . . . . 16
2 Material and Methods 17
2.1 Protein sample preparation . . . . . . . . . . . . . . . . . . . . . . . . . . . . 17
2.2 ITC titration . . . . . . . . . . . . . . . . . . . . . . . . . . . . . . . . . . . . . 18
2.3
15
N HSQC titration . . . . . . . . . . . . . . . . . . . . . . . . . . . . . . . . 19
2.4 J-Surface mapping . . . . . . . . . . . . . . . . . . . . . . . . . . . . . . . . . 20
2.5 Molecular docking . . . . . . . . . . . . . . . . . . . . . . . . . . . . . . . . . 20
3 Analysing fast chemical exchange systems 21
vii
3.1 Abstract . . . . . . . . . . . . . . . . . . . . . . . . . . . . . . . . . . . . . . . . 21
3.2 Introduction . . . . . . . . . . . . . . . . . . . . . . . . . . . . . . . . . . . . . 22
3.3 Results and discussion . . . . . . . . . . . . . . . . . . . . . . . . . . . . . . . 25
3.3.1 Mechanisms of protein-ligand interaction . . . . . . . . . . . . . . . . . 25
3.3.2 Correction for free ligand concentration . . . . . . . . . . . . . . . . . . 27
3.3.3 Automation using genetic algorithm . . . . . . . . . . . . . . . . . . . . 28
3.3.4 Mapping the binding site of BH3I-1 onto hBcl
XL
. . . . . . . . . . . . . 29
3.A Automated data analysis . . . . . . . . . . . . . . . . . . . . . . . . . . . . . . 40
3.B Deriving complex models . . . . . . . . . . . . . . . . . . . . . . . . . . . . . 41
3.C Calculating [L]from [L
T
] . . . . . . . . . . . . . . . . . . . . . . . . . . . . . 44
4 Analysing all chemical exchange systems 45
4.1 Abstract . . . . . . . . . . . . . . . . . . . . . . . . . . . . . . . . . . . . . . . . 45
4.2 Introduction . . . . . . . . . . . . . . . . . . . . . . . . . . . . . . . . . . . . . 46
4.3 Results and discussion . . . . . . . . . . . . . . . . . . . . . . . . . . . . . . . 49
4.3.1 Automation using genetic algorithm . . . . . . . . . . . . . . . . . . . . 51
4.3.2 Analysis of fast exchange titration (hBcl
XL
and BH3I-1 ) . . . . . . . . . 55
4.3.3 Analysis of the slow exchange titration (mMCL-1 and NOXA-B ) . . . . 58
viii
4.3.4 Mechanism of interaction of mMCL-1 and NOXA-B . . . . . . . . . . 62
4.3.5 Comparison of optimized parameters of fast and slow exchange
regimes . . . . . . . . . . . . . . . . . . . . . . . . . . . . . . . . . . . . 66
4.4 Concluding remarks . . . . . . . . . . . . . . . . . . . . . . . . . . . . . . . . 68
4.A Appendix: Theory . . . . . . . . . . . . . . . . . . . . . . . . . . . . . . . . . . 70
4.A.1 Mechanisms based ligand correction and calculation of population . . . 72
4.A.2 Mechanism dependent setting up of the Liouville, relaxation
and kinetic matrix . . . . . . . . . . . . . . . . . . . . . . . . . . . . . . 74
4.A.3 Data preperation for line shape analysis . . . . . . . . . . . . . . . . . . 75
5 Conclusion and future direction 76
5.1 Quantum mechanical approach to study protein-ligand interactions . . . 78
5.2 In-silico drug design . . . . . . . . . . . . . . . . . . . . . . . . . . . . . . . . 78
Bibliography 95
ix
Summary
Mapping the binding site of ligands to proteins using chemical exchange parameters by
NMR Spectroscopy
NMR spectroscopy, along with X-ray crystallography, have advanced to such an extent that
structure aided drug design is no longer just a concept on paper. With a myriad of techniques
in array, NMR spectroscopy is routinely used to screen ligands, locate binding site and design
site specific molecules. Almost all NMR experiments takes advantage of the fundamental be-
haviour of nuclei namely, the chemical exchange and relaxation phenomena, which can explain
the dynamic nature of macromolecules (proteins) and their complexes (protein + ligand) in so-
lution. Classical Bloch-McConnell equations are commonly used to study mechanisms ranging
from simple to complex interactions in a quantitative way. We adopted the same approach, to
understand the relationship between NMR derived kinetic parameters and the underlying inter-
action mechanism for protein-ligand systems. Using hBcl
XL
(protein) and BH3I-1 (ligand) as
a standard system for the fast exchange regime (weak binding case), we have shown that the
rate of change within a population from the free to bound state, can differentiate the binding
site residues from the non binding site residues. The analysis is carried out by an in house
written ‘c’ program ‘Auto-FACE’, which uses a genetic algorithm to optimize kinetic (K
eq
) and
spectral parameters (ω) after performing appropriate mechanism dependent free ligand correc-
tions. Further, adopting the transition probability approach, a more comprehensive dynamic line
shape analysis was automated and implemented to study different chemical exchange regimes
without invoking any approximations. MCL-1 (protein) and NOXA-B (peptide), a typical slow
x
exchange system (tight binding case), was analysed and showed that there are regime dependent
limitations on using kinetic parameters to interpret binding processes.
xi
List of tables
3.1 Thermodynamic parameters obtained from ITC experiment by fit-
ting the data to sequential three site binding model . . . . . . . . . . . . . . . . 30
3.2 Parameters determined by fitting of chemical shifts to model equa-
tions for hBcl
XL
and BH3I-1 system . . . . . . . . . . . . . . . . . . . . . . . . 38
4.1 The parameters obtained by line shape analysis for binding and non-
binding site residues of hBcl
XL
and BH3I-1 system (fast exchange
regime) . . . . . . . . . . . . . . . . . . . . . . . . . . . . . . . . . . . . . . . . . 59
4.2 The parameters obtained by line shape analysis for binding and non-
binding site residues of mMCL-1 and NOXA-B system (slow ex-
change regime) . . . . . . . . . . . . . . . . . . . . . . . . . . . . . . . . . . . . 67
xii
List of figures
1.1 Illustration of transfer NOESY experiment . . . . . . . . . . . . . . . . . . . . 5
1.2 Illustration of STD experiment . . . . . . . . . . . . . . . . . . . . . . . . . . . 7
1.3 Illustration of HSQC perturbation experiment . . . . . . . . . . . . . . . . . . 8
1.4 Illustration of isotope edited or filtered experiment . . . . . . . . . . . . . . . . 9
1.5 Mechanism of apoptosis . . . . . . . . . . . . . . . . . . . . . . . . . . . . . . . 11
1.6 Classification of BCL-2 family proteins . . . . . . . . . . . . . . . . . . . . . . 12
1.7 Sequence alignment of Pro-survival and pro-apoptotic proteins . . . . . . . . 13
1.8 Sequence alignment of pro-apoptotic proteins . . . . . . . . . . . . . . . . . . 13
1.9 Comparison of hydrophobic groove of hBcl
XL
and mMCL-1 . . . . . . . . . . 14
3.1 Component signals of chemically exchanging system (A and B) and
structure of BH3I-1 molecules . . . . . . . . . . . . . . . . . . . . . . . . . . . 24
3.2 Simulation of fast, intermediate and slow exchange regimes for two
site chemical exchange . . . . . . . . . . . . . . . . . . . . . . . . . . . . . . . . 25
3.3 Isothermal binding curve for BH3I-1 titrated into hBcl
XL
. . . . . . . . . . . . 31
3.4
15
N HSQC spectra of hBcl
XL
in the presence of BH3I-1 . . . . . . . . . . . . 32
3.5 Comparison of single and double site binding models for different
residues of hBcl
XL
and BH3I-1 titration . . . . . . . . . . . . . . . . . . . . . . 33
3.6 ‘3D’ plot to differentiate the binding site residues from bulk residues . . . . . 36
3.7 Mapping the binding site residues with ‘3D’ plot and J-surface analysis . . . 37
3.8 Comparison of the previous and current docked models of BH3I-1
on to hBcl
XL
. . . . . . . . . . . . . . . . . . . . . . . . . . . . . . . . . . . . . . 40
xiii
4.1 The simulation of fast, intermediate and slow exchange titration . . . . . . . . 47
4.2 Components for fast, intermediate and slow exchange regime spectrums . . . 48
4.3 Calculation of local objective function . . . . . . . . . . . . . . . . . . . . . . . 50
4.4 Binding sites of BH3I-1 and NOXA-B mapped onto the hBcl
XL
and
mMCL-1 respectively . . . . . . . . . . . . . . . . . . . . . . . . . . . . . . . . 51
4.5 Line shape analysis for binding site residues of hBcl
XL
. . . . . . . . . . . . . 53
4.6
15
N HSQC spectra of F146, G198, G94 and G196 residues of hBcl
XL
. . . . 54
4.7 Line shape analysis for non binding site residues of hBcl
XL
. . . . . . . . . . 57
4.8 The sequence alignment of mNOXA (mouse) with hNOXA (human) . . . . . 60
4.9
15
N HSQC spectra of residues H205 and I245 of mMCL-1 . . . . . . . . . . 61
4.10 Line shape analysis for binding site residues of mMCL-1 . . . . . . . . . . . 63
4.11 Line shape analysis for non binding site residues of mMCL-1 . . . . . . . . . 64
4.12 Simulation of free ligand concentration and population . . . . . . . . . . . . . 65
4.13 Variation of population with titration . . . . . . . . . . . . . . . . . . . . . . . . 68
5.1 In-silico drug designed for BH3 groove of hBcl
XL
using ‘Ligbuilder’ . . . . . 79
xiv
Acronyms
Apaf-1 Apoptotic peptidase activating factor-1
hBcl
XL
Human B-cell leukemia
BL21 E. coli B strain with DE3, a λ prophage carrying the T7 RNA polymerase gene and lac
gene
DH5-α An Hoffman-Berling 1100 E. coli strain derivative
DNA Deoxyribo nucleic acid
DMSO Di-methyl sulphoxide
FAS FAS ligand
FADD FAS associated death domain
FP Flourescence polarization
ITC Iso-thermal calorimetry
IPTG Isopropyl-β-D-1-thiogalactopyranoside
MCL-1 Myeloid cell leukemia-1
MDM-2 Murine double minute oncogene
NOESY Nuclear Overhauser effect spectroscopy
p53 protein 53 or tumor protein 53
xv
PCR Polymerase chain reaction
pET-M Plasmid E. coli T7 expression vector
PGEX-4T1 Plasmid glutathione S-transferase fusion vector
TNF Tissue necrosis factor
TRAIL TNF receptor
wLOGSY Water-ligand observed via gradient spectroscopy
xvi
Nomenclature
[K] Kinetic rate matrix
[R] Relaxation rate matrix
δ Chemical shift
B
0
Magnetic field strength
B
1
Field strength of radio frequency pulse
xvii
CHAPTER I
Introduction
1.1 Has structural biology delivered what it has promised?
By the start of 20
th
century scientists all over the world were complacent with the theory based
on classical physics and thought the conquest for explanation of every physical phenomenon
was over, till new experiments like black body radiation and the photoelectric effect emerged.
The failure and inadequacy of classic physics to explain the above experiments later lead to the
birth of quantum mechanics. Aa analogous scenario can be seen for the quest of targeted drug
design[
1], where solving the structure of proteins was held as the final obstacle for designing
drugs precisely[
2]. Concomitant advances in technology also made it possible to achieve
this goal by getting the structure, but when this idea was put to test, the outcomes were not
promising[3, 4, 5, 6]. This resulted partly due to a lack of consideration for the dynamic
aspects of protein-ligand interaction.
A protein by itself is a very intrensically dynamic molecule. When a ligand is added to
this system, the nature by which both interact with each other varies greatly from commonly
encountered electrostatic, van der Waals, and dipole-dipole interactions to specialised phi stack-
ing processes[
7, 8]. The bound ligand molecule, after a period of time called ‘residence
time’[
9, 10], gets out of the binding pocket as a free molecule. The rate at which this happens
defines the affinity of interaction. With this global picture of ligand binding to protein on one
1
CHAPTER 1. Introduction Protein-ligand interaction and drug discovery
side, when we consider the local rearrangement of the residues within the binding pocket, the
degree of dynamic complexity increases exponentially.
1.2 Protein-ligand interaction and drug discovery
The three important stages of drug discovery, namely: lead generation, lead optimization and
pre-clinical development require detailed structural information of the target protein and the
ligand at atomic resolution[
8, 11, 12, 13]. Structural details not only enhance the understanding
of the mechanism of interaction but also help us to improve a weakly interacting molecule in to
a highly specific therapeutic molecule. In the first stage of drug design, a large library of ligands
are screened against the target protein and molecules showing characteristic selectivity towards
the target protein are chosen for further study into the nature of the interaction[14]. The
identification of the binding pocket for these molecules is the subsequent stage which greatly
assists in shaping these molecules to lead molecules. Once the scaffold of the lead structure has
been decided upon, a diverse set of molecules are then synthesized to imporve on the selectivity
and affinity towards the target protein[15, 16].
The promising candidates are taken to the next stage to characterize their toxicity and
bioavailability in animal models. If the molecules show poor metabolism or cell toxicity[17,
18], the structural information obtained during the preliminary stages is used to redesign the
ligand to enhance enzymatic degradation in the liver, kidney and lungs. The finally refined
molecule is formulated as a therapeutic drug. In all three stages of drug design, a set of simple,
effective, robust and sensitive techniques is required to perform quantitative assays on protein-
ligand interactions.
2
CHAPTER 1. Introduction Techniques to investigate protein-ligand interaction
1.3 Techniques to investigate protein-ligand interaction
Many of the techniques available for studying protein-ligand interactions can be broadly classi-
fied into global techniques ( which details the interaction at a global level) and high resolution
techniques which gives information at the atomic level.
ITC (Isothermal calorimetry)[
19], fluorescence polarization and surface plasmon resonance
techniques, each belonging to the former class, are sensitive techniques that measure the glob-
ally averaged parameters[20]. Delineation of stoichiometry and the mechanism of interaction
is straight forward and accurate using these techniques. During the preliminary stages, these
techniques are best suited for screening the right candidate ligands from non-specifically in-
teracting molecules, and later on, quantitatively comparing the affinity and specificity of the
selected ligand molecules.
Techniques like NMR spectroscopy and X-ray crystallography are complex in principle but
yield information at the atomic level of resolution[21]. Mapping of the interaction site also
referred to as “Epitope mapping”[
22], is possible with both of these techniques. Unfortunately,
both techniques suffer from stringent criteria for sample preperation like high concentration of
protein and ligand (>1 mM) in very pure form (>98%). Hence a good expression system for the
target protein of interest is quintessential to perform structural studies using these techniques.
1.4 NMR based methods for protein-ligand interaction
X-ray crystallography, unlike NMR, has no limitation on molecular weight for structure deter-
mination of macromolecules. Most of the drugs successfully synthesised based on structure
directed rational drug design is owed to a high quality structure determined by X-ray technique.
On the other hand, NMR offers a variety of experiments that would complement X-ray studies,
to study the dynamics of a protein as well as its interaction with other molecules[
4, 23, 24, 25].
3
CHAPTER 1. Introduction NMR based methods for protein-ligand interaction
The dynamics in NMR are attributed two phenomenon namely, chemical exchange and relax-
ation. By studying these phenomenon, we can explain the structural changes that happen within
the molecule. Processes like tautomerism, ‘H’ exchange, ring flipping and isotropic methyl ro-
tation are examples of chemical exchange phenomenon, whereas molecular tumbling, internal
correlation and even chemical exchange contribute to the relaxation of nuclei’s energy. While
studying protein-ligand interactions the effects of both chemical exchange and relaxation are
clearly evident in the spectra of both protein and ligand. Hence, the tools developed to study
such systems focus on protein or ligand or both. In differentiating the protein from its interact-
ing partner either the difference in molecular weight or differential isotope labelling stratergy is
adopted. Some of the commonly used NMR experiments to study protein-ligand interactions
are:
1. Exchange NOE experiment
2. Saturation transfer difference experiment
3. Waterlogsy experiment
4. HSQC perturbation experiment
5. Relaxation dispersion experiment
6. Isotope edited or filtered experiments
7. CPMG (Carr-Purcell-Meiboom-Gill sequence) experiments
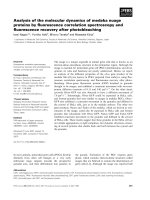
1.4.1 Exchange NOESY experiment
Exchange NOE relies on the transfer of magnetization from protein to ligand while it interacts
with protein and that it retains the same even after it dissociates from the binding site[
26, 27].
The ligand’s ability to retain its bound conformation, after its residence time at the binding
4
CHAPTER 1. Introduction NMR based methods for protein-ligand interaction
pocket, helps us to measure the NOEs of the ligand’sbound conformation. The principle behind
exchange NOE is illustrated in
figure. 1.1.
L
+
P L P L
+
P
Free protein and ligand Bound complex Dissociated complex
L
: No NOE for unbound ligand conformation
L
: Strong NOE for bound ligand conformation
Fig. 1.1: Illustration of transfer NOESY experiment: When ligand interacts with the protein, the confor-
mation of both protein and ligand changes, resulting in a variation of NOE patterns between the free and
bound forms. The structure of the complex can be calculated using the intramolecular and intermolecular
NOEs obtained from this experiment.
The exchange NOE can be either from intramolecular or intermolecular nuclei. Intramolec-
ular NOE are easily observed and usually dominate the spectrum, whereas the most informative
intermolecular NOEs are seen only through scrupulous optimization of the mixing time in the
experiment[
28, 29]. As the NOE pattern of the bound form would be different from that of the
free form of the ligand, the conformation of the protein-ligand complex can be calculated using
exchange NOE as the experimental constrain.
5
CHAPTER 1. Introduction NMR based methods for protein-ligand interaction
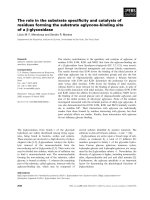
1.4.2 Saturation transfer difference experiment
STD also relies on transfer of magnetization from protein to ligand[22, 30]. This experiment is
more suitable for small to medium sized ligands (∼1 KDa) that are weakly interacting with large
target proteins (>30 KDa). At the outset of the experiment, the protein is saturated with a series
of on-resonance pulses near the chemical shift of the methyl region. Through the process called
“spin diffusion”(magnetization leakage through bonds and space), which is predominantly seen
for large molecules, the protein gets saturated. If any ligand interacts with this saturated pro-
tein, the signal would be transferred from the protein to the ligand during its residence time.
Subsequently, the transverse magnetization of protein is eliminated through the spin lock step
employed in the experiment[9, 30]. Since proteins are large, they relax much faster during spin
lock leaving only the ligand signal to be detected. If the ligand does not interact with protein,
there would not be any transfer of signal before the spin lock step, hence no signal would result.
On the other hand, if the ligand binds strongly to the protein, it becomes a part of the complex
and its signal would be completely annihilated during the spin lock step. Hence neither the
very strong binder nor the very weak binders can be studied through this technique. The signal
transfer at each stage of the experiment is illustrated in figure. 1.2 for three different cases of
interaction.
1.4.3 waterLOGSY
Water-Ligand Observed via Gradient Spectroscopy shares the same principle as that of the STD
NMR experiment except the transfer of magnetization takes place through water molecules
bound to ligand[
31, 32, 33]. Initially, the solvent water molecules are saturated with selec-
tively designed pulses. By spin diffusion and cross relaxation, the bound water saturates the
protein at the region of interaction. If a ligand interacts with the protein, the saturated binding
pocket residues transfer the signal to the interacting ligand. Following this, the water signal is
6
CHAPTER 1. Introduction NMR based methods for protein-ligand interaction
P L
P L
P L
P L
P L
P L
L
L
L
Spin saturation Spin lock Signal
Strong affinity
(K
D
: < 10
−9
M)
Intermediate affinity
(K
D
: 10
−7
− 10
−3
M)
Weak affinity
(K
D
: > 10
−3
M)
Fig. 1.2: Illustration of STD experiment: The transfer of signal from protein to ligand is modulated by the
spin lock step. If the affinity is strong, the signal is annihilated. If it is moderate, the signal will be retained.
For weaker interactions, the signal would not be transferred at all. The circle and box represent protein
and ligand respectively. Hatched structures represent magnetized molecules in contrast to non-magnetised
empty structures.
selectively inverted through another selective pulse. This labels the binding ligand with a neg-
ative signal resulting from a cross relaxation effect between bound water and the ligand. Thus,
when a mixture of binders and non binders are added to the target protein, the binders signal
will be inverted with respect to the non binders. WaterLOSGY is one of the most sensitive
technique available for studying protein-ligand interaction.
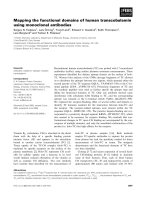
1.4.4 HSQC perturbation experiments
Proteins can be selectively labeled with
15
N or
13
C nuclei while being expressed in a suitable
bacterial expression system. The protons directly attached to
15
N or
13
C through single bond
can be selectively studied using HSQC (Hetero nuclear single quantum coherence) experiments.
7
CHAPTER 1. Introduction NMR based methods for protein-ligand interaction
N (dimension)
N (dimension)
H (dimension) H (dimension)
N
15
HSQC spectrum of
protein alone
N
15
HSQC spectrum of
protein titrated with ligand
Fig. 1.3: Illustration of HSQC perturbation experiment: The peaks present in a HSQC spectrum comes
from protons directly attached to
15
N or
13
C heteronuclei, depending on
15
N or
13
C HSQC experiment
respectively. Initially, the spectrum is recorded in the absence (left) and presence of ligand (right). The
interaction of ligand would result in perturbation of chemical shifts, which are represented as arrows in the
right side figure.
The
15
N HSQC spectrum of a protein will contain all the amide and amine protons present in
the peptide linkages and side chains. The same experiment, when recorded with the addition of
ligand, the chemical shifts of the amide protons will shift due to conformational changes caused
by ligand interactions[
34]. The perturbed amide protons are directly related to the ligand
interaction and hence, used to map the binding site (
figure. 1.3). Like
15
N HSQC,
13
C HSQC
can also be used to map the binding site. Since there are different types of carbons present
within proteins such as C
α
, C
β
, C
γ
, C
δ
and C
η
, the spectrum can be analyzed for any type of
functional group. Usually the spectral region corresponding to methyl groups are analysed, in
spite of it being highly crowded or overlapped.
8