Crystal structure analysis of pils, a type lvb pilin from salmonella typhi
Bạn đang xem bản rút gọn của tài liệu. Xem và tải ngay bản đầy đủ của tài liệu tại đây (2.93 MB, 118 trang )
CRYSTAL STRUCTURE ANALYSIS OF PILS, A TYPE
IVB PILIN FROM SALMONELLA TYPHI
MANIKKOTH BALAKRISHNA ASHA
NATIONAL UNIVERSITY OF SINGAPORE
2007
2
CRYSTAL STRUCTURE ANALYSIS OF PILS, A TYPE
IVB PILIN FROM
SALMONELLA TYPHI
MANIKKOTH BALAKRISHNA ASHA
(B.Sc., B.Ed., M.Sc.)
A THESIS SUBMITTED
FOR
THE DEGREE OF DOCTOR OF PHILOSOPHY
DEPARTMENT OF BIOLOGICAL SCIENCES
NATIONAL UNIVERSITY OF SINGAPORE
2007
i
ACKNOWLEDGEMENTS
.
This research work is by far one of the most significant scientific
accomplishments in my life and it would have been impossible without the following
people, who supported me and had belief in me.
First and foremost, I want to express my wholehearted gratitude and deepest
thanks to my mentor and research advisor Associate Professor K Swaminathan, for
his invaluable support and guidance throughout my research work. He is not only a
great scientist with deep vision but also, and most importantly, a kind and
understanding person with a cheerful disposition. Especially, I would like to thank
him for his patience during the writing of my thesis.
I would also like to express my special and sincere thanks to Dr. Henry Mok
Yu-Keung for initiating the project on the structure determination of PilS.
I gratefully acknowledge the financial support rendered by the National
University of Singapore in the form of Research Scholarship. I am also grateful to the
academic and technical staffs at the Department of Biological Sciences who have
helped me in one way or the other in my research work. I owe very special thanks to
my colleagues Gayathri, Tien-Chye and especially Dileep and to all my friends at
NUS. I want to thank them for all their help, support, interest and valuable hints. Also,
I express my special word of thanks to Sivakumar (former graduate student of Dr.
Swaminathan at IMCB) and Lissa for their help.
I wish to express my sincere appreciation and thanks to Dr. Anand Saxena
(Brookhaven National Laboratory, USA) for his great help in data collection.
I convey my heartfelt thanks to Dr. Gerhard Gruber of School of Biological
Sciences (SBS), Nanyang Technological University (NTU) for giving me an
ii
opportunity to work in his lab as Research Associate even before the completion of
my PhD. I also thank my friends at NTU.
Above all I want to thank my family, which continuously supported me at all
times. I thank my parents for teaching me the value of education at a young age and
my uncle who instilled in me a desire for higher education. I wish to thank my parents
for their love and support, especially at times when they looked after my son during
my data collection trips. Also I am indebted to my brother Anil and sister Usha, and
their families, whose ceaseless encouragement and unflinching support has helped me
to shape my career and life. Words cannot express the love, encouragement and
support I received from my husband Hari, without whose constant help and support,
my Ph.D. research work would have remained a daydream and my dear sons, Bharat
and Arjun whose smiles and love never let me forget what’s really important in life
and buoyed me up. The loving family environment and support I enjoyed from all my
family members was greatly instrumental in providing me the tranquility and
enthusiasm to pursue my research with a piece of mind.
iii
PUBLICATION
Parts of this thesis have already been or will be published in due course:
Balakrishna, A. M., Tan, Y.Y., Mok, H,Y., Saxena, A.M. and Swaminathan, K.
(2006). Crystallization and preliminary X-ray diffraction analysis of Salmonella typhi
PilS. ACTA Cryst. F 62: 1024-1026.
Crystal structure of Salmonella typhi PilS explains the structural basis of typhoid
infection.
Balakrishna, A. M., Mok, H,Y., Saxena, A.M. and Swaminathan, K. (in preparation).
iv
TABLE OF CONTENTS
Page
Acknowledgements i
Publication iii
Table of contents iv
Summary viii
List of abbreviations ix
List of figures xii
List of tables xiv
CHAPTER 1 MACROMOLECULAR X-RAY CRYSTALLOGRAPHY
1.1 CRYSTALLIZATION OF PROTEINS 1
1.2 BASIC CONCEPTS OF X-RAY CRYSTALLOGRAPHY 3
1.2.1 Crystal symmetry and unit-cell 3
1.2.2 Lattice and space group 4
1.3 X-RAY SOURCES AND DETECTORS 5
1.3.1 X-ray sources 5
1.3.2 X-ray detectors 6
1.4 DIFFRACTION OF X-RAYS BY A CRYSTAL 7
1.4.1 X-ray diffraction and Bragg’s law 7
1.4.2 The reciprocal lattice and Ewald sphere 8
1.5 DIFFRACTION DATA TO ELECTRON DENSITY 10
1.5.1 Structure Factor and electron density 11
v
1.5.2 Fourier transform 13
1.5.3 Intensities and the phase problem 14
1.6 PROTEIN CRYSTAL STRUCTURE DETERMINATION 15
1.6.1 Direct method 15
1.6.2 Molecular replacement 15
1.6.3 Multiple isomorphous replacement 16
1.6.4 Multiple-wavelength anomalous dispersion 19
1.6.4.1 Anomalous scattering 19
1.6.4.2 Extracting phases from anomalous scattering data 21
1.7 TECHNIQUES FOR IMPROVEMENT OF ELECTRON DENSITY 22
1.7.1 Calculated structure factors 22
1.7.2 Solvent flattening 23
1.7.3 Molecular averaging 23
1.8 MAP FITTING AND REFINEMENT 23
1.8.1 Fitting of maps 23
1.8.2 Refinement of model coordinates 24
1.9 VALIDATION 27
1.9.1 The omit map 27
CHAPTER 2 BIOLOGICAL BACKGROUND
2.1 BACTERIAL ADHESION 30
2.1.1 Fimbriae of Gram-negative bacteria 31
2.2 TYPE IV PILI 32
2.2.1 General secretion pathway of type IV pili 32
2.2.2 Type IV pilus functions 33
vi
2.2.2.1 Surface motility 34
2.2.2.2 Microcolony and biofilm formation 35
2.2.2.3 Host-cell adhesion 36
2.2.2.4 Cell signaling 38
2.2.2.5 Apoptosis 38
2.2.2.6 DNA binding 39
2.2.3 Characteristics of type IV pili 39
2.2.4 The pilin structure 41
2.3 THE TYPE IVB PILI OF S. TYPHI 43
2.3.1 Role in pathogenesis 44
2.3.2 The receptor of S. typhi 46
2.3.3 Cystic fibrosis and typhoid fever 48
2.4 THE PURPOSE OF THIS STUDY 49
CHAPTER 3 MATERIALS AND METHODS
3.1 EXPRESSION AND PURIFICATION OF RECOMBINANT PILS 50
3.2 BIOPHYSICAL CHARACTERIZATION 52
3.2.1 Dynamic light scattering 52
3.2.2 Mass spectrometry 53
3.3 CRYSTALLIZATION 54
3.4 DATA COLLECTION AND PROCESSING 55
3.4.1 Molecular symmetry 56
3.5 MODEL BUILDING AND REFINEMENT 56
3.5.1 Selenium position determination 56
3.5.2 Structure refinement of ∆PilS 58
vii
3.6 ∆PILS-PEPTIDE COMPLEX AND REDUCED ∆PILS STRUCTURES 58
3.6.1 Crystallization 58
3.6.2 Data collection 59
3.6.3 Structure analysis and refinement 59
CHAPTER 4 RESULTS AND DISCUSSION
4.1 THREE-DIMENSIONAL STRUCTURE OF TYPE IVB PILIN 61
4.1.1 Structure determination 61
4.1.2 Overall structure of
∆
PilS 61
4.2 STRUCTURAL COMPARISON OF TYPE IVB PILINS 65
4.3 INSIGHTS INTO THE PEPTIDE BINDING POCKET 71
4.3.1 ∆PilS-CFTR peptide complex crystallization 72
4.3.2 The complex structure 73
4.3.3 The peptide binding surface of ∆PilS 75
4.4 REDUCED STRUCTURE 79
4.4.1 Structural overview 79
4.4.2 The role of disulfide bonds 81
4.5 DISCUSSION 86
4.6 FUTURE DIRECTIONS 88
4.7 CONCLUDING REMARKS 88
REFERENCES 90
viii
SUMMARY
This is a report on the structure determination of the PilS dimer by X-ray
crystallography. The recombinant protein from Salmonella typhi was overexpressed,
purified and crystallized. The crystals belong to space group P2
1
2
1
2, with unit-cell
parameters a = 77.88, b = 114.53 and c = 31.75 Å. The selenomethionine derivative of
the PilS protein was overexpressed, purified and crystallized in the same space group.
Data sets for the selenomethionine derivative crystal have been collected to 2.1 Å
resolution using synchrotron radiation for multiwavelength anomalous dispersion
(MAD) phasing.
Understanding of the subunit structure and assembly architecture that produce
the Salmonella typhi pili filaments is crucial for understanding pilus functions and for
designing vaccines and therapeutics that are directed to blocking pilus activities. The
target receptor for the S. typhi pilus is a stretch of 10 residues from the first extra-
cellular domain of Cystic Fibrosis Transmembrane Conductance Regulator (CFTR)
(Tsui et al., 2003). The structure of the 26 N-terminal amino acid truncated Type IVb
structural pilin monomer (∆PilS) from S. typhi was determined by NMR (Xu et al.,
2004). In the present study, this ∆PilS protein has been crystallized by the sitting drop
vapor diffusion method. The structure of this protein is determined by the
multiwavelength anomalous dispersion (MAD) method. The complex-∆PilS crystal
structure with the CFTR peptide has given us further insight into the potential
residues that are essential for receptor binding and the implications of the disulfide
bond in pilus assembly.
ix
ABBREVIATIONS AND SYMBOLS
ADSC Area Detector Systems Corporation
ATP Adenosine Triphosphate
BnP Buffalo and Pittsburg Software
Bfp Bundle forming pilus
bp base pair
BSA bovine serum albumin
CCD charge coupled device
cDNA complementary DNA
CF cystic fibrosis
CFTR The cystic fibrosis transmembrane conductance regulator
CNS Crystallography and Nuclear magnetic resonance System
Da dalton
DsbA disulfide bond oxidoreductase-A
DTT 1,4-dithio-DL-threitol
DLS dynamic light scattering
DMSO dimethylsulfoxide
DNA deoxyribonucleic acid
EDTA ethylenediamine tetraacetic acid
EPEC Enteropathogenic Escherichia coli
ETEC Enterotoxigenic Escherichia coli
GC gonococcus or Neisseria gonorrhoeae strain MS11
GnHCl Guanidine Hydrochloride
GRASP graphical representation and analysis of structural properties
IPTG isopropyl-β-thiogalactopyranoside
x
LB Luria-Bertani medium
LPS Lipopolysaccharide
MAD multiwavelength anomalous dispersion
MALDI-TOF matrix assisted laser desorption/ionization – time of flight
MIR multiple isomorphous replacement
MW molecular weight
MWPC multi-wire proportional chamber
NCS Non-crystallographic symmetry
NMR nuclear magnetic resonance
OD optical density
OM outer membrane
PAK Pseudomonas aeroginosa strain K
PAGE polyacrylamide gel electrophoresis
PBS phosphate-buffered saline
PDB Protein Data Bank
PEG poly ethylene glycol
PMSF phenyl methyl sulfonic fluoride
RMSD root mean square deviation
SA Simulated-annealing
SDS sodium dodecyl sulfate
SeMet Selenomethionine
TCP Toxin-coregulated pilus
TcpA Toxin-coregulated pilus subunit
Tris tris hydroxymethyl aminomethane
xi
Amino acids and nucleotides are abbreviated according to either one or three letter
IUPAC codes.
xii
LIST OF FIGURES
Figure 1-1 Idealized phase diagram of a protein solution 2
Figure 1-2
The unit-cell 3
Figure 1-3 Bragg’s law 8
Figure 1-4 Ewald’s sphere 10
Figure 1-5 Vectorial derivation of Bragg’s law 11
Figure 1-6 Structure factor F
HP
for a heavy atom derivative 18
Figure 1-7
Vector solution of F
HP
λ1+
=
F
HP
λ2+
-
∆
F
r
+
-
∆
F
i
+
21
Figure 2-1
Comparision of the topology 42
Figure 2-2 Proposed domain structure of the CFTR protein within the
cell membrane 47
Figure 3-1 SDS-PAGE showing the expression and affinity
chromatographic purification of ∆PilS 51
Figure 3-2 Size exclusion chromatographic purification of ∆PilS protein 52
Figure 3-3 DLS profile of ∆PilS protein 53
Figure 3-4 Mass Spectrometry for ∆PilS crystals 54
Figure 3-5 Native and Selenomethionine ∆PilS crystals 55
Figure 3-6
The
κ
= 180° section from the self-rotation function of
∆
PilS 56
Figure 4-1
Cartoon diagram of the
∆
PilS dimer 62
Figure 4-2
Overall structure of the
∆
PilS monomer 64
Figure 4-3
Secondary structure elements of
∆
PilS 65
xiii
Figure 4-4 Sequence alignment of Type IVb pilins from S. typhi pilus,
toxin-coregulated pilus of V. cholerae and bundle-forming
pilus of enteropathogenic E. coli 66
Figure 4-5
Superimposed models of
∆
PilS
as determined by NMR (green)
and X-ray crystallography (pink) 68
Figure 4-6 Structure overlap of the ∆PilS crystal structure with the TcpA
structure 69
Figure 4-7 Structure overlap of the ∆PilS crystal structure with the NMR
Bfp structure 70
Figure 4-8
Stereoview of the simulated annealing 2Fo-Fc omit map
and 2Fo-Fc map at the peptide region 74
Figure 4-9 Stereoviews of the 2F
o
-F
c
map contoured at the 1.5 σ level at the
82-86 loop region of ∆PilS in the native structure and
complex structure 75
Figure 4-10
A close up view of the peptide bound region 76
Figure 4-11 Superposition of the complex structure and the native
structure in the vicinity of the peptide
77
Figure 4-12
The surface charge property of the native
∆
PilS molecule
and the complex 78
Figure 4-13 Superimposition of the backbones of ∆PilS-S2 and
∆PilS-(SH)2 for residues 32–181 80
Figure 4-14 Sequence alignment of Type IVa P. aeruginosa PAK pilin and
S. typhi PilS 82
Figure 4-15 Structure overlap of the
∆
PilS crystal structure with the full
length PAK pilin structure 83
Figure 4-16
Model of the structure based TCP model 84
Figure 4-17 A close up view of the neighboring subunits of structure based
model of TCP (PDB code:1or9) with ∆PilS crystal structure 85
xiv
LIST OF TABLES
Table 1-1 The seven crystal systems 4
Table 3-1 Data collection and analysis 57
Table 4-1
Data collection statistics for ∆PilS – CFTR peptide complex
and the reduced ∆PilS protein structures 60
Table 4-2 Refinement parameters 63
1
CHAPTER 1. MACROMOLECULAR CRYSTALLOGRAPHY
Protein crystallography investigates, by using diffraction techniques on single
crystals, the three-dimensional structure of biological macromolecules. The major rate
determining step in protein crystallography is the crystallization process.
1.1 CRYSTALLIZATION OF PROTEINS
The process of crystallization of a macromolecule is very complex. Growth of
a protein crystal starts from a supersaturated solution of the macromolecule, and
evolves towards a thermodynamically stable state in which the protein is partitioned
between a solid phase and solution [Weber, 1991]. The crystallization process can
ideally be divided into two steps: a nucleation process that takes place in the labile
zone, and the crystal growth that mainly proceeds in the metastable state (Fig. 1-1).
The time necessary for this equilibrium to be reached has great influence on the final
result, which can vary from an amorphous or microcrystalline precipitate to an
adequately large single crystal.
The ‘salting in’ and ‘salting out’ properties of proteins are used to push
proteins into supersaturation. The ‘salting in’ effect is explained by considering the
protein as an ionic compound. According to the Debye-Huckel theory for ionic
solutions, an increase in the ionic strength lowers the activity of the ions in the
solution and increases the solubility of ionic compounds. In ‘salting out’, precipitation
is achieved by increasing the effective concentration of the protein, usually by adding
salts, organic solvents, and polyethylene glycols (PEG). The most popular salt is
ammonium sulphate because of its high solubility. Precipitating properties of organic
solvents can be ascribed to the double effect of subtracting water molecules from the
2
solution and to decreasing the dielectric constant of the medium. PEG is a polymer,
available in molecular weights ranging from 200 to 20 000 Da; its effect on solubility
is due to volume exclusion property: the solvent is restructured and the phase
separation is consequently promoted.
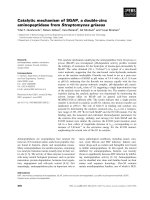
Figure 1-1. Idealized phase diagram of a protein solution, as a function
of the concentrations of the protein [M] and precipitating agent [Pr].
A second method of protein precipitation is to diminish repulsive forces
between protein molecules or to increase attractive forces. These forces can be of
different types like electrostatic, hydrophobic, and hydrogen bonding. Electrostatic
forces are influenced by an organic solvent such as alcohol, or by a change in pH. The
strength of hydrophobic interactions increases with temperature and is largely entropy
driven [Drenth, 1999].
In both methods, bringing the protein to a supersaturated state is indispensable
for crystallization. To achieve usable crystal growth, the supersaturation must be
properly regulated. Maintaining a high supersaturation would result in the formation
of too many nuclei and therefore too many small crystals.
3
1.2 BASIC CONCEPTS OF X-RAY CRYSTALLOGRAPHY
1.2.1 Crystal symmetry and unit-cell
Crystals exhibit clear-cut faces and edges that are related to the periodic
arrangement of the contained molecules. All crystals contain at least one of the three
symmetry elements, namely, inversion, rotation and reflection. This is reflected by the
fact that an asymmetric unit (the unique volume of a crystal containing one or more
motif of molecules) is repeated to form a unit-cell or the basic building block, which
when repeated along three non-coplanar vectors will generate the entire crystal. Based
on the minimum requirement of symmetry elements to generate a pattern of unit-cell
arrangements that can fill space, crystals are grouped into 7 systems: triclinic,
monoclinic, orthorhombic, tetragonal, trigonal, hexagonal and cubic. Coincidentally,
except for the trigonal system, other systems warrant a correspondingly named unit-
cell. The trigonal system can use only a hexagonal unit-cell in some cases and a
rhombohedral unit-cell (or its equivalent hexagonal unit-cell) in other cases. The
geometry of the unit-cell is defined by six parameters: the lengths of three unique
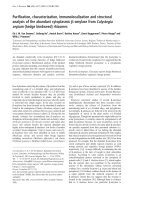
edges (a, b, and c) and three unique interaxial angles (α, β, and γ), Fig. 1-2. The shape,
Figure 1-2.
The unit-cell
whether cube, parallelepiped, or whatever, determines the crystal system, seven of
which exist (Table 1-1).
4
Table 1-1. The seven crystal systems.
Crystal System Conditions imposed on cell geometry
Triclinic a ≠ b ≠ c α ≠ β ≠ γ
Monoclinic a ≠ b ≠ c α = γ = 90˚, β > 90˚
Orthorhombic a ≠ b ≠ c α = β = γ = 90˚
Tetragonal a = b ≠ c α = β = γ = 90˚
Trigonal a = b ≠ c α = β = 90˚, γ = 120˚
Hexagonal a = b ≠ c α = β = 90˚, γ = 120˚
Cubic a = b = c α = β = γ = 90˚
1.2.2 Lattice and space group
A crystal can be regarded as a three dimensional stack of unit-cells with their
edges forming a grid or lattice. The line along the a direction is called the x-axis of the
lattice; the y-axis is in the b direction and the z-axis is in the c direction. The x-, y-
and z-axes together form a right-handed coordinate system. The possibilities of 4
types of unit-cell arrangements [primitive (P), body centered (I), face centered (F) or
end centered (C or its variations)] in the 7 crystal systems allow a total of 14 Bravais
lattices in crystallography. The combination of the lattice type of a crystal system and
the applicable symmetry elements for that system (including the screw axis that
degenerates from rotation and the glide plane that degenerates from reflection) will
define the entire packing pattern of molecules, known as space group, for that system.
Because proteins are enantiomorphic (only L- and not D-amino acids are relevant),
neither the mirror symmetry nor the inversion symmetry will be possible in protein
crystals. As a consequence, the 230 possible space groups in crystallography are
reduced to 65 in protein crystallography.
5
1.3 X-RAY SOURCES AND DETECTORS
1.3.1 X-ray sources
X-rays of suitable wavelengths for diffraction experiments can be produced by
a sealed tube, a rotating anode or a synchrotron source. In a sealed X-ray tube an
electron beam impinges on the anode, which is usually a copper or molybdenum
plate. Most of the electron energy is converted to heat, which is removed by cooling
the anode, usually with water. Heating produces three effects: surface roughening,
target melting and thermal stress, which are caused by differential expansion of target
material at the edge of the focal spot. The heating of the anode caused by the electron
beam at the focal spot limits the maximum power of the tube. This limit is reduced in
a rotating anode X-ray generator, where the anode is a rotating cylinder instead of a
fixed piece of metal. The rotating target can sustain 7-45 times more power loading
than sealed tubes. The second advantage of the rotating anode is small source width
(0.1-0.2 mm) with very high brilliance.
X-rays in synchrotron sources may be output by bending magnets or,
preferentially, by insertion devices (multipole wigglers and undulators). One of the
main advantages of synchrotron radiation for X-ray diffraction is high intensity,
which is profitably used by protein X-ray crystallographers to collect data on very
thin or weakly diffracting crystals or crystals with extremely large unit-cells. In
synchrotron radiation any suitable wavelength in the spectral range can be selected
with a suitable monochromator and this property is used in the multiple wavelength
anomalous dispersion (MAD) and for Laue diffraction studies. For a protein X-ray
diffraction experiment, the wavelength is tuned to 1 Å or even shorter. The shorter
wavelength has lower absorption along its path and in the crystal. Synchrotron
radiation, in contrast to X-ray tube radiation, is highly polarized. The polarization of
6
the X-ray beam from a synchrotron has an effect on the anomalous X-ray scattering of
atoms which occurs when the X-ray wavelength approaches the absorption edge
wavelength.
1.3.2 X-ray detectors
In an X-ray diffraction experiment the intensities of all diffracted beams
within given resolution should be measured. Common detectors in small molecule
crystallography use scintillation counters. For measuring diffracted intensities in
protein crystallography the classical single counter and photographic film have been
thrown into shade today by the introduction of much faster 2D detectors like
multiwire proportional chamber (MWPC), imageplate and charge-coupled device
(CCD).
The imageplate is the most widely used type of detector, very popular because
of its speed, sensitivity, convenience of use and maintenance. It is made of a thin layer
of an inorganic phosphor on a flat base. X-ray photons excite electrons in the material
to higher energy levels. One part of the energy is emitted as normal fluorescent light
in the visible wavelength region, but another part is retained in the material by
trapping electrons in color centers. The imageplate is read out by a laser beam on a
scanner measuring the luminescence emitted by the color centers. The image plate can
be erased by exposure to intense white light and used repeatedly [Miyahara et al.,
1986].
In another kind of area detector the video tube is replaced by a charge coupled
device (CCD). They have a high dynamic range, combined with excellent spatial
resolution, low noise, and high maximum count rate [Walter et al., 1995]. The CCD is
best optimized for rapid data collection aimed at single crystal structure solution and
refinement.
7
1.4 DIFFRACTION OF X-RAYS BY A CRYSTAL
Although Roentgen discovered X-rays in 1895, their application in
crystallography was first demonstrated only in 1912 by von Laue. Through his
experiments Laue showed that diffraction of X-rays could be described in terms of
diffraction from a 3 dimensional grating and the sequence of events that followed is
one of the most fascinating chapters in the history of science.
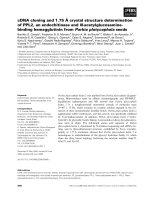
1.4.1 X-ray diffraction and Bragg’s law
X-ray diffraction from crystalline solids occurs as a result of the interaction of
X-rays with the electron charge distribution in the crystal lattice. The ordered nature
of the electron charge distribution, whereby most of the electrons are distributed
around atomic nuclei that are regularly arranged with translational periodicity, means
that superposition of scattered X-ray amplitudes will give rise to regions of
constructive and destructive interference producing a diffraction pattern. Each
diffraction maximum in the diffraction pattern is considered to be the combined result
of diffraction of the incident X-ray beam of wavelength λ from crystal lattice planes
with Miller indices hkl (the integral divisions made by the planes on the a, b and c
axes of the unit-cell, respectively) and interplanar spacing d
hkl
.
In 1912, immediately after von Laue’s discover of the diffraction of X-rays by
crystals, W.L. Bragg noticed the similarity of diffraction to ordinary reflection and
deduced a simple equation treating diffraction as “reflection” from planes in the
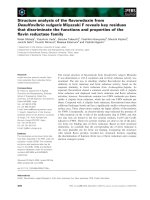
lattice. In order to derive the equation, we consider an X-ray beam that is incident on
a pair of parallel planes P
1
and P
2
with interplanar spacing d. The parallel incident
rays 1 and 2 make an angle θ with these planes. Electrons located at O and C will be
forced to vibrate by the oscillating field of the incident beam and as vibrating charges,
8
will radiate in all directions with the same incident wavelength. For that particular
direction where the parallel secondary rays 1´ and 2´ emerge at angle θ as if reflected
from the planes, a diffracted beam of maximum intensity will result if the waves
represented by these rays are in phase. Dropping perpendiculars from O to A and B,
respectively, it becomes evident that ∠AOC = ∠BOC = θ. Hence AC = BC, and
waves in ray 2´ will be in phase, that is, crest to crest, with those in 1´ if AC + CB (=
2AC) is an integral number of wavelengths λ (Fig. 1-3). This is expressed by the
equation,
2AC = 2d sin θ = n λ (1.1)
where n is an integer. This is Bragg’s law [Stout & Jensen, 1989].
1.4.2 The reciprocal lattice and Ewald sphere
The concept of reciprocal space arises from the observation that in a
diffraction experiment, the diffraction maximum of a set of planes with finer
interplanar spacing is recorded farther from the direct beam position than that for a set
of planes with greater interplanar spacing.
Figure 1-3. Bragg’s law
C
9
By rearranging Bragg’s law, sin θ = nλ/2 (1/d), and thus sin θ is inversely
proportional to d, the interplanar spacing in the crystal lattice. Since sin θ is a measure
of the deviation of the diffracted beam from the direct beam, it is evident that
structures with large d will exhibit compressed diffraction patterns, and conversely for
small d values. Interpretation of X-ray diffraction patterns would be easily facilitated
if the inverse relationship between sin θ and d could be replaced by a direct
relationship. What amounts to this can be achieved by constructing a lattice based on
reciprocal d (1/d), a quantity that varies directly with sin θ.
From the dimensions of a real unit-cell, its orientation on an instrument and
the wavelength of radiation, the reciprocal lattice positions for a given set of planes
can be determined. Conversely, from a set of reciprocal lattice vectors, their positions
on the detector, the geometry of the goniostat used for data collection and the
wavelength, the unit-cell parameters can be determined. As the reciprocal lattice bears
a direct relationship with the crystal, rotation of the crystal will cause a similar
rotation of the reciprocal lattice.
A geometrical description of diffraction that encompasses Bragg's law was
originally proposed by Ewald. The advantage of this description, the Ewald
construction, is that it allows the observer to calculate which Bragg peaks will be
observable if the orientation of the crystal on the goniostat is known. As an example,
consider a two-dimensional reciprocal lattice. Constructive interference occurs when a
set of crystal lattice planes separated by a spacing of d
hkl
are inclined to an angle θ
hkl
with respect to the incident beam. A diffracted beam can be measured at an angle 2θ
hkl
from the incident beam. The diffraction vector is perpendicular to the crystal lattice
planes and has a length inversely related to the spacing between the planes.
|R
hkl
| = 1/d
hkl
= (2 sinθ
hkl
) / λ (1.2)