Crystal structure of amyb, an alpha amylase from halothermothrix orenii, and comparison with its homologs
Bạn đang xem bản rút gọn của tài liệu. Xem và tải ngay bản đầy đủ của tài liệu tại đây (15.37 MB, 141 trang )
CRYSTAL STRUCTURE OF AMYB, AN α-
AMYLASE FROM HALOTHERMOTHRIX ORENII,
AND COMPARISON WITH ITS HOMOLOGS
Tien Chye Tan
Submitted 14 April 2007
A THESIS SUBMITTED FOR THE DEGREE OF
DOCTOR OF PHILOSOPHY
DEPARTMENT OF BIOLOGICAL SCIENCES
NATIONAL UNIVERSITY OF SINGAPORE 2007
I
PUBLICATIONS
Paper I
Tan, T.C., Yien, Y.Y., Patel, B.K., Mijts, B.N., and Swaminathan, K. (2003).
Crystallization of a novel alpha-amylase, AmyB, from the thermophilic halophile
Halothermothrix orenii.
Acta Crystallografica sect. D 59, 2257-2258.
Paper II
Huynh, F., Tan, T.C., Swaminathan, K., and Patel, B.K. (2005).
Expression, purification and preliminary crystallographic analysis of sucrose
phosphate synthase (SPS) from Halothermothrix orenii.
Acta Crystallographica sect. F 61, 116-117.
II
ACKNOWLEDGEMENTS
In my list of acknowledgements, there are people with specific contributions and
also people who have helped me in many small but important ways that are
impossible to list. The following list is by no means complete nor are the
contributions of those listed limited to what is listed. It is just a weak attempt to
thank everyone for their help and kindness shown to me during my time here.
Dr Victor Wong and Dr Kunchithapadam Swaminathan for their patience and
guidance. Dr Wong for getting me started in research and for believing in me. Dr
Swami for burning the midnight oil to help me get my thesis out on time.
My collaborator Dr Bharat Patel for spending hours educating me on his field. Dr
Jayaraman Sivaraman for putting up with my endless list of questions.
Thanks also go out to my ‘editor’ Maykalavaane d/o Narayanan for helping make
sense of my disjointed thoughts and my dyslexic spelling.
My lab mates, members of Structural Biology Lab for the mayhem and chaos to
spice up our stay here. Not forgetting the department staff who definitely have
help a lot in their own way.
Dr Christina Divne for supervision on additional experimental results presented in
the revised version of the thesis, and advice on revision of the thesis. And for
pulling my brain out of the gutter and getting it to stay focused.
Prof Birte Svensson and Dr Karen Marie Jakobsen at BioCentrum-DTU (Lyngby,
Denmark) for supplying the acarbose inhibitor, which was put to good use.
Of course there is my mom but that would take up another thesis on its own so I
shall just say “THANKS MOM”.
III
Table of Contents
Publications
I
Acknowledgements
II
Table of Contents
III
List of Tables
VII
List of Figures
VIII
List of abbreviations used
X
Summary
XIII
1 INTRODUCTION
1
1.1 Extremophiles
1
1.1.1 Adaptation to high salinity
1
1.1.2 Thermal adaptation
3
1.1.3 Stabilization mechanisms
5
1.2 Classification of carbohydrate-active enzymes
5
1.2.1 Carbohydrates as enzyme substrates
5
1.2.2 Carbohydrate-active enzymes are classified in CAZy
7
1.2.3 Reaction mechanisms of glycoside hydrolases
9
1.2.4 Modes of action in GH enzymes
11
1.2.5 The TIM barrel is a recurrent fold in GH enzymes
13
1.2.6 Linking CBMs to catalytic domains
15
1.3 Starch and starch-processing enzymes
17
1.3.1 Starch – the enzyme substrate
17
1.3.2 Starch-processing enzymes
20
1.3.3 The
α
-amylase superfamily
23
1.3.4 Starch-binding CBMs
27
1.4 The bacterium Halothermothrix orenii and its α-amylases
28
1.4.1 Halothermothrix orenii
28
IV
1.4.2 Halothermothrix orenii produces two
α
-amylases
28
1.4.3 Biochemical characteristics of AmyA and AmyB
30
1.4.4 Thermal inactivation studies on AmyA and AmyB
31
1.4.5 Salt dependence of AmyA and AmyB
32
1.4.6 Content of charged amino acids in AmyA and AmyB
33
1.4.7 Crystal structure of AmyA
33
1.5 Applications
34
1.6 Scope of the thesis
34
2 MATERIALS AND METHODS
35
2.1 PCR and cloning
35
2.1.1 Construct design and PCR
35
2.1.2 Preparation of competent cells
37
2.1.3 Cloning and transformation
38
2.1.4 Preparation of the expression vector
38
2.2 Protein expression and purification
39
2.2.1 Protein expression
39
2.2.2 Protein purification
40
2.2.3 Enzyme purity
42
2.2.4 Amylase activity assay
42
2.2.5 Starch binding
43
2.2.6 Protein stability
43
2.3 Crystallographic analysis
44
2.3.1 Initial crystallization screening
44
2.3.2 Optimization of crystallization conditions and ligand soaks
45
2.3.3 X-ray diffraction data collection
45
2.3.4 Structure determination and refinement
46
2.3.5 Various analyses
48
V
3 RESULTS
50
3.1 Analysis of the lipoprotein signal sequence
50
3.2 Cloning and protein production
51
3.2.1 Cloning of
Δ
AmyB
51
3.2.2 Purification of AmyB and
Δ
AmyB
51
3.2.3 Starch degradation studies on AmyB and
Δ
AmyB
53
3.2.4 Starch binding studies on AmyB and
Δ
AmyB
54
3.2.5 Stability analysis of AmyB and
Δ
AmyB
56
3.3 Protein crystallization and optimization
58
3.4 Data collection and processing
60
3.4.1 AmyB crystal form I
60
3.4.2 AmyB crystal form II
60
3.4.3 AmyB crystal form III
61
3.4.4 AmyB crystal form IV
62
3.5 Structure determination, model building and refinement
64
3.5.1 Original AmyB structure
64
3.5.2 Acarbose complex
67
3.5.3 Maltoheptaose/cyclodextrin complex
67
3.6 The crystal structure of AmyB
68
3.6.1 Quality of the final models
68
3.6.2 Domains A and B – the catalytic module
71
3.6.3 Domain C
72
3.6.4 Domain N
74
3.7 Binding of oligosaccharides to AmyB
82
3.7.1 Binding of acarbose-derived oligosaccharide
82
3.7.2 Binding of maltoheptaose and
α
-cyclodextrin
90
3.7.3 The active site in AmyB
92
VI
4 DISCUSSION
95
4.1 The natural substrate
95
4.1.1 Natural habitat of Halothermothrix orenii
95
4.1.2 Possible natural substrates for H. orenii AmyB
95
4.2 Stability and adaptation
97
4.2.1 Influence of negatively charged surfaces
97
4.2.2 Influence of the cation triad
99
4.2.3 Influence of methionine content
100
4.2.4 Thermal stability as a function of salt concentration and pH
100
4.3 AmyB represents a unique member of the
α
-amylase family
101
4.3.1 AmyB is a membrane-bound enzyme
101
4.3.2 Role of the N domain
103
4.3.3 AmyB is unique compared with AmyA and other
α
-amylases
104
5 CONCLUSIONS
106
6 REFERENCES
108
Paper I
Paper II
VII
LIST OF TABLES
Table 1.1. Categories of halophiles
Table 1.2. Clans and folds of glycoside hydrolases
Table 1.3. CBM fold families
Table 1.4. Types of carbohydrate binding platforms
Table 1.5. Characteristics of exoamylases
Table 3.1. Statistics for data collection.
Table 3.2. Statistics for crystallographic refinement.
Table 3.3. Interface parameter analysis for domain A/N association.
Table 3.4. Mapping of sugar residues of acarbose-derived oligosaccharides to the
active-site subsites of the
α
-amylases BA2, AmyB and BHA.
Table 3.5. Interactions with a nonasaccharide in the A-B groove of AmyB
ACR
.
Table 3.6. Interactions with acarbose in the N-C groove of AmyB
ACR
.
Table 3.7. Interactions with
α
-D-glucose in the B1 and B2 sites of AmyB
ACR
.
Table 3.8. Interactions with maltotetraose in the A-B groove of AmyB
MAL7-ACX
.
Table 3.9. Interactions with maltotetraose in the N-C groove of AmyB
MAL7-ACX
.
VIII
LIST OF FIGURES
Figure 1.1. Chair representation of cellobiose.
Figure 1.2. Reaction mechanisms for glycoside hydrolases.
Figure 1.3. Active-site topologies of glycoside hydrolases.
Figure 1.4. GH clans with the TIM-barrel fold.
Figure 1.5. Sugar-binding platforms in CBMs.
Figure 1.6. Structure of starch components.
Figure 1.7. Helical structure of V- and A-amylose.
Figure 1.8. Enzymes involved in starch processing.
Figure 1.9. The domain-organization of
α
-amylases.
Figure 1.10. The active site in Bacillus circulans strain 251 CGTase.
Figure 1.11. The structure of a lipoprotein secretion-signal peptide.
Figure 2.1. Schematic representation of AmyB constructs.
Figure 2.2. Schematic representation of the amyB-containing pTHAB template.
Figure 3.1. Lipoprotein signal peptide in AmyB.
Figure 3.2. Analysis of protein purity by SDS-PAGE.
Figure 3.3. Gel-filtration chromatogram for AmyB (B2) and ΔAmyB (B3).
Figure 3.4. Analysis of protein purity by SDS-PAGE.
Figure 3.5. Rate of starch degradation by AmyB and ΔAmyB.
Figure 3.6. Binding of AmyB and ΔAmyB to raw starch as a function of [NaCl].
Figure 3.7. T
m
values for AmyB and ΔAmyB as a function of NaCl concentration at
different pH values.
Figure 3.8. T
m
values for AmyB and ΔAmyB as a function of pH at different NaCl
concentrations.
Figure 3.9. Morphology of slow-growing, non-optimized AmyB crystal forms I-III.
Figure 3.10. Morphology of AmyB crystal form IV.
Figure 3.11. Diffraction pattern of the AmyB
ACR
crystal.
Figure 3.12. Crystal packing in the C2 unit cell of the AmyB-III crystal form.
IX
Figure 3.13. Ramachandran analysis of the AmyB models.
Figure 3.14. Representative electron density for AmyB models.
Figure 3.15. Overall structure of AmyB.
Figure 3.16. Topology diagram for the catalytic A/B domain in H. orenii AmyB.
Figure 3.17. Topology diagram of the AmyB-C domain.
Figure 3.18. Overall fold of the AmyB-N domain.
Figure 3.19. Structural superposition of H. orenii AmyB-N with P. syringae CopC.
Figure 3.20. Domains that are topographically similar to the AmyB-N domain.
Figure 3.21. The location of the N domain in
α
-amylases.
Figure 3.22. Chair configuration of acarbose.
Figure 3.23. Electron density around the –2 subsite in the A-B groove.
Figure 3.24. Binding of the nonasaccharide in the A-B groove of AmyB.
Figure 3.25. Binding of acarbose in the N-C groove of AmyB.
Figure 3.26. Picture showing the positions of carbohydrate bound to AmyB
ACR
.
Figure 3.27. Picture showing the positions of carbohydrate bound to AmyB
MAL7-ACX
.
Figure 3.28. The active site in AmyB.
Figure 3.29. Comparison of the active-site loops in AmyB and AmyA.
Figure 4.1. Electrostatic potential surfaces at different salt concentrations.
Figure 4.2. Model of full-length AmyB on the lipid membrane.
X
LIST OF ABBREVATIONS USED
3-D three-dimensional
6-His hexahistidine
ACR acarbose = O-4,6-Di-deoxy-4-[[(1S,4R,5S,6S)-4,5,6-trihydroxy-3-
(hydroxymethyl)-2-cyclohexen-1-yl]amino]- α-D-glucopyranosyl-
(1-4)-O-α-D-glucopyranosyl-(1-4)-D-glucose
ACX
α
-cyclodextrin; synonyms: cyclohexaamylose, cyclomaltohexaose
AmyA Halothermothrix orenii
α
-amylase type A
amyA Halothermothrix orenii
α
-amylase type A gene
AmyB Halothermothrix orenii
α
-amylase type B, full-length enzyme
amyB Halothermothrix orenii
α
-amylase type B gene
AmyB
ACR
AmyB in complex with the inhibitor acarbose
AmyB
MAL7-ACX
AmyB in complex with maltoheptaose and
α
-cyclodextrin
AmyB-N N domain of H. orenii AmyB
ASA solvent-accessible surface area
BLAST Basic Local Alignment Search Tool
BSA bovine serum albumin
CAZy Carbohydrate-Active Enzyme database
CBH cellobiohydrolase
CBM carbohydrate-binding module
CE carbohydrate esterase
CGTase cyclodextrin glycosyltransferase
Cop copper resistance protein
cop copper resistance operon
C-terminal carboxy-terminal
CV column volume
Da Daltons
XI
ΔAmyB Halothermothrix orenii
α
-amylase type B, lacking N domain
DNA deoxyribonucleic acid
dNTP deoxyribonucleotide triphosphate
DP degree of polymerization
DTT dithiothreitol
EC number European Commission number
EG endoglucanase
EK enterokinase
ExP exopolysaccharidase
GH glycoside hydrolase
GT glycosyl transferase
Hepes 4-(2-hydroxyethyl)-1-piperazineethanesulfonic acid
IDA iminodiacetic acid
Ig immunoglobulin
IMAC immobilized metal affinity chromatography
IPTG isopropyl β-D-1-thiogalactopyranoside
IUBMB International Union of Biochemistry and Molecular Biology
LB Luria Bertoni
Mes 2-(N-morpholino) ethanesulfonic acid, or 4-morpholine
ethanesulfonic acid
Mops 3-(N-Morpholino) propanesulfonic acid, or 4-morpholine
propanesulfonic acid
MPD 2-methyl 2,4-pentanediol
MS monosaccharidase
NCBI National Center for Biotechnology Information
NCM non-catalytic module
NMR nuclear magnetic resonance
N-terminal amino-terminal
XII
NTA nitrilotriacetic acid
OD
600
optical density measured at 600 nm
PCR Polymerase Chain Reaction
PEG polyethylene glycol
PL polysaccharide lyase
r.m.s root-mean-square
r.m.s.d root-mean-square deviation
SDS-PAGE sodium dodecyl sulfate polyacrylamide gel electrophoresis
ThMA Thermus maltogenic amylase
TIM triosephosphate isomerase
TLS translation, libration, screw-rotation
Tris 2-amino-2-(hydroxymethyl)-1,3-propanediol
TVA I Thermoactinomyces vulgaris
α
-amylase I
TVA II Thermoactinomyces vulgaris
α
-amylase II
UV ultraviolet
X-gal 5-bromo-4-chloro-3-indolyl- beta-D-galactopyranoside
XIII
SUMMARY
We have determined, by means of molecular replacement, the crystal structure of
the halotolerant and thermostable
α
-amylase AmyB from Halothermothrix orenii
at 2.3 Å resolution. In addition, the structures of AmyB in complex with a
nonasaccharide resulting from transglycosylation of the inhibitor acarbose at 1.35
Å resolution, and the 2.2 Å structure of the enzyme in complex with hydrolysis
products of maltoheptaose have been determined. The 1.35 Å structure is
hitherto at the highest resolution available for any
α
-amylase, and the details of
oligosaccharide binding give a highly accurate picture of how the enzyme
interacts with a single amylosic chain, as well as insoluble starch. The crystal
structures of AmyB complexes have also made it possible to identify a novel
binding site for raw starch formed by the N-terminal domain and the rest of the
molecule, the N-C groove. Results from starch-binding studies using full-length
AmyB and a truncated mutant lacking the N domain show that the presence of
the N domain enhances binding to the insoluble substrate. Moreover, the present
study has confirmed a sequence signal for a lipoprotein peptide in AmyB that
serves to anchor the enzyme to the bacterial membrane. Based on the above
observations we have produced a tentative model as to how the full-length
enzyme is immobilized to the membrane surface. Results presented in this thesis
show that AmyB is indeed unique compared with other
α
-amylases in that it is
membrane bound, monomeric, and carries an N-terminal domain between the
membrane linker and domain A that forms a large groove for binding of raw
starch. We observe that for AmyB the conditions for maximal stability to
unfolding and stability at maximum catalytic performance do not coincide; and we
provide a rational explanation for the tendency of the other H. orenii amylase,
AmyA, to aggregate in the absence of salt.
1
1 INTRODUCTION
1.1 Extremophiles
Over the years, a large number of microorganisms has been isolated from
a variety of different habitats, of which some are termed extreme environments
and are inhospitable to humans. Extreme environments include those with
extremely low or high temperatures, low or high pH, high salinity or high
pressure. While there is basic biological interest in understanding how
microorganisms are able to adapt and survive under extreme conditions, there is
also biotechnological and industrial interest in these enzymes. Increased
understanding of the underlying adaptive mechanisms would help to better utilize
the enzymes industrially and to tailor them for specific industrial bioprocessing
purposes.
1.1.1 Adaptation to high salinity
The main problem that microorganisms face in a saline environment is
water loss by osmosis. As the cytoplasmic membrane is permeable to water, one
possible solution would be to regulate the osmotic potential of the cytoplasm such
that it equals that of the outside environment. The osmotic potential of the
cytoplasm can be increased by accumulation of either inorganic salts (“salt-in”
strategy), or osmolytes, i.e., low molecular weight non-salt compounds
(“compatible-solute” strategy; Madigan & Oren, 1999).
The compatible-solute strategy is used by most halophilic bacteria,
eukaryotic algae, fungi and even some halophilic metoganogenic archaea. Here,
the strategy is to balance the osmotic pressure of the medium by organic
compatible solutes, or osmolytes (Madigan & Oren, 1999). This strategy does not
require any adaptation of the intracellular system, and thus, enzymes that are not
adapted to high-salt conditions would still be stable and active in the cytoplasm.
2
Possible osmolytes include carbohydrates, amino acids, methylamine, and
methylsulphonium zwitterions. These are highly water-soluble, polar molecules
that are uncharged or zwitterionic at physiological pH. The concentration of
osmolytes is regulated according to the external salt concentration. Although the
salt concentration of the cytoplasm would be low, it contains high concentrations
of osmolytes that ensure osmotic balance (Grant et al., 1998). In addition to
increasing the osmotic potential of the cytoplasm, osmolytes are also able to
stabilize proteins that are under the stress of heat or pressure. This strategy
provides the host organism with a high degree of flexibility and adaptability to
differing environmental conditions (Grant et al., 1998). The categorization of salt
tolerance and optimal salt conditions that have been adapted by Grant and co-
workers (1998) is listed in Table 1.1.
Table 1.1. Categories of halophiles
Salt Concentration (M)
Range
Optimum
Type
Low
High
Low
High
Non-halophile
0
1.0
< 0.2
Slight halophile
0.2
2.0
0.2
0.5
Moderate halophile
0.4
3.5
0.5
2.0
Borderline extreme halophile
1.4
4.0
2.0
3.0
Extreme halophile
2.0
5.2
> 3.0
Halotolerant
0
1.0
< 0.2
Haloversatile
0
>3.0
0.2
0.5
Current studies on the adaptation of proteins to halophilic conditions have
been limited to those derived from microorganisms that require at least 2.5 M salt
for optimal growth. Hence, most of the well-characterized halophilic proteins have
3
been purified from a group of the Halobacteriaceae family. Most members of this
family use the salt-in strategy, and accumulate high concentrations of potassium
chloride in the cytoplasm. Proteins from halophilic microbes would generally
unfold or become inactivated in low salt conditions (<1 M NaCl). Typically, these
proteins show a higher content of negatively charged amino-acid residues
compared to their mesophilic counterparts and concomitant lower isoelectric
points (DasSarma et al., 2006). Concomitant with the higher density of acidic
amino-acid residues, there is a significant reduction of lysine residues, as well as
an increased number of small hydrophobic amino-acid residues, and a reduction
in the number of aliphatic amino-acid residues. As a result, the molecular surfaces
of halophilic proteins feature highly negative electrostatic potentials that have
been suggested to be an important mechanism in halophilic adaptation (Madern
et al., 2000). The negative electrostatic surface potential appears to be attributed
mainly to an increase in aspartate residues (Fukuchi et al., 2003).
It should be noted that, although the term “halophilic protein” implies a
enzyme that is active and stable only at high salt conditions, there are
halotolerant proteins that, while stable and active at high salt concentrations,
have evolved to function at lower salt concentrations by mechanisms that remain
poorly understood.
1.1.2 Thermal adaptation
There are no firm rules that govern the thermostability of proteins,
however, there are several strategies with which thermostability can be attained.
Structural strategies include highly hydrophobic cores, reduced surface-to-volume
ratios, a decrease in glycine content, a high number of electrostatic interactions,
higher states of oligomerization, and shortening of surface loops (Madigan &
Oren, 1999). A key feature of thermophilic proteins is a bias in amino acid
composition. Thermophilic proteins are usually rich in charged amino-acid
4
residues while having a scarce amount of polar amino-acid residues.
Thermophilic proteins, unlike their mesophilic and non-halophilic counterparts,
show an increase in alanine and threonine residues at the expense of asparagine
residues (Fukuchi et al., 2003). Comparisons of the amino-acid composition
between the molecular surfaces of thermophilic and mesophilic proteins show that
the bias in composition occurs mainly at the molecular surface (Fukuchi &
Nishikawa, 2001).
Both halophilic and thermophilic proteins show an increase in the number
of charged amino-acid residues compared with their mesophilic homologs.
However, the halophilic proteins show a bias towards acidic amino-acid residues,
while the thermophilic proteins have an equal partitioning of acidic and basic
amino-acid residues on the surface. The simultaneous increase in acidic and basic
amino acids enables more ion pairs to form at the surface that may help stabilize
thermophilic proteins (Karshikoff & Ladenstein, 2001; Fukuchi et al., 2003). Ion
pairs are often formed between side chains that are distant in the amino-acid
sequence, and they tend to be organized into networks that can be found on the
protein surface, partially buried inside the protein, or at domain or subunit
interfaces. Such networks show a high degree of cooperativity to the extent that
the stabilization effect cannot be reduced to merely the sum of ion-pair
interactions. Although ion pairs have an important role in the stabilization of
thermophilic proteins, they are not the sole determinants of thermostability.
A major shortcoming of most studies that attempt to explain the
mechanisms of thermal adaptation is that only small sets of proteins are
compared and analyzed. However, well into the post-genomic era it is now
possible to take full advantage of genomic data and the outcomes of structural-
genomics projects to analyze, with statistical significance, various factors
responsible for the adaptation process. In a recent study (Robinson-Rechavi et
al., 2006), a large dataset of protein structures from the hyperthermophilic
5
bacterium Thermotoga maritima was compiled and analyzed together with
structures of close protein homologs of mesophilic origin. The results showed that,
contrary to what has been suggested previously, factors such as oligomerization
order, hydrogen bonds, and secondary structures are of minor importance to the
adaptation process in bacteria. Statistically significant contributions to stability
were observed for density of salt bridges and compactness, which accounted for
changes in 96% of the protein pairs studied.
1.1.3 Stabilization mechanisms
One hypothesis (Mevarech et al., 2000) suggests that stabilization of
halophilic proteins by means of excess acidic amino-acid residues is best
explained by the solvation-stabilization model. In this model, acidic surface-
exposed amino acids bind cooperatively to a network of hydrated salt ions to
which water molecules become associated to form a solvation shell. At reduced
salt concentration, however, the protein-associated solvation shell is depleted of
salt ions, which may destabilize the protein and induce unfolding (Mevarech et al.,
2000). The strength of solvent-protein interactions is solvent and salt dependent,
and thus, factors such as complex ion-pair networks, weak protein-protein
interactions, and specific ion bindings are additional factors that contribute to
stability and solubility of halophilic proteins (Premkumar et al., 2005).
1.2 Classification of carbohydrate-active enzymes
1.2.1 Carbohydrates as enzyme substrates
Carbohydrates are present in large amounts everywhere on Earth with
functions ranging from building blocks and energy reserves in our bodies to
mechanical reinforcement in trees. At the cellular level, carbohydrates are
involved in a large spectrum of intracellular and extracellular processes ranging
from energy storage to delicately controlled and specific molecular signaling
6
reactions. Sugar compounds display high stereochemical diversity, a
hexasaccharide can give rise to more than 10
12
different isomers, and living
organisms have efficiently taken advantage of this variation by producing
enzymes that can degrade virtually all different types of saccharides; simple or
complex, non-polymeric or polymeric, crystalline or non-crystalline. A vast
number of enzymes act to cleave, synthesize or modify glycosidic bonds in
carbohydrate compounds, and therefore, the need for a robust method for
classification of carbohydrate-active enzymes was realized early on. Before
discussing the classification of carbohydrate-active enzymes and their reaction
mechanisms in depth, a few definitions regarding carbohydrates will be provided
(Fig. 1.1).
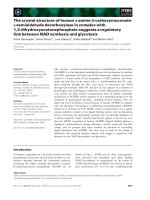
Figure 1.1. Chair representation of cellobiose. The disaccharide consists of two D-
glucose units linked covalently by a
β
-1,4 glycosidic bond. The unblocked hemiacetal group
is at the reducing end of the disaccharide.
Carbohydrates containing a six-member ring such as D-glucose are
referred to as pyranoses. In aqueous solution, D-glucose exists in equilibrium with
an open open-chain aldehyde, two pyranose forms, two furanose forms (five-
member rings) and the hydrated form of the open chain (the keto form). The two
pyranose rings differ such that one form has the C1 hydroxyl group in equatorial
O
HO
OH
OH
OH
H
H
H
H
HO
H
H
H
H
OH
OH
HO
H
H
glycosidic bond
1
2
3
4
5
6
acetal group
1
2
3
4
5
6
hemiacetal group
axial position
(α)
equatorial position (β)
reducing end
non-reducing end
7
position (i.e., β form with the hydroxyl group trans to the exocyclic C6-O6 group)
and the other in axial position (i.e.,
α
form with the hydroxyl group cis to the C6-
O6 group). Unless the anomeric C1 carbon is protected, inter-conversion
(tautomerisation) will occur between the
α
and
β
forms. The two forms are
referred to as the
α
and
β
anomers, or stereoisomers, of D-glucose. In the case of
D-glucose, the C1 carbon is also known as the anomeric carbon, or the hemiacetal
carbon, indicating that this is the position where the chain can open up to yield
the open form.
The covalent linking of two carbohydrates involves a dehydration-synthesis
during which a hydrogen atom is removed from one sugar unit and a hydroxyl
group is removed from the other with the formation of one water molecule. The
new bond is termed a glycosidic bond, and when a glycosidic bond is cleaved it
occurs by hydrolysis. When several sugar units are linked by glycosidic bonds,
different types of polymers are formed depending on the types of carbohydrate
building blocks used. In the polymeric form, the end of the polymeric chain that
has a free, unprotected anomeric carbon is referred to as the reducing end. The
name refers to the ability of the ring to open up at the anomeric carbon to give
the open aldehyde form. The aldehyde group readily reduces other molecules and
ions, whereby the aldehyde becomes oxidized to the carboxylic form. When the
reducing-end sugar of a chain is linked to the hydroxyl group of another sugar, it
is converted to an acetal that is unable to open to the aldehyde or keto form. The
sugar is then said to be non-reducing. Thus, an extended carbohydrate chain has
directionality where one end is referred to as the non-reducing end, and the other
as the reducing end.
1.2.2 Carbohydrate-active enzymes are classified in CAZy
The historical classification of enzymes provided by the International Union
of Biochemistry and Molecular Biology (IUBMB) Enzyme nomenclature
8
(www.chem.qmul.ac.uk/iubmb) classifies enzymes based on their substrate
specificity, and in some cases also on the reaction mechanism. This classification
does not take into consideration the three-dimensional (3-D) structure of the
enzymes, nor does it account for the fact that some enzymes use multiple
substrates, for instance, many endoglucanases that hydrolyze cellulose are also
able to cleave xylan, xyloglucan, β-glucan as well as some artificial substrates. In
the early 90’s, the need for a better classification system for carbohydrate-active
enzymes prompted Henrissat and co-workers to investigate the relation between
enzymes in more detail, and over the past decade, an impressive amount of data
has been collected and implemented into a rigorous classification system
(Henrissat, 1991; Henrissat & Bairoch, 1993; Davies & Henrissat, 1995; Henrissat
& Davies, 1997; Davies et al., 2005a) that is now available at the Carbohydrate-
Active Enzyme database (afmb.cnrs-mrs.fr/CAZY).
This method uses similarities in amino-acid sequence analyzed by
hydrophobic-cluster analysis, and provides useful information beyond substrate
specificity such as protein structure, evolutionary relationships, in addition to
functioning as a tool to derive and predict mechanistic information. The method
better reflects the structural and evolutionary features of the enzymes and, in
addition to sequence similarity, members of a given family will share a common
3-D structure and reaction mechanism. Carbohydrate-active enzymes are often
modular containing a catalytic domain (module) linked to one or more modules
with other functions such as carbohydrate binding. Currently, catalytic modules of
carbohydrate-active enzymes belonging to any of the four CAZy groups have been
defined as:
i)
Glycoside Hydrolases (GH) that hydrolyze glycosidic bonds in sugar
compounds;
ii)
Glycosyl Transferases (GT) that synthesize glycosidic bonds by
transferring activated donor molecules to specific acceptor sugars;
iii)
Polysaccharide Lyases (PL) that cleave polysaccharide chains by a β-elimination
reaction to give a double bond at the newly produced reducing substituted end;
9
and,
iv)
Carbohydrate Esterases (CE) that catalyze O- or N-glycosylation of
substituted saccharides by using the sugar either as an acid (pectin methyl
esterases), or as an alcohol.
In addition to the classification of catalytic modules, the non-catalytic
modules often associated with the catalytic domains of carbohydrate-active
enzymes constitute a separate group, the Carbohydrate-Binding Modules (CBM).
In this group, modules are found attached to catalytic modules, but are not
catalytic per se. Usually the CBMs function to bind to polymeric carbohydrate
substrates (e.g. cellulose, xylan, starch, chitin etc.), but for some CBMs,
carbohydrate binding has not been demonstrated, and thus, their functions
remain unclear. As of November 2006, there are 108 GH families, 87 GT families,
18 PL families, 14 CE families, and 48 CBM families. To date, 25760 amino-acid
sequences of GHs have been grouped into the 108 GH families, 2178 3-D
structures of GHs have been deposited with the Protein Data Bank
(www.rcsb.org), and of the 108 GH families, 42 still lack information about their
3-D structures.
1.2.3 Reaction mechanisms of glycoside hydrolases
Enzymatic hydrolysis of glycosidic bonds by GH enzymes involves general-
acid catalysis. As mentioned above, glycoside hydrolases are classified into as
many as 107 different GH families, however, the mechanism whereby the
glycosidic bond between sugar units is hydrolyzed can only be one of two possible
types (Koshland, 1953; Sinnott, 1990): an inverting (bimolecular S
N
2 nucleophilic
substitution), or a retaining (unimolecular S
N
1 nucleophilic substitution, or double-
displacement) mechanism (Fig 1.2). The two mechanisms differ by their
stereochemical outcome, but have some common features. In both mechanisms,
the proton donor is located within hydrogen-bonding distance of the glycosidic
10
oxygen of the susceptible bond, and the reaction proceeds via an oxocarbenium
ion-like transition state.
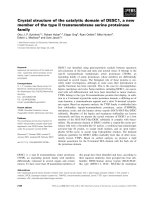
In the inverting mechanism (Fig. 1.2 a), a single displacement occurs at
the anomeric carbon. The reaction is catalyzed by two carboxylate residues: a
proton donor acting as a general acid, and a nucleophile acting as a general base.
The reaction starts by protonation of the glycosidic oxygen and release of the
leaving group concomitant with the nucleophilic attack by a water molecule, i.e.,
the existing bond is broken and the new bond is formed in one concerted
operation. The reaction requires the two catalytic amino-acid residues are on
opposite sides of the substrate, which results in net inversion of configuration at
the anomeric carbon.
Figure 1.2. Reaction mechanisms for glycoside hydrolases. The (a) inverting and (b)
retaining mechanism (picture adapted from CAZy). See text for details on the reaction
schemes.
11
The retaining reaction mechanism (Fig. 1.2 b) involves two steps with two
successive displacements at the anomeric carbon, the glycosylation step and the
deglycosylation step. In the first step, glycosylation, the substrate is bound to the
enzyme. The general acid donates a proton to the glycosidic oxygen, and the
leaving group departs before the protein nucleophile attacks at the anomeric
carbon to form a covalent intermediate. As a result of the single displacement,
the resulting glycosyl-enzyme intermediate has an inverted configuration at the
anomeric carbon relative to the original configuration. During the next step,
deglycosylation, the glycosyl-enzyme intermediate is hydrolyzed by a general-
base catalyzed attack by water on the asymmetric center. This displacement
causes another inversion of configuration at the anomeric carbon and the
configuration assumes that of the original state, thus the completed reaction gives
a net retention of configuration. In the active sites of retaining and inverting GH
enzymes, the two catalytic amino-acid residues are always positioned roughly 5.5
Å and 10 Å apart, respectively (Davies & Henrissat, 1995; McCarter & Withers,
1994). The rather long distance between the proton donor and nucleophile in
inverting enzymes is important in as it accommodates the catalytic water
molecule.
1.2.4 Modes of action in GH enzymes
The mode with which a glycoside hydrolase binds and attacks its sugar
substrate is typically reflected by the shape of the enzyme molecule, and the
distribution of amino acids at the molecular surface. Three principal active-site
topologies can be distinguished based on the requirements of the different modes
of action and the pre-hydrolytic requirements: a pocket, cleft, or tunnel (for a
review, see Davies & Henrissat, 1995; Fig. 1.3). The pocket (Fig. 1.3 a) is usually
employed for recognition of a monosaccharide present at the non-reducing end of
a chain. This mode is observed mainly in monosaccharidases (e.g.,
β
-