Improved modelling of the human cerebral vasculature
Bạn đang xem bản rút gọn của tài liệu. Xem và tải ngay bản đầy đủ của tài liệu tại đây (3.64 MB, 193 trang )
IMPROVED MODELLING OF
THE HUMAN CEREBRAL VASCULATURE
ZHENG WEILI
(M.Eng)
A THESIS SUBMITTED
FOR THE DEGREE OF DOCTOR OF PHILOSOPHY
DEPARTMENT OF MECHANICAL ENGINEERING
NATIONAL UNIVERSITY OF SINGAPORE
2007
Acknowledgement
Pursuing Ph.D is a harsh journey, the result of which reflects by no means only my
efforts and dedication. First of all, I would like to express my deepest gratitude and
respect to my supervisors Dr. Chau Fook Siong, Dr. Ang Marcelo H. Jr., and Dr.
Wieslaw L. Nowinski for their remarkable guidance, heuristic advice and
encouragement. They guided me meticulously through out my research program, and
were highly supportive during my initial period of inexperience. Their continuous
efforts of encouragement and support derived many benefits in my research work,
even in writing this successful dissertation. I would also like to thank Dr. Aamer
Aziz, Dr. Ihar Volkau and Dr. Hu Qingmao for their valuable suggestions and
creative discussions, which inspired me greatly.
Many thanks to the lab officer, Mr. Chiam Tow Jong, and Dr. Fu Yu in the
Department of Mechanical Engineering, NUS for their selfless help and cooperation.
I would also extend my heartfelt thanks to Ms. Aminah B. B. Abu Bakar, Mr. A.
Anand, Mr. Ma Xin, Dr. Liu Jimin, Dr. Qiao Yu and many others in the Biomedical
Imaging Lab for solving many technical and administrative problems in the course
of this dissertation. Also I would like to thank all my friends who have given support
and enthusiasm during the years of my Ph.D. Their friendship greatly stimulated me
to carry on through difficult periods.
I
I would like to thank Biomedical Imaging Lab for sharing the physical vascular
phantom data and volunteer data. I would also extend my sincere thanks to the
Diagnostic and Interventional Neuroradiology department, University of Saarland,
Homburg, Germany, for providing the 17 sets of patient data sets in this dissertation.
I am particularly indebted to my parents and parents-in-law for providing constant
support and encouragement during my graduate study. Very special thanks to my
husband, Huabing, for always helping me to put things into the right perspective.
Special thanks also to my little daughter, Tianhui, for bringing a bundle of joy into
my life. Because of her, life becomes so meaningful and wonderful.
It is impossible to conclude without thanking the Almighty God for all the blessings
I received during my Ph.D. studies. Forever, He is the Source of peace and strength.
II
Table of Contents
Acknowledgement………………………………………………………………I
Table of contents……………………………………………………………………III
Summary……………………………………………………………………VII
List of tables………………………………………………………………… X
List of figures………………………………………………………………… XI
List of symbols…….…………………………………………………………… XVI
1. Introduction……………………………………………………………………1
1.1 Human cerebral vasculature……………………………………………3
1.2 Magnetic resonance angiography……………………………………… 4
1.3 Vascular image processing techniques…………………………………5
1.4 Representations of the vasculature……………………………………….6
1.5 Problems statement and contributions……………………………………9
1.5.1 A hybrid strategy………………………………………………….11
1.5.2 Locally adaptive thresholding…………………….…………… 12
1.5.3 Centerline extraction…………………………………………….…13
1.5.4 Elliptical measurement based on affine scale space…………… 14
1.6 Scope of dissertation……………………………………………………….14
2. Vascular modelling……………… …………………………………………….16
2.1 Overview……………………………… ………………………… 16
III
2.2 Deformable models………………… ………………………………18
2.3 Skeletonization strategy…………………… ….……………………20
2.3.1 Angiographic image enhancement…………………………….20
2.3.2 Vessel segmentation………………………………………… 22
2.3.3 Skeletonization……………………………………………….29
2.4 Scale space strategy……………………………………………………33
2.4.1 Scale space theory………………… ……….……… …… 33
2.4.2 Medialness……………………………………………………35
2.4.3 Scale space centerline extraction………………………………37
2.5 Tracking strategy……………………………………………………….39
2.6 Geometric modelling ………………………………………………….40
2.7 Our solution………………………………………………………………41
3. Locally adaptive thresholding ………………………………………………….43
3.1 Background………………………………………………………… 43
3.2 Experimental Data……………….……………………………………44
3.3 Segmentation with locally adaptive thresholding…………………… 46
3.3.1 Step 1-Automatice selection of regions of interest (ROIs)….…46
3.3.2 Step 2-Local enhancement and adaptive thresholding……… 50
3.3.3 Evaluation…………………………………………………… 55
3.4 Results…………………………………………………………….….56
3.4.1 Experiments on a slice………………………………… ……57
3.4.2 Experiments on MRA data sets……………………………… 59
IV
3.4.3 Sensitivity to the width and maximum intensity of a cross
section……………………………………… ……………….73
3.5 Discussion……………………………………………………………….74
3.6 Conclusion………………………………………………………….…… 79
4. Centerline model extraction by means of the wave propagation of the marching
spheres………………………………………………………………….………80
4.1 Background………………………………………………………… 80
4.2 Centerline extraction procedure………………………………………83
4.2.1 Initialization………………………………………………….83
4.2.2 Marching procedure …………………………………………87
4.2.3 Procedure of building a tree structure …………………….….…95
4.2.4 Evaluation…………………………………………………… …96
4.3 Results…………………………………………………………………….98
4.3.1 Experiments on the simulated data……………… …………… 98
4.3.2 Studies on the 3D binary cerebral vasculature data sets…… 104
4.4 Discussion…………………………… …………………………………111
4.5 Conclusion…………………………….…………………………………115
5. Building an elliptical centerline model of the cerebral vasculature using
model-based affine Gaussian scale space approach………… 117
5.1 Background………………………………………………………….117
5.2 Building an elliptical model of the cerebral vasculature…………….119
5.2.1 Affine medialness function………………………………….119
V
5.2.2 Shape adaptation…………………………………………………122
5.2.3 Measurement of elliptical cross sections in 3D vasculature…126
5.2.4 Geometric modelling based on the elliptical centerline model.128
5.3 Results and discussion……………………………………………….129
5.3.1 Experiments on the 2D synthetic images……………………129
5.3.2 Applications on 3D MRA data……………………………… 138
5.4 Conclusion…………………………………………………………… 143
6. Conclusion and future work….……………………………………….… 144
6.1 Conclusion………………………………………………………… 144
6.2 Future work……………………………………………………….… 146
Bibliography…………………………………………………………………….148
Appendix ….……………………………………….…………………………… 171
A. Evaluation of the segmentation result……………… …… …… 171
B. Reconstructed 3D cerebral vascular models……………… ………… 172
C. Measured elliptical vessel cross section. ……… …………………….… 173
VI
Summary
Angiography is a medical imaging technique to visualize blood vessels. Many
medical applications need efficient visualization of the vascular angiographic data
with topological information to make diagnosis and quantitative analysis of the
vasculature. The transition from the volumetric raw data to a representation with
topological information which can afford efficient visualization is not trivial. It is
especially difficult for cerebral vasculatures which are complicated, tortuous and
contain a large number of small vessels. Vascular models generated from the
centerline and radius information can provide the tree structure and smooth
visualization which suits for these applications. There are generally three strategies
to obtain a centerline model: skeletonization strategy, scale space strategy and
tracking strategy. From the analysis, none of the strategy is a clear winner under all
conditions; rather, each is potentially useful for some set of applications and
implementation constraints.
This dissertation describes a hybrid strategy which integrated with both
skeletonization and scale space strategies. The hybrid strategy by combining the
advantages of the above two strategies includes 3 steps. Firstly, the binary data is
segmented from three dimensional (3D) time of flight (TOF) magnetic resonance
angiography (MRA) data. Then a centerline extraction procedure is applied to
VII
generate a circular centerline model. A tree structure and 3D data set with vessel
voxels labeled with its branch number is also produced. Finally, an elliptical
measurement procedure based on affine scale space approach is performed in the
original angiographic data for each cross section of the previous circular centerline
model. An elliptical centerline model is generated after this procedure. The
automation and robustness of this strategy is realized by taking the circular
centerline model generated in the second step as initial information for the third step.
The accuracy of the final elliptical model is achieved with affine scale space
measurement – measuring the size according to its shape. Therefore, it offers more
robustness on going over bifurcations than pure scale space strategy and more
accurate measurement than pure skeletonization strategy. To demonstrate the
advantages of the hybrid strategy, it is also important to show how the image
processing techniques can be implemented in each step.
The main issues of segmentation, centerline extraction and scale space measurement
are explored thoroughly in this dissertation. A novel locally adaptive thresholding
segmentation method is proposed in the first step which offers the superiority in
accuracy and extraction of finer distal vessels. In the second step, the proposed
method by means of wave propagation of the marching spheres can extract the
1-voxel width branches and provide robust bifurcation detection. In the third step,
the medialness based on affine Gaussian scale space is extended from the medialness
based on linear Gaussian scale space to measure the vessel size. Local shape is
VIII
efficiently detected by iteratively computing it from the second derivative at the
center of the vessel cross section.
Our research shows that hybrid strategy is viable and competitive. Its strengths make
it a better choice to facilitate automation, provide robust bifurcation detection and
generate an elliptical centerline model as a more general and accurate description of
vessels. While this dissertation clears the way for the hybrid strategy implementation
in each step, there are still many opportunities for further exploration in this area.
IX
List of Tables
Table 3-1 Comparison of the vessel voxels segmented from the volunteer data in
Figure 3-9 by methods M1-3 with manually segmented data (M0) by an
anatomical expert……………………………………………………65
Table 3-2 Comparison among the vessel voxels segmented from 17 patients’ TOF
MRA data by methods M1-3…………………………………………71
Table 3-3 Comparison of the segmented voxels from 4 stroke patients’ TOF MRA
data by methods M1-3……………………………………………….72
Table 4-1 Mean square error of the bifurcation, 95% trust region of the detected
center points and their radii………………………………………….107
Table 5-1 Mean and standard deviation of the results for 20 tests of a image under
Gaussian noise σn =0.1…………………………………………… 135
Table A-1 True positive rate and false positive rate of the segmented data
evaluated based on the ground truth edited by an anatomist…… …171
Table A-2 True positive rate and false positive rate of the segmented branchings
evaluated based on the ground truth anatomy edited by an anatom…171
X
List of Figures
Figure 1-1 Procedures to generate a visualization of vasculature………………….2
Figure 1-2 Anatomy of human cerebral vaculature……………………………… 3
Figure 2-1 Profile of a medialness kernel…………… …………………………37
Figure 3-1 Histogram of intensities in a slice fitted as a mixture function of two
Gaussian distributions and a uniform distribution with EM
algorithm 47
Figure 3-2 Procedure of step two adaptive thresholding…………………………50
Figure 3-3 Nonlinear image enhancement using γ function………………………52
Figure 3-4 Optimal threshold is determined when the change of threshold is less
than some finite small value…………………………………………54
Figure 3-5 Local adaptive threshold change with γ………………………………57
Figure 3-6 Experiment on a slice from the 3D TOF MRA data of a volunteer…58
Figure 3-7 Characteristic of 3D TOF MRA data of a healthy volunteer………….60
Figure 3-8 MIPs from a sagittal view of the complete vasculature of the healthy
volunteer………………………………………………………………61
Figure 3-9 MIPs of the volunteer’s vasculature after manually removing part of the
venous system and vessels in the skull……………………………… 62
Figure 3-10 Difference of the left internal carotid artery (ICA) siphon and some
distal vessels of the anterior cerebral arteries (ACAs) in the 3D surface
models of W-N’s segmented data and ours from Figure 3-9 extracted
and visualized in IVME……………………………………………….63
Figure 3-11 Difference of the anterior cerebral arteries (ACAs) (1,2,3) in the 3D
surface models of W-N’s segmented data and ours from Figure
3-9……………………………………………………………………64
Figure 3-12 Difference of the middle cerebral arteries (MCA) (1,2,3) in the 3D
XI
surface models of W-N’s segmented data and ours from Figure
3-9…………………………………………………………………… 64
Figure 3-13 Characteristics of a patient 3D TOF MRA data (Data ID: 1T_2)……66
Figure 3-14 MIPs from an axial view of cerebral arteries in original MRA and
segmented data of a patient data scanned under 1T magnetic field,
TE=9.6ms, TR=37ms……………………………………………….67
Figure 3-15 MIPs of the original MRA of a patient scanned under 1.5T magnetic
field, TE=3.24ms, TR=21ms…………………………………………67
Figure 3-16 3D model of segmented results in Figure 3-15 visualized in 3DVeiw.
From left to right are results from methods M1-3……………………68
Figure 3-17 The course of the aneurysm in the data set 1.5T_01 ……………….68
Figure 3-18 (1a,2a,3a,4a) MIPs of original four stroke patient 3D TOF MRA data
sets and (1b,2b,3b,4b) MIPs of the extracted arteries by our
method……………………………………………………………….72
Figure 3-19 Consistency of our segmented cross sections with the ground truth
versus the cross section width and maximum intensity of the cross
section…………………………………………………………………73
Figure 4-1 Dilation of the first inscribed sphere and definition of the front
wave…………………………………………………………………85
Figure 4-2 Marching sphere with “sensors” on its surface at the local structu…89
Figure 4-3 A bifurcation is detected when the front wave is dissected into 2 parts.
It is confirmed after Δ1(=2) more steps propagation of the
sub-waves……………………………………………………………92
Figure 4-4 During confirmation the bays which are noise and will cause wrong
bifurcation are filtered out……………………………………………92
Figure 4-5 Adjustment of branch labeling at the bifurcation……………………93
Figure 4-6 Detection and closing of a hole………………………………………94
Figure 4-7 Procedure of building a tree structure………………………….…… 96
Figure 4-8 3D spiral digital phantom with varying curvature, tortuosity and
XII
radius……………………………………………………………… 99
Figure 4-9 Comparison of the detected radius and the designed radius of the spiral
digital phantom……………………………………………………… 99
Figure 4-10 (1)-(7) 3D digital phantoms with radius of 3 voxels and branching
angles varying from to 324° to 28°, branching angle is defined as in (5);
(8) digital phantom with radius varying from 0.5-3 voxels…………100
Figure 4-11 Comparison of the detected radius and the designed radius of the
straight branch in the digital phantom “8” in Figure 4-10………… 101
Figure 4-12 Labeling of the branches of digital phantom “5” in Figure 4-10; (a)
branches labeled by our method, (b) branches labeled by Zahlten’s
method……………………………………………………………….101
Figure 4-13 A simulated tree structure in a 2D image and its centerline…………103
Figure 4-14 Probability of topology change of tree structure in Figure 4-13 under
different noise levels……………………………………………….103
Figure 4-15 Average number of noisy branches added in the tree structure in Figure
4-13 under different noise levels……………………………….……103
Figure 4-16 Physical vascular phantom under study and its 3D displays………104
Figure 4-17 Inscribed sphere of a vessel has smaller radius than its dimension in
MIP of binary image……………………………………………… 105
Figure 4-18 Middle cerebral arteries (MCAs) (1) and Posterior cerebral arteries
(PCAs) (2)…………………………………………………………108
Figure 4-19 Anterior cerebral arteries (ACAs) (1) and the Circle of Willis (2) in the
3D displays………………………………………………………… 108
Figure 4-20 Internal carotid arteries (ICA) (1) and the vertebral arteries (2)….…109
Figure 4-21 3D displays of the cerebral vasculature of a patient (Data ID:
GD_1T_05) scanned under 1T Siemens scanner……………… ….110
Figure 4-22 3D displays of the cerebral vasculature of a patient (Data ID:
GD_1.5T_03) scanned under 1.5T Siemens scanner……………… 111
Figure 5-1 2D elliptical medialness kernel (a=8, b=4, ρ=1/4) from different
XIII
views…………………………………………………………………121
Figure 5-2 The cross section profile of the medialness kernel K with
ρ=1,1/2,1/3,1/4, along major axis………………………………….121
Figure 5-3 There kinds of intensity profiles of the cross sections under test without
noise……………………………………………………………….…130
Figure 5-4 Detection error of size and aspect ratio for the 2D elliptical cross
section with Gaussian profile………………………………………131
Figure 5-5 Detection error of size and aspect ratio for the 2D elliptical cross
section with Bar-convolved profile…………………………………132
Figure 5-6 Detection error of size and aspect ratio for the 2D elliptical cross
section with Bar-like profile…………………………………………132
Figure 5-7 Error of the aspect ratio ((σx/σy)-(a/b)) /(a/b) with respect to the
original image when detecting point deviating from the center point
(x,y)=(x0,y0)+(Δx+Δy)…………………………………………….133
Figure 5-8 The rotation angle (°) of the detected ellipse with respect to the original
elliptical image when the detecting point deviating from the center of
image (x,y)=(x0,y0)+(Δx+Δy)…………………………………….…134
Figure 5-9 Aspect ratio of elliptical cross section detected at different initial scales
with linear and affine Gaussian derivative…………………………136
Figure 5-10 Size measured using medialness based on linear and affine
Gaussian………………………………………………………… …137
Figure 5-11 An example of elliptical measurement and circular measurement… 137
Figure 5-12 Aspect ratio distribution of the vessel cross sections in a patient data
(Data ID: 1T_2)………………………………………………… …138
Figure 5-13 Vessel radii distribution in the circular model of a patient data (Data ID:
1T_2)………………………………………………………………141
Figure 5-14 Minor axis size distribution in the elliptical model of a patient data
(Data ID: 1T_2)…………………………………………………….141
Figure 5-15 Radius and minor axis size difference distribution in patient data (Data
ID: 1T_2)……………………………………………………………142
XIV
Figure 5-16 Center point difference distribution between the circular and elliptical
models of a patient data (Data ID: 1T_2)………………………… 142
Figure B-1 3D cerebral vascular models reconstructed from 1T (raw 1 and 2)
and1.5T (raw 3 and 4) MRA data……………………………………172
Figure C-1 The circular cross section (green) after centerline extraction procedure
and the elliptical cross section (red) after elliptical measurement…173
XV
List of Symbols
)(
0
xL Input image of multiscale representation
n
ℜ N-dimensional Image space
Scale space representation of the image
L
Gaussian function G
0
σ
Inner scale of image
1
σ
Outer scale of image
0
Σ Local shape descriptor
μ
Gaussian blurred second moment matrix
Medialness function
M
Medialness kernel
K
ρ
Ratio of the object scale to the distance from center to the boundary
P
Intensity distribution of TOF MRA
k
ω
Weights for the uniform and two Gaussian distributions respectively in
the intensity distribution function
P
k
μ
Mean of the Gaussian of brain tissue
k
σ
Standard deviation of the Gaussian of brain tissue
0
χ
Global threshold of a slice
s
R
Region representing vessels
XVI
*
s
R
Region of interest dilated from
s
R
γ Gamma adjustment function
s
I
Intensity value of region s in the image
s
low
I
Minimum intensity value of region s
max
s
I
Maximum intensity value of region s
s
low
I
Lower threshold of gamma adjustment function
*s
I
Intensity value of region s in the image after enhancement
mean
I
Mean intensity value of region s
α* Smallest adaptive thresholds
0
S
Seed of the centerline extraction procedure
0
G
, Initial marching direction and that of step k
k
G
0
P
, Initial detection plane and that of step k
k
P
0
,
k
CC
Center of the initial inscribed sphere and that of step k
0
,
k
RR
Radius of the initial inscribed sphere and that of step k
0
,
k
WW
Voxels inside the sphere dilated from the initial inscribed sphere and
that of step k
1
Δ
Increment of the radius from the inscribed sphere
0
,
k
TT
Initial front wave and that of step k
0
,
k
M
M
Center of the initial front wave
**
k
, R
k
C
Initial center and radius at step k
)(xC
Testing point at inscribed sphere detection
N Number of “sensors” on the sphere surface
XVII
2
Δ
Threshold for bifurcation confirmation
3
Δ
Threshold for loop confirmation
H Second derivative of local image
1
H
−
Inverse of the second derivative
P Combination of eigenvectors in 2D
2,1
λ
Eigenvalues of
1−
H
t
Σ
Local diffusion matrix
22
,
x
y
σ
σ
Scales in the diffusion matrix
(, )
f
xy
Image with Elliptical Gaussian profile
),( yxI
Affine Gaussian representation of
(, )
f
xy
Ω
Combination of eigenvectors in 3D
*
i
u
, Major and minor axis direction of ellipse in 2D detection plane
*
i
v
e
i
u
, Major and minor axis direction of ellipse in 3D
e
i
v
CTA Computed tomography angiography
MRA Magnetic resonance angiography
2D Two-dimensional
3D Three-dimensional
RA Rotational Angiography
MRI Magnetic resonance imaging
TOF Time-of-flight
PC Phase-Contrast
CE Contrast-Enhanced
XVIII
MIP Maximum intensity projection
ROI Region of interest
FWHM Full-Width Half-Maximum
W-N Wilson and Noble’s
IR Interventional radiology
EM Expectation-maximization
CSF Cerebrospinal fluid
GW Gray matter
WM White matter
MAT Medial Axis Transform
MMA Multiscale medial axis
IVME Interactive vascular modelling environment
MSP Midsagittal Plane
ICA Internal carotid artery
ACA Anterior cerebral arteries
MCA Middle cerebral artery
PCoA Posterior communicating arteries
XIX
Chapter 1
Introduction
Angiography is a medical imaging technique to visualize blood vessels [1].
Angiographic imaging techniques such as computed tomography angiography (CTA)
[1], magnetic resonance angiography (MRA) [2], and three-dimensional (3D)
Rotational Angiography (RA) [3] provide the physicians with volumetric data of
unprecedented resolution and signal to noise ratio. However, apprehension of
vasculature from individual slices that constitute the large volumetric data is a
tedious task. Efficient visualization of the vascular angiographic data has proven
clinically useful in several fields [
1]. Some of the fields are such as 1) diagnosis of
cerebral vascular diseases [
4] ; 2) monitoring the disease progress [5]; 3) quantitative
analysis of vascular structures [6]; 4) understanding anatomical structures with
respect to the vasculature [7]; 5) interventional procedures planning and the minimal
invasive surgery planning and treatment [8-12].
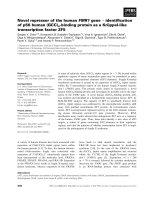
The general procedure [
1] to generate a visualization of vasculature is illustrated in
1
Figure 1-1. Firstly, the vascular angiographic data is acquired under some imaging
protocols. Then vascular image processing techniques are applied to obtain a proper
representation of vasculature. Finally, it is visualized in some visualization
environment. The transition from the volumetric raw data to a representation which
can afford efficient visualization is not trivial [13]. It is especially difficult for
cerebral vasculatures which are complicated, tortuous and contain a large number of
small vessels. This dissertation focuses on developing some angiographic image
processing techniques (the shaded block in Figure 1-1) to generate a representation of
cerebral vasculature for efficient visualization in medical applications.
Figure 1-1 Procedures to generate a visualization of vasculature
2
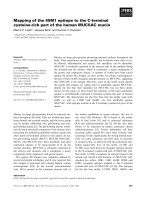
1.1 Human Cerebral Vasculature
The brain receives blood from two pairs of large vessels [14]: the internal carotid
arteries, which arise from arteries in the neck, and the vertebral arteries, which arise
from arteries in the chest. Two carotids cerebral circulations consist of connected
sets of vessels that supply the front and top of the head. The vertebral arterial
circulation supplies the rest of the brain such as brainstem, cerebellum, the occipital,
lobe of the cerebrum, and parts of the thalamus. At the base of the brain, the carotid
and vertebral arteries form a circle referred to as the circle of Willis through three
communicating arteries. It is an important anatomy of the cerebral vasculature. If
one of the main arteries (carotids or vertebral) is occluded, the brain can still
function normally, since the distal smaller arteries, supplied by the occluded arteries
can still receive blood from the other two circulations.
Figure 1-2 Anatomy of human cerebral vaculature
3
1.2 Magnetic Resonance Angiography
Main imaging modalities, which perform volumetric angiography, include: CTA,
MRA and 3D RA. CTA uses x-rays to visualize blood flow in arterial and venous
vessels throughout the body. MRA is a magnetic resonance imaging (MRI) study of
the blood vessels without x-rays [2]. 3D RA is a new imaging function which
provides volume rendered three-dimensional images from rotational angiography
runs. 3D RA presents itself as a promising technique due to high-resolution
volumetric data and is not intrinsically sensitive to motion and particularly to blood
velocity. Compared to CTA and 3D RA which use x-rays, MRA is totally
non-radiation and non-invasive [1]. MRA provides detailed images of blood vessel
without using any contrast material, although today a special form of contrast is
usually given to enhance the clarity of MRA images. This procedure is painless, and
the magnetic field is not known to cause any tissue damage [2].
MRA utilizes MRI technology to detect, diagnose and aid the treatment of vascular
disease. MRI is based on the magnetic resonance phenomena and uses a magnet
and radio signals to generate multi-modal images [1]. Conventional MRI studies
exploit the concentration of water protons (i.e., proton density PD) and two
relaxation times, T1 (spin-lattice relaxation rate) and T2 (spin-spin relaxation rate)
[
1]. Three types of MRA techniques are usually used to examine vessels:
Time-of-flight (TOF) MRA, Phase-Contrast (PC) MRA, and Contrast-Enhanced (CE)
MRA [
15]. The data sets used in this dissertation are TOF MRA data. TOF utilizes
4
the in-flow effect. In MR techniques, the signal from spins is weaker if it is exposed
to more number of excitation pulses, and vice versa. In time-of-flight imaging, the
flowing spins (blood flow) are subjected to fewer number of excitation pluses
compared to the surrounding static tissues. The blood flow thus has a stronger signal
hence, is brighter than the surrounding tissues. It is necessary to note that TOF
technique provides blood flow information instead of true vessel lumen images.
Thus, TOF images indicate the flow patterns rather than the vessel shape. TOF
methods can be implemented using two-dimensional (2D) or three dimensional (3D)
acquisitions within a single slab or multiple slabs [15].
1.3 Vascular Image Processing Techniques
Medical image processing techniques involved in generating a representation of
vasculature from angiographic image for efficient visualization include angiographic
image enhancement, segmentation of vasculature and skeletonization [1].
The aim of vascular image enhancement is to suppress noise, while enhancing the
vessels [
1]. Then, the enhanced images are processed by the segmentation procedure.
Segmentation is an essential step to distinguish the vessels from the background [
13].
After segmentation, the vessels are usually represented with connected voxels in a
binary data set or vessel surfaces. Skeletonization procedure generates a skeleton (or
centerline) of vasculature from the binary data as concise representation of the
vasculature [
16]. The skeleton of a 3D object could be defined as the locus of centers
5