Studies of vortex breakdown and its stability in a confined cylindrical container 7
Bạn đang xem bản rút gọn của tài liệu. Xem và tải ngay bản đầy đủ của tài liệu tại đây (612.46 KB, 16 trang )
CHAPTER 7 HARMONICALLY FORCING ON A STEADY SWIRLING FLOW
* Part of this chapter has been submitted to Physics of Fluids.
136
CHAPTER 7
*
HARMONICALLY FORCING ON A STEADY ENCLOSED
SWIRLING FLOW
7.1 Introduction
In Chapter 6, the response of an axisymmetric time-periodic swirling flow in a
confined cylinder to harmonically modulated rotation of the endwall has been
investigated. Two things emerged from that study. One was quite expected, that for
very low amplitude forcing, the response is well described by resonant behavior.
However, the second finding was not directly obvious, and it seems to be unrelated to
resonances of the type described by the Arnold circle map model (Arnold 1965). To
help clarify the spatio-temporal responses at the slightly smaller forcing amplitudes,
we explore in this paper the response to the same type of harmonic forcing, but at
mean Re below the critical value for the Hopf bifurcation, so that we are harmonically
forcing a stable axisymmetric steady state.
On the other hand, there has been much interest in the swirling flow in an enclosed
cylinder driven by the rotation of an endwall for applications where a high degree of
mixing is desired, such as in micro-bioreactors, albeit at a low level of shear stress (see
Yu et al. 2005a, 2005b, 2007; Dusting et al. 2006; Thouas et al. 2007). The interest
stems from the very good mixing properties when the flow is operated above the
threshold for self-sustained oscillations as these provide chaotic mixing (Lopez and
Perry 1992). The concern is, of course, that the chaotic mixing is only present when
the Reynolds number is above a critical level for the Hopf bifurcation, and so one
CHAPTER 7 HARMONICALLY FORCING ON A STEADY SWIRLING FLOW
137
would like to achieve comparable oscillations at lower Reynolds numbers, thereby
subjecting the biological material to lower damaging stress levels. This motivated us to
explore the flow behavior of the steady state vortex flow under harmonic modulation.
The study includes experimental investigation and numerical simulations of the
axisymmetric Navier-Stokes equations.
7.2 Experimental Method
The experimental apparatus and technique used in this chapter are the same as
those presented in Chapter 2. In the present investigation, the Reynolds number was set
at 2600 and below with the modulation amplitude A varying from 0.005 to 0.04, and
the aspect ratio Λ was maintained at a constant value of 2.5 throughout. Note that all
flow visualization photos were inverted for ease of comparison with numerical results.
7.3 Numerical Method
In this study, the governing equations are the axisymmetric Navier-Stokes
equations, and they are solved using the streamfunction / vorticity / circulation form
with a predictor-corrector finite difference method as introduced in Chapter 3. The
computations presented in this chapter were performed by the author.
7.4 Results and Discussions
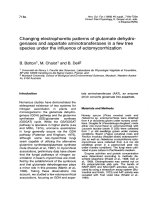
First, the steady vortex breakdown state at Re = 2600 and Λ = 2.5 is described,
which is the basic state to be investigated under forcing. This state is about 4% below
the onset of self-sustained oscillations, which set in at Re = 2710 for Λ = 2.5 via a
CHAPTER 7 HARMONICALLY FORCING ON A STEADY SWIRLING FLOW
138
supercritical Hopf bifurcation with Hopf frequency ω
0
≈ 0.17. Dye flow visualization
together with computed streamfunction ψ, and azimuthal vorticity η of this basic state
are shown in Fig. 7.1. The flow manifests a large steady axisymmetric vortex
breakdown recirculation zone on the axis. For harmonically forcing, a wide range of
forcing frequencies was considered, with the forcing amplitude kept small, typically A
≤ 0.02. Having examined experimentally dozens of frequencies in the range ω
f
∈[0.04,
0.5] for various amplitudes A, it is found that in all cases the power spectral densities
(PSD) from the time-series of the hot-film outputs only have power (above the
background noise level) at the forcing frequencies and its harmonics.
(a) (b) (c)
Fig. 7.1 The steady axisymmetric basic state at Re = 2600 and Λ = 2.5. (a) flow
visualization using food dye (only the axial region is shown), (b) computed streamlines
ψ, and (c) computed azimuthal component of vorticity η. There are 10 positive (red)
and negative (blue) contours quadradically spaced, i.e. contour levels are [min/max] x
(i/10)
2
, and ψ ∈[-0.00702, 8.305 x 10
-5
], η ∈[−4.12, 21.68].
The effects of the modulation amplitude with a forcing frequency not in resonance
with the natural frequency ω
0
was first examined (in this case, ω
f
= 0.20, so ω
f
/ω
0
≈
CHAPTER 7 HARMONICALLY FORCING ON A STEADY SWIRLING FLOW
139
1.17). Figure 7.2 presents PSD from hot-film outputs at forcing amplitudes A = 0.005,
0.01 and 0.02. These illustrate that the resultant flow is synchronous with the imposed
modulation frequency, even at very low forcing amplitudes. This is in contrast to the
situation where a limit cycle flow is harmonically forced as presented in Chapter 6.
There, the resultant flow is quasi-periodic for low forcing amplitudes, and the quasi-
periodic flow collapses to a periodic flow synchronous with the forcing frequency as
the forcing amplitude is increased above a critical level.
Fig. 7.2 Power spectral density from time-series of hot-film output for flows with Λ =
2.5, Re = 2600, ω
f
= 0.2 and forcing amplitudes A as indicated.
CHAPTER 7 HARMONICALLY FORCING ON A STEADY SWIRLING FLOW
140
Figure 7.3 presents PSD from the hot-film outputs at various forcing frequencies
with fixed A = 0.02. In all the experimental runs, it was checked that the hot-film
outputs from the two channels are in phase (peaks matching in time), providing
experimental evidence of the axisymmetric nature of the forced limit cycles. Again, the
response in all cases is a flow synchronous with the forcing, but with more power
when ω
f
≈ ω
0
.
Fig. 7.3 Power spectral density from time series of hot-film output for flows with Λ =
2.5, Re = 2600, A = 0.02 and forcing frequency ω
f
as indicated.
The flow visualizations shown in Fig. 7.4 at Λ = 2.5, Re = 2600, A = 0.01, and ω
f
=
0.171, 0.20, and 0.50 illustrate the enhanced oscillations when ω
f
= 0.171 ≈ ω
0
. In fact,
at ω
f
= 0.171, the forced synchronous flow is very similar to the natural limit cycle
flow for Re > Rec ≈ 2710, exhibiting axial pulsations. For ω
f
= 0.20 the flow does not
exhibit as strong oscillations, but there are still observable movements of the dye sheet,
whereas for ω
f
= 0.50 the dye sheet is quite steady and very much like that in the A = 0
basic state shown in Fig. 7.1.
CHAPTER 7 HARMONICALLY FORCING ON A STEADY SWIRLING FLOW
141
(a) ω
f
= 0.171
t = 0 4.49 8.97 13.46 17.95 22.44 26.92 31.41 35.90
(b) ω
f
= 0.20
t = 0 4.49 8.97 13.46 17.95 22.44 26.92 31.41 35.90
(c) ω
f
= 0.50
t = 0 4.49 8.97 13.46 17.95 22.44 26.92 31.41 35.90
Fig. 7.4 Dye flow visualization of the central vortex breakdown region at Re = 2600, Λ
= 2.5, A = 0.01 and ω
f
as indicated.
In order to obtain a more quantitative measure of the amplitude of the forced
synchronous oscillations in the experiment, Figure 7.5 presents the peak-to-peak
CHAPTER 7 HARMONICALLY FORCING ON A STEADY SWIRLING FLOW
142
amplitude of the hot-film output at Re = 2600, Λ = 2.5 over a wide range of ω
f
for
forcing amplitudes A = 0.01 and A = 0.02, along with that at Re = 2000 and A = 0.01.
What is most striking is that the hot-film output amplitude spikes for ω
f
≈ ω
0
. There
are also a number of other smaller spikes, the main ones at ω
f
≈ 0.12 and ω
f
≈ 0.22.
These appear to be related to the 2:3 and 4:3 resonances with ω
0
, but if these other
spikes were simply other resonances with ω
0
, one would expect the 1:2, 1:3, 2:1
resonances to be at least comparable, but they are not evident.
Fig. 7.5 Peak-to-peak amplitudes of hot-film output with varying forcing frequency ω
f
at Λ = 2.5, Re = 2600, and A = 0.01 and 0.02. The three dotted vertical lines indicate
the Hopf frequencies of the three most dangerous modes of the basic state at Re =
2600, as determined by Lopez et al. 2001, where ω
H1
= 0.1692, ω
H2
= 0.1135 and ω
H3
= 0.2181.
Hence, it is conjectured that these other spikes in Fig. 7.5 are 1:1 resonances with
secondary Hopf modes. The frequencies associated with these secondary Hopf modes
were first detected experimentally by Stevens et al. (1999), computed nonlinearly by
Blackburn and Lopez (2002), but most significantly, positively correlated with
secondary axisymmetric Hopf bifurcations from the basic state via linear stability
CHAPTER 7 HARMONICALLY FORCING ON A STEADY SWIRLING FLOW
143
analysis by Lopez et al. (2001). The three vertical dotted lines in Fig. 7.5 correspond to
ω
f
= ω
0
= 0.1692, ω
f
= ω
1
= 0.1135, and ω
f
= ω
2
= 0.2182, where ω
0,
ω
1,
ω
2
are the Hopf
frequencies of the first three Hopf modes bifurcating from the basic state. The values
quoted are their values determined by linear stability analysis (Lopez et al. 2001) at Re
= 2600. The first Hopf bifurcation is at Re = 2710, and the second and third occur at
Re = 3044 and 3122. Of course, the Hopf frequencies vary with parameters (Re and Λ,
as well as A and ω
f
), but these variations are quite small. The good correspondence
between these Hopf frequencies and the spikes in the hot-film response to ω
f
lends
strong experimental evidence to the spikes being 1:1 resonances with the most
dangerous axisymmetric Hopf modes.
In the experiment, there are only quantitative measurements of the oscillation
amplitudes at the location of the hot-film probes, which could give a skewed picture of
the response. To get a global measure, we turn to the numerical simulations, where we
are able to measure the total kinetic energy (E
k
) of the flow in the entire cylinder. As a
measure of the oscillation amplitude, we use the peak-to-peak amplitude of the kinetic
energy, ΔE, normalized by the kinetic energy of the steady flow without modulation at
the mean Re, E
0
, and scaled with ω
f
0.5
. Figure 7.6 shows how ω
f
0.5
ΔE/E
0
varies with ω
f
for various mean Re, all with A = 0.01. The response for Re = 2600 shows the same
spikes response as that observed in the hot-film data, with minor spikes at the same
frequencies. At Re = 2000, smaller spikes are evident at the same frequencies, and the
reduction in the spikes is comparable to that observed in the experiments (see Fig. 7.5).
This all lends confidence that the local hot-film measurements are representative of the
global dynamics.
CHAPTER 7 HARMONICALLY FORCING ON A STEADY SWIRLING FLOW
144
0.0 0.1 0.2 0.3 0.4 0.5
0.000
0.004
0.008
0.012
Re = 2600 Re = 2000 Re = 800
ω
f
ω
f
0.5
ΔE/E
0
Fig. 7.6 Computed variation with ω
f
of the peak-to-peak amplitude of the kinetic
energy relative to the kinetic energy of the basic state, ΔE/E
0
, and scaled by ω
f
0.5
, of
the synchronous state for A = 0.01, Λ = 2.5 and various Re as indicated. The three
dotted vertical lines indicate the Hopf frequencies of the three most dangerous modes
of the basic state at Re = 2600, as determined by Lopez et al. 2001, where ω
H1
=
0.1692, ω
H2
= 0.1135 and ω
H3
= 0.2181.
A few sample solutions at Re = 2600, Λ = 2.5, A = 0.01 at various ω
f
are shown in
Fig. 7.7. As was observed in the experiments, for very low ω
f
= 0.01, the flow
undergoes a quasi-static adjustment as shown in the instantaneous streamlines (Fig.
7.7a). For high-ω
f
(ω
f
> 0.3) the results show that the axial region that includes the
vortex breakdown recirculation is essentially steady, with the streamlines virtually
identical to those of the A = 0 steady state shown in Fig. 7.1, and all the oscillations are
concentrated in the bottom and sidewall boundary layers. The ω
f
= 0.2 state shows a
pulsating vortex breakdown recirculation on the axis, and for ω
f
= 0.171 ≈ ω
0
, these
pulsations are significantly more pronounced, as was observed in the experiment.
While the instantaneous streamlines and the experimental dye sheets are
convenient to visualize the vortex breakdown on the axis, they are not particularly
enlightening in identifying the boundary layer responses to the modulations. It is found
that the relative azimuthal vorticity, i.e. the difference between the instantaneous
CHAPTER 7 HARMONICALLY FORCING ON A STEADY SWIRLING FLOW
145
azimuthal vorticity η(t) and the azimuthal vorticity of the steady state at A = 0, η
0
, is
much more informative. Figure 7.8 shows snap-shots of η(t)-η
0
for ω
f
= 0.01, 0.171,
0.2, and 0.5 respectively. These are the variations in the azimuthal vorticity
distribution (see Fig. 7.1c for the mean η distribution) due to the modulations.
(a) ω
f
= 0.01 (T ≈ 628.32)
(b) ω
f
= 0.171 (T ≈ 36.74)
(c) ω
f
= 0.2 (T ≈ 31.42)
(d) ω
f
= 0.50 (T ≈ 12.57)
t = 0 T t ≈ 0.17 T t ≈ 0.43 T t ≈ 0.68T t ≈ 0.86 T
Fig. 7.7 Time sequences of contours of ψ at Re = 2600, Λ = 2.5, ε = 0.01 and ω
f
as
indicated; there are 16 positive (red) and negative (blue) contours quadradically
spaced, i.e. contour levels are [min/max]x (i/16)
2
, and ψ ∈ [-0.00757, 0.0002972].
CHAPTER 7 HARMONICALLY FORCING ON A STEADY SWIRLING FLOW
146
ω
f
= 0.01 ω
f
= 0.171 ω
f
= 0.20 ω
f
= 0.50
Fig. 7.8 Snap-shots of the azimuthal vorticity modulation, η(t)-η
0
(where η
0
is the
steady η for A = 0), at various ω
f
as indicated, all at Re = 2600, Λ = 2.5, A = 0.01 and
at the same phase in the forced modulation. There are 15 positive (blue) and 15
negative (red) contour levels with η
∈[−0.2, 0.2]; some clipping particularly for the ω
f
= 0.171 case is clearly evident.
A number of salient features become immediately obvious. One of them is the
alteration in the structure of the disk and sidewall boundary layers, particularly near
the corner where the disk meets the sidewall. These alterations can be interpreted as
the formation of junction vortices (Allen and Lopez 2007) between the stationary
sidewall and the modulated rotating disk. Another salient feature which is evident from
Fig. 7.8 is the way that the sequence of junction vortices propagate up the sidewall and
collide at the axis near the top and combine to enhance the vortex breakdown
recirculation and amplify its pulsations. This is particularly dramatic at the 1:1
resonance with ω
f
= 0.171 ≈ ω
0
. To illustrate this 1:1 resonance, a comparison was
made for the value of η(t)-η
0
for Re = 2600, Λ = 2.5 (which without modulation
corresponds to the steady vortex breakdown solution in Fig. 7.1) at A = 0.01 and ω
f
=
0.171, with the natural limit cycle solution at Re = 2800, Λ = 2.5, A = 0. Snap-shots of
these two solutions at five phases over one period are shown in Fig. 7.9. Note that for
the natural limit cycle at Re = 2800, this Re is only about 3.3% above critical for the
Hopf bifurcation, and so η(t)-η
0
is a very good approximation to the η-Hopf
CHAPTER 7 HARMONICALLY FORCING ON A STEADY SWIRLING FLOW
147
eigenfunction (Lopz et al. 2001). What is evident, particularly from the detailed time
sequence images, is that the length scale of the junction vortex scales with ω
f
-1
(Fig.
7.8), and that for ω
f
≈ ω
0
the structure of the junction vortices are very similar to the
vortex structure of the Hopf eigenfunction (Fig. 7.9). Furthermore, Lopez et al. (2001)
have previously found that the length scales of the secondary Hopf vorticity structures
scale inversely with their Hopf frequencies, and hence the very good correspondence
between the imposed ω
f
and the length scales of the modulation-induced junction
vortices leading to the other 1:1 resonance spikes in the experimental (Fig. 7.5) and
numerical (Fig. 7.6) response diagrams.
t = 0 T t ≈ 0.17 T t ≈ 0.43 T t ≈ 0.68T t ≈ 0.86 T
Fig. 7.9 Snap-shots of the azimuthal vorticity modulation, η(t)-η
0
(where η
0
is the
steady η for A = 0) for (top row) the natural limit cycle at Re = 2800 and Λ = 2.5, and
(bottom row) the synchronous state at Re = 2600, Λ = 2.5, A = 0.01 and ω
f
= 0.171.
There are 15 positive (blue) and 15 negative (red) contour levels with η
∈[−0.2, 0.2].
These actions of the modulation-induced junction vortices at Re = 2600 are
complicated by the resonant interaction with the nearby Hopf modes. For lower Re, the
small amplitude modulations (A = 0.01) do not resonate with the Hopf modes (their
CHAPTER 7 HARMONICALLY FORCING ON A STEADY SWIRLING FLOW
148
growth rates are strongly negative), and the above-described action of the disk
modulation essentially in isolation of resonances with the Hopf modes can be viewed.
As the mean Re is reduced, the strength of the spikes (see Figs. 7.5 and 7.6) is reduced,
and by mean Re = 800, there is no evidence of any spiking.
At this low Re = 800, we now investigate η(t)-η
0
over a range of ω
f
at A = 0.01.
Snap-shots of these are presented in Fig. 7.10. Now we see that the action of the
modulation is to form an oscillatory modification to the layer on the modulated disk,
with thickness proportional to Re
−0.5
; for the wide range of ω
f
∈[0.01, 0.5] the
thickness of this modification is independent of ω
f
. The reason is that the disk
boundary layer is established very quickly, on the order of one disk rotation, and so a
very large ω
f
is needed to disrupt this. On the other hand, the development of the
sidewall layer occurs on a much slower time scale. So this means that for Λ = 2.5, ω
f
≤
0.01 is needed to have enough time for the sidewall layer modifications to become
established before the sense of the disk rotation changes and the sign of the vorticity
modification in the sidewall layer is changed.
ω
f
= 0.01 ω
f
= 0.171 ω
f
= 0.20 ω
f
= 0.50
Fig. 7.10 Snap-shots of the azimuthal vorticity modulation, η(t)-η
0
(where η
0
is the
steady η for A = 0), at various ω
f
as indicated, all at Re = 800, Λ = 2.5, A = 0.01 and at
the same phase in the forced modulation. There are 10 positive (red) and 10 negative
(blue) contour levels with η
∈ [−0.01, 0.01].
CHAPTER 7 HARMONICALLY FORCING ON A STEADY SWIRLING FLOW
149
The modulation in the disk rotation leads to the formation of a sequence of junction
vortices that propagate up the sidewall and whose length scale is proportional to ω
f
-1
,
the time over which they have available to develop. For small ω
f
≤ 0.01, the sidewall
layer has enough time to fully develop and the junction vortex completely fills the
cylinder. At the other extreme, for ω
f
> 0.3, the sidewall layer and junction vortex only
partially develop before their growth is cut off with the disk reversing its sense of
rotation, resulting in a sequence of junction vortices of alternating sign traveling up the
sidewall. This is particularly evident for ω
f
= 0.5, not only at the low Re = 800
considered (Fig. 7.10), but also at Re = 2600 (Fig. 7.8).
7.5 Concluding Remarks
Using a combination of laboratory experiments, with flow visualization and hot-
film anemometry, together with numerical solutions of the Navier-Stokes equations, a
comprehensive investigation of the flow response to harmonic modulations of the
rotation rate in an enclosed swirling flow has been undertaken. An earlier study (see
Chapter 6), conducted at mean rotation rates where the flow supported self-sustained
oscillations in the absence of modulations, revealed that for modulation amplitudes
that were quite small (less than about 2% of the mean rotation rate), the response
exhibited resonant behavior when the natural frequency and the modulation frequency
were close to rational ratios. One surprising aspect of that study was the quenching of
oscillations in the bulk of the flow for sufficiently large modulation frequencies. An
understanding of this nonlinear behavior motivated the present study, where in order to
determine the flow physics involved, we have considered mean rotation rates below
the critical level for self-sustained oscillations in the unmodulated case.
CHAPTER 7 HARMONICALLY FORCING ON A STEADY SWIRLING FLOW
150
Our investigation has revealed three distinct regimes in the response to harmonic
modulations, characterized by the modulation frequency. For low modulation
frequencies, we have a regime of quasistatic adjustment, where the swirling flow
adjusts to the steady unmodulated solution at the instantaneous value of the rotation
rate. In this regime, the boundary layers on the cylinder sidewall have sufficient time
to fully develop during the long modulation period. At the other extreme, for high
modulation frequencies, the sidewall layer does not have sufficient time to develop. As
the rotating disk quickly accelerates and decelerates during the short modulation
period, junction vortices form at the junction between the rotating disk and the
stationary cylinder sidewall. As a junction vortex propagates up the sidewall it
establishes the boundary layer. When the next junction vortex is generated, it is of
opposite sense and the boundary layer development process is stopped and another
layer of opposite signed vorticity is initiated. The distance up the sidewall that the
junction vortex propagates and develops the sidewall layer is linearly proportional to
the modulation period. The result is a sequence of junction vortices of alternating sign
propagating up the sidewall. Their short wavelength and high frequency tends to
inhibit the natural (Hopf) instability of the steady axisymmetric basic state, accounting
for the quenching of the oscillations in the bulk observed in the earlier study. The third
regime is characterized by modulation frequencies close to the Hopf frequencies of the
basic state. By comparing the spatio-temporal structure of the sequence of junction
vortices produced by the modulations in this range of frequencies with the vorticity
eigenfunctions responsible for the self-sustained oscillations in the unmodulated
problem, we have clearly identified the mechanism responsible for the large amplitude
pulsations of the vortex breakdown recirculations on the axis at mean rotation rates
well below critical for the self-sustained vortex breakdown oscillations.
CHAPTER 7 HARMONICALLY FORCING ON A STEADY SWIRLING FLOW
151
Previous linear stability analysis (Lopez et al. 2001) identifying the vorticity
eigenstructures has been indispensable in constructing this complete picture of the
resonant response to harmonic modulations. An important consequence of this study is
that to achieve a strong resonant effect, it is not sufficient to only consider the temporal
characteristics of the flow state, but that the imposed forcing must also match the
spatial characteristics. This may have wide-ranging implications for flow control issues
in general.