Synthesis and stress analysis of germanium nanocrystals embedded in dielectric matrices 1
Bạn đang xem bản rút gọn của tài liệu. Xem và tải ngay bản đầy đủ của tài liệu tại đây (2.89 MB, 22 trang )
Chapter 4 Results & Discussions I
- 79 -
Chapter 4
Results & Discussions I:
Synthesis and Growth of Ge
nanocrystals in Silicon Oxide Matrix
4.1 Introduction
With the observation of visible photoluminescence and charge storage
properties from Si and Ge nanocrystals embedded in silicon oxide matrix, there
has been tremendous research interest in this area. As mentioned in Chapter 2,
there are currently several techniques being used to synthesize Ge nanocrystals.
Among these techniques, there is a keen interest in the synthesis of Ge
nanocrystals in SiO
2
via furnace annealing of a co-sputtered SiO
2
+ Ge film [1,2].
However, it was found that an as-prepared RF co-sputtered system of Ge and SiO
2
contains not only elemental Ge and oxides of Si but also oxides of Ge [3]. Due to
its large free energy, these GeO
2
will tend to decompose and form Ge in the
presence of a reducing agent with O
2
transferred to the reducing agent.
Taraschi et al. had provided a detailed analysis of the crystalline
nanostructure of Ge nanocrystals formed by annealing oxidized SiGe films [4].
They varied the H
2
partial pressure and processing temperature in their
Chapter 4 Results & Discussions I
- 80 -
experiments and were able to conclude that the presence of H
2
in the annealing
ambient can directly impact the structural evolution of the nanocrystal by
influencing processes of nucleation, growth and coarsening. However, they were
unable to examine the influence of Ge concentration on these processes in the
presence of H
2
as they used samples with a fixed Ge concentration in their work.
On the other hand, Kobolov et al. had performed a study on the local
structure of Ge nanocrystals embedded in a SiO
2
matrix by annealing co-sputtered
samples with different Ge concentration via the X-ray absorption fine structure
technique. They concluded that for samples with high Ge concentration (Ge
concentration = 60 mol.%), annealing results in the formation of nanocrystals,
whereas for samples with low Ge concentration (Ge concentration = 25-40
mol.%), little or no indication of Ge cluster formation was observed after the
annealing [5]. Unfortunately, the effect of annealing ambient on the formation of
Ge nanocrystals was not examined as their experiments were done only in inert
argon ambient.
In this chapter, a systematic study on the influence of annealing ambient,
temperature and Ge concentration on the growth of nanocrystals in a silicon oxide
matrix is carried out with three series of samples (i.e. Samples A, B and C) with
different Ge concentrations. The Ge content in Samples A, B and C were
estimated to be 3, 10 and 15 at.%, respectively, by the Rutherford backscattering
spectroscopy (RBS) technique.
Chapter 4 Results & Discussions I
- 81 -
4.2 Effect of reductant
In order to study the effect of reductants on the formation of Ge
nanocrystals in the silicon oxide matrix, Sample A (i.e. low Ge concentration
sample) have been annealed in both N
2
and forming gas (10% H
2
+ 90% N
2
) at
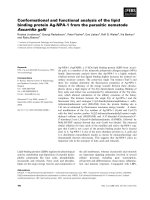
different temperatures. Figure 4.1 shows the Raman spectra of those samples
annealed at different conditions. It can be seen from the figure that annealing in
N
2
ambient up to 1000°C resulted in relatively featureless spectra, indicating that
no Ge nanocrystals has been formed. However, when the sample was annealed in
forming gas, a significant Ge peak can be observed when Sample A was annealed
at 900°C.
Figure 4.1: Raman spectra of Sample A annealed between 700°C to 1000°C
for 15 minutes. The top four curves represent samples annealed in
forming gas (10% H
2
+ 90% N
2
) while the bottom two curves are
from samples annealed in N
2
.
Chapter 4 Results & Discussions I
- 82 -
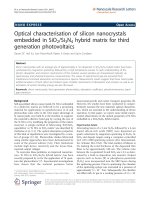
Figure 4.2 shows the cross-sectional TEM (XTEM) images of Sample A
annealed in forming gas at 800°C for 15 minutes. Numerous small Ge
nanocrystals can be seen to be distributed throughout the entire bulk of the film.
The presence of these small nanocrystals accounts for the weak Ge peak in Figure
4.1. For 900°C anneal in forming gas (see Figure 4.3), the nanocrystals become
larger in the bulk of the film. The inset of Figure 4.3 is the high resolution TEM
(HRTEM) image of a well-formed single crystalline Ge nanocrystal. There also
exists a region that is void of nanocrystals between the substrate and a band of
nanocrystals in the bulk of the film. The large nanocrystals gave rise to the
significant Ge peak in Figure 4.1. For 1000°C anneal in forming gas (Figure 4.4),
the distribution of the nanocrystals follows the same trend as the 900°C case but
the density of nanocrystals has decreased significantly. This may explain the
reduction in intensity of the Ge peak in Figure 4.1 for Sample A annealed at
1000°C.
Chapter 4 Results & Discussions I
- 83 -
Figure 4.2: XTEM image of Sample A annealed at 800°C in forming gas (10%
H
2
+ 90% N
2
) for 15 minutes.
Figure 4.3: XTEM image of Sample A annealed at 900°C in forming gas (10%
H
2
+ 90% N
2
) for 15 minutes. The inset is a HRTEM image of a
nanocrystal.
Chapter 4 Results & Discussions I
- 84 -
Figure 4.4: XTEM image of Sample A annealed at 1000°C in forming gas
(10% H
2
+ 90% N
2
) for 15 minutes.
In general, the Ge nanocrystal formation process can be described by the
following steps:
(i) GeO
2
(or GeO
x
) reduction, leading to the creation of elemental Ge
atoms,
(ii) Diffusion of liberated Ge in the oxide matrix,
(iii) Nucleation due to Ge–Ge collisions,
(iv) Growth, whereby diffusing Ge atoms bond to existing Ge nuclei, and
(v) Coarsening of nanocrystals due to Ostwald ripening.
The direct decomposition of GeO
2
is the simplest reaction for the reduction of
GeO
2
to Ge as given by: GeO
2
→ Ge + O
2
. However, Maeda has shown that the
Chapter 4 Results & Discussions I
- 85 -
direct decomposition of GeO
2
at 800°C at 1 atmospheric pressure is not possible
without the participation of reductants [6].
It has been established that the Ge oxides and suboxides in a Si–O–Ge
system could be reduced to elemental Ge by Si at an elevated temperature above
800°C [6]. As mentioned in the pervious chapter, these reduction reactions of
GeO
x
and GeO
2
to Ge by Si are as follows:
Si + GeO
2
→ Ge + SiO
2
(4.1)
Si + GeO
x
→ Ge + SiO
x
(4.2)
In addition, It has shown that the main source of Si for the reduction of
GeO
2
is not from the excess Si atoms originally present in the oxide matrix but
from Si atoms diffused from the Si substrate due to the abundance of Si in the
substrate. However, although Si can diffuse from the substrate to the film to
reduce the Ge oxides in the samples to increase the supply of Ge atoms,
apparently this effect alone is not sufficient to trigger nucleation during the
annealing process as no Ge–Ge Raman mode can be detected in the sample
annealed in N
2
alone.
On the other hand, the presence of H
2
in the annealing ambient could also
act as a reducing agent for GeO
2
in a reduction reaction given by [1,3]
GeO
2
+ 2H
2
→ Ge + 2H
2
O (4.3)
As a result, when H
2
is present in the annealing ambient, there is evidence of
nucleation and growth of the Ge nanocrystals from the Raman and TEM results. It
has been suggested [7] that annealing the co-sputtered silicon oxide plus Ge films
in a H
2
containing ambient can cause the incorporation of hydroxyl groups (–OH)
Chapter 4 Results & Discussions I
- 86 -
into the oxide matrix. The –OH acts as a network modifier in the system as their
presence opens up the oxide structure, consequently enhancing the diffusivity of
Ge. In addition, the presence of H
2
in the annealing ambient makes it possible for
Ge to form volatile, fast diffusing GeH
x
species which will also enhance the
diffusivity of Ge [8]. H
2
is also important in assisting the nucleation of the Ge
nanocrystals due to its high values of diffusivity in silica (~5.6×10
−5
cm
2
s
−1
) for
the temperature range concerned [9] whereas for Si, even at 1000°C, the
diffusivity of Si in SiO
2
had only been estimated to be in the range of 4.2×10
−13
cm
2
s
−1
[10]. By diffusing through the SiO
2
matrix rapidly, H
2
can hasten the
nucleation and growth processes by reducing germanium oxide to increase the
supply of Ge in the matrix. All these factors will assist in the formation of Ge
nanocrystals.
The voided region at the surface of the film for an annealing temperature
of 800°C (i.e. Figure 4.2) can be explained by the outdiffusion of Ge due to the
low solubility of Ge in SiO
2
[11], or by the re-oxidation of Ge by the small
concentration of oxidants present in the annealing gas to form GeO
2
[12]. The
voided region between the substrate and the band of nanocrystals observed for
samples annealed at 900 and 1000°C can be attributed to the diffusion of Ge into
the Si substrate due to the complete miscibility between Ge and Si. The
significant increase in the diffusivity of Ge at temperatures of 900°C or higher is
most likely due to the fact that such temperatures are very close to the melting
point of bulk Ge such that it enables the Ge atoms to overcome kinetic limitations
and diffuse into the Si substrate.
Chapter 4 Results & Discussions I
- 87 -
The diffusion of Ge towards the Si substrate will result in Si-Ge bonds
being formed at the Si surface. This accounts for the very clear Raman peaks at ~
410-440 cm
-1
shown in Figure 4.5. The intensity of these peaks becomes more
prominent as the annealing temperature increases.
Figure 4.5: Raman spectrum showing the growth of the low frequency Si peak,
between 300 to 500 cm
-1
, with increase in annealing temperature
due to the localized Si-Si optic mode in near vicinity of Ge atoms.
The random introduction of Ge atoms into an initially pure Si crystal
reduces the local symmetry, which leads to the localization of the Si-Si optical
phonons (phonon confinement) in the Ge neighborhoods. The frequencies of these
modes are reduced through the effect of the larger mass Ge, which pulls modes
out of the main Si-Si optic-phonon band to lower frequencies [13].
Chapter 4 Results & Discussions I
- 88 -
However, this process is highly temperature driven as it requires long
range diffusion activities of Ge to take place. At 800°C and below, due to the
kinetic limitations encountered by the Ge atoms at such temperature, this process
will not be prevalent, and thus accounting for the absence of these peaks at ~410-
440 cm
-1
for this temperature anneal range. When the temperature increases to
900°C and 1000°C, which is near to or above the melting point of Ge, the values
for Ge diffusivity would be very high; thus the effects of this diffusion is more
significant and can be observed.
The diffusion of Ge towards the Si substrate leads to a net reduction in the
Ge content within the film. This will result in a net reduction of the collision
frequencies of the Ge atoms within the silicon oxide matrix as the average
distance the Ge atoms need to travel before they collide with each other increases
as there are now less of them. Consequently the probability of nucleation events
drops due to an increase in activation energy for nucleation brought on by the
reduction in Ge supersaturation. Within the voided region of Figures 4.3 and 4.4,
the rate of diffusion of Ge into the Si substrate apparently dominates over the
nucleation rate, and thus no nanocrystals can form. As this phenomenon is
dependent on the diffusivity of Ge, the voided region is larger for 1000°C anneal
as compared to 900°C anneal. For 800°C anneal, the relatively lower temperature
would mean a lower Ge diffusivity, thus this phenomenon is less obvious as the
Ge atoms are unable to overcome the kinetic limitations.
Chapter 4 Results & Discussions I
- 89 -
4.3 Effect of Ge concentration
It has been mentioned in the Chapter 2 that the supply of Ge for the
formation of the nanocrystals can also come from the excess elemental Ge atoms
originally existing in the matrix [10,14]. In such cases, when the Ge concentration
is high, it becomes possible for the nanocrystal formation process to bypass the
reduction steps, to supply the Ge atoms, and nucleation and growth can occur at a
earlier time and a faster rate. In order to examine the influence of Ge
concentration on the formation of nanocrystals, a comparison of the Raman and
TEM results of Samples B and C (i.e. of medium and high Ge concentration) with
Sample A (i.e. of low Ge concentration) will be made in this section.
The Raman spectra of Samples B and C annealed in forming gas are
shown in Figure 4.6 and Figure 4.7. In contrast to the Raman spectra of the
forming gas annealed Sample A, a relatively significant Raman peak can already
be observed for Sample B annealed at 800°C, as shown clearly in the figures. For
sample C annealed at 800°C, the relative stronger the intensity and the reduced
Full Width at Half Maximum (FWHM) suggested that the formation of Ge
nanocrystal are even denser and with larger size and better crystalline. In addition,
unlike sample A whereby there is no noteworthy Raman band for the sample
annealed in N
2
ambient (see Figure 4.1), the Raman spectra of Sample B and C
annealed in N
2
at same temperature are identical as comparing to the one annealed
in the forming gas.
Chapter 4 Results & Discussions I
- 90 -
Figure 4.6: Raman spectra of Sample B annealed between 800°C to 1000°C
for 15 minutes in forming gas (10% H
2
+ 90% N
2
).
Figure 4.7: Raman spectra of Sample C annealed between 800°C to 1000°C
for 15 minutes in forming gas (10% H
2
+ 90% N
2
).
Chapter 4 Results & Discussions I
- 91 -
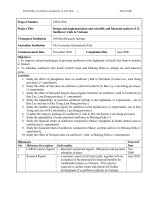
Figure 4.8 shows the XTEM image of Sample B annealed in forming gas
at 800°C for 15 minutes. Numerous small Ge nanocrystals can be seen in the
entire bulk of the film. This is a much higher density of nanocrystals as compared
to Sample A in Figure 4.2 (i.e., of lower Ge concentration) at the same annealing
temperature. The higher density of nanocrystals resulted in the appearance of a
more significant Ge peak in the Raman spectrum shown in Figure 4.6. This is
expected because when the Ge concentration is high, the critical nucleus size is
smaller and nucleation barriers are lowered due to the higher Ge supersaturation.
Consequently, Ge nanocrystals will be able to nucleate and form earlier and faster
in Sample B. After 900°C anneal of Sample B (Figure 4.9), the nanocrystals are
well-formed, showing facets that are bounded by crystal planes as can be seen in
the HRTEM image shown in the inset of Figure. This implies that it is possible to
attain the equilibrium interface energy minimizing configuration at 900°C. When
the temperature was further increased to 1000°C (Figure 4.10), the nanocrystals
become large and spherical with a very dense band of nanocrystals close to the Si
substrate/SiO
2
interface due to the diffusion of Ge towards the Si substrate.
Figures 4.11 to 4.13 are the XTEM images of Sample C annealed in forming gas
at 800°C, 900°C and 1000°C, respectively, for 15 minutes. The characteristics and
the distribution of the Ge nanocrystals are very similar as comparing to the
Sample B (see Figures 4.8 to 4.10). However, it should be noted that, with the
highest Ge concentration (i.e. Sample C), the nanocrystal are general larger and
denser as comparing to the other set of the samples. This is in good agreement of
the sharp Raman spectra shown in Figure 4.7.
Chapter 4 Results & Discussions I
- 92 -
Figure 4.8: XTEM image of Sample B annealed at 800°C in forming gas (10%
H
2
+ 90% N
2
) for 15 minutes.
Figure 4.9: XTEM image of Sample B annealed at 900°C in forming gas (10%
H
2
+ 90% N
2
) for 15 minutes. The inset is a HRTEM image of a
nanocrystal.
Chapter 4 Results & Discussions I
- 93 -
Figure 4.10: XTEM image of Sample B annealed at 1000°C in forming gas
(10% H
2
+ 90% N
2
) for 15 minutes.
Figure 4.11: XTEM image of Sample C annealed at 800°C in forming gas (10%
H
2
+ 90% N
2
) for 15 minutes.
Chapter 4 Results & Discussions I
- 94 -
Figure 4.12: XTEM image of Sample C annealed at 900°C in forming gas (10%
H
2
+ 90% N
2
) for 15 minutes. The inset is a HRTEM image of a
nanocrystal.
Figure 4.13: XTEM image of Sample C annealed at 1000°C in forming gas
(10% H
2
+ 90% N
2
) for 15 minutes.
Chapter 4 Results & Discussions I
- 95 -
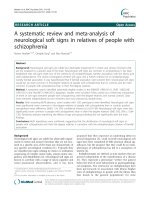
It is also interesting to note that, the voided region near the surface of the
film is generally wider for the samples with higher annealing temperature (i.e.
1000°C) and the lower Ge concentration (i.e. Sample A). This is due to the fact
that the severe outdiffusion of the Ge away from the matrix will lower the total
Ge supersaturation and leads to no nanocrystal formation. In fact, if we assume
the diffusion length (i.e. the length of voided region, X
d
) of Ge atom in silicon
oxide matrix is given by [6]
X
d
= (πD
Ge
t)
1/2
, (4.4)
where D
Ge
is the diffusivity and t is the annealing time, the nature logarithm of
D
Ge
verse the annealing temperature can be plotted in Figure 4.14. The activation
energy for Ge diffusion could be calculated to be 0.45eV, 0.68eV and 0.92eV for
sample A, B and C, respectively. This could be explained by the fact that, for the
same annealing condition, the collision frequency between the Ge atoms will be
lower for the sample with low Ge supersaturation. This will result in a lower
probability for nucleation and hence make it easier for the Ge atoms to diffuse.
However, all the activation energy calculated here exhibit a large deviation from
those reported by Minke et al. which is around 5.68eV for the substitutional Ge
diffusion in silica [15]. Such a difference could be ascribed to the fact that, the
sputtered silicon oxide matrix is known to be more porous as compared to the
silica glass which make the diffusion of Ge atom relatively easier and therefore
lowers the activation energy.
Chapter 4 Results & Discussions I
- 96 -
Figure 4.14 The Ge diffusivity in sputtered silicon oxide is plotted as a
function of annealing temperature for all three samples.
4.4 Summary
The influences of ambient and Ge concentration on the formation of Ge
nanocrystals have been studied over a range of annealing temperatures. It was
found that under conditions of relatively low Ge concentration, H
2
plays a very
important role in assisting the formation of the nanocrystals as it can enhance the
diffusivity of the Ge atoms and reduce the germanium oxides present in the
silicon oxide matrix into Ge, thereby increasing the supply of Ge. As the Ge
Chapter 4 Results & Discussions I
- 97 -
concentration increases, the role played by hydrogen in the formation of the
nanocrystals becomes diminished due to a higher Ge supersaturation which
lowers the barriers to nucleation and causes a reduction in the critical nucleus
size. Nanocrystals can form regardless of whether H
2
is present in the annealing
ambient or not in such cases. Finally, the growth kinetics of the nanocrystals
under the different annealing conditions were described and explained and the
diffusivity of the Ge atom in the sputtered silicon oxide was also calculated.
Chapter 4 Results & Discussions I
- 98 -
References
[1] M. Fuiji, S. Hayashi and K. Yamamoto, “Growth of Ge mircocrystals in
SiO
2
thin films matrices: A raman and electron microscopic study”, Jpn. J.
Appl. Phys., vol. 30, no. 4, pp. 687-694, 1991.
[2] Y. Maeda, N. Tsukamono, Y. Yazawa, Y. Kanemitsu and Y. Masumoto,
“Visible photoluminescence of Ge microcrystals embedded in SiO
2
glassy
matrices”, Appl. Phys. Lett., vol. 59, no. 24, pp. 3168-3171, 1991.
[3] W. K. Choi, Y. W. Ho, S. P. Ng and V. Ng, “Microstructural and
photoluminescence studies of germanium nanocrystals in amorphous
silicon oxide films”, J. Appl. Phys., vol. 89, pp. 2168-2172, 2001.
[4] G. Tarachi, S. Saini, W. W. Fan, L. C. Kimerling and E. A. Fitzgerald,
“Nanostructure and infrared photoluminescence of nanocrystalline Ge
formed by reduction of Si
0.75
Ge
0.25
O
2
/ Si
0.75
Ge
0.25
using various H
2
pressures”, J. Appl. Phys., vol. 93, pp. 9988-9996, 2003.
[5] A. V. Kobolov., H. Oyanagi, Y. Maeda and K. Tanaka, “Local structure of
Ge nanocrystals embedded in SiO
2
studied by X-ray absorption fine
structure”, J. Synchroton Rad., vol. 8, pp. 511-513, 2001.
[6] Y. Maeda, “Visible photoluminescence from nanocrystallite Ge embedded
in a glassy SiO2 matrix: Evidence in support of the quantum-confinement
mechanism,” Phys. Rev. B, vol. 51, pp. 1658-1670, 1995.
[7] J. M. Blaser, C. Caragianis-Broadridge, B. L. Walden and D. C. Paine, “A
study of the effect of oxide structure on the synthesis of nanocrystalline
Chapter 4 Results & Discussions I
- 99 -
Ge from Si
1-x
Ge
x
O
2
”, Mater. Res. Soc. Symp. Proc., vol. 398, pp. 619-624,
1996.
[8] B. Schmidt, D. Grambole, F. Herrmann, “Impact of ambient atmosphere
on as-implanted amorphous insulating layers”, Nucl. Instr. Meth. B, vol.
191, pp. 482-486, 2002.
[9] R. W. Lee, “Diffusion of Hydrogen in synthetic and natural fused quartz”,
J. Chem. Phys., vol. 38, pp. 448-455, 1963.
[10] W. K. Choi, V. Ho, V. Ng, Y. W. Ho, S. P. Ng and W.K. Chim,
“Germanium diffusion and nanocrystal formation in silicon oxide on
silicon substrate under rapid thermal annealing”, Appl. Phys. Lett., vol.
86, pp. 143114-1-3, 2005.
[11] H. G. Chew, W. K. Choi, Y. L. Foo, F. Zheng, W. K. Chim, Z. J. Voon, K.
C. Seow, and E. A. Fitzgerald, “Effect of germanium concentration and
oxide diffusion barrier on the formation and distribution of germanium
nanocrystals in silicon oxide matrix”, Nanotechnology, vol. 17, pp. 1964-
1968, 2006.
[12] K. H. Heinig, B. Schmidt, A. Markwitz, R. Grötzschel, M. Strobel and S.
Oswald, “Precipitation, ripening and chemical effects during annealing of
Ge
+
implanted SiO
2
layers”, Nucl. Instr. Meth. B, vol. 148, pp. 969-974,
1999.
[13] M. I. Alonso and K. Winer, “Raman spectra of c-Si
1-x
Ge
x
alloys”, Phys.
Rev. B, vol. 39, pp. 10056-10062, 1989.
Chapter 4 Results & Discussions I
- 100 -
[14] W. K. Choi, Y. L. Foo, V. Ho and R. Nath, “In situ transmission electron
microscopy study on the formation and evolution of germanium
nanoclusters and nanoparticles in silicon oxide matrix”, Chem. Phys. Lett.,
vol. 416, pp.381-384, 2005.
[15] M. V. Minke and K.A. Jackson, “Diffusion of germanium in silica glass”,
J. Non-Crys. Solids, vol. 351, pp. 2310-2316, 2005.