Synthesis and stress analysis of germanium nanocrystals embedded in dielectric matrices 4
Bạn đang xem bản rút gọn của tài liệu. Xem và tải ngay bản đầy đủ của tài liệu tại đây (3.25 MB, 23 trang )
Chapter 7
Results & Discussions IV
Chapter 7
Results & Discussions IV:
Stress Tuning of Ge Nanocrystals
Embedded in Dielectrics
7.1
Introduction
In Chapter 6, it has been shown that synthesis of Ge nanocrystals from
conventional furnace annealing of co-sputtered SiO2 + Ge films will induce large
compressive stresses for the nanocrystals. The magnitude of the stress exhibits an
intimate link to the annealing temperature, annealing time and the Ge
concentration in the co-sputtered films, which in turn determine the size, shape,
density and quality of the nanocrystals. The origin of the stress is attributed to the
fact that the SiO2 matrix is unable to accommodate the growing Ge nucleus.
However, it should be noted that, due to the volumetric difference between the
nanocrystals and the matrix cavity, the intrinsic stress is found always to be
compressive in nature.
In a recent theoretical study, Liu et al. have shown that, in the nanocrystalmatrix system, the distribution of the stress and strain field plays an important role
in deciding the physical and thermodynamic properties of the nanocrystals [1].
- 142 -
Chapter 7
Results & Discussions IV
Moreover, Wada et al. have also presented a potential high performance photodetector by varying the bandgap of Ge film via tensile strain [2]. Therefore, it is
important to develop a method to alter the stress state of Ge nanocrystals
embedded in the dielectrics such that one may be able to tune the bandgap of the
nanocrystals.
In this chapter, three different stress tuning methods will be proposed,
namely the annealing techniques, the capping stressor and the dielectric matrix.
The stress state of Ge nanocrystals will be analyzed using Equation 6.1
highlighted in Section 6.3.
7.2
Influence of the Annealing Technique
In order to examine the effects of annealing technique on the growth and
the stress states of the Ge nanocrystals, two sets of samples were prepared by cosputtering a SiO2 + Ge target in argon at room temperature and annealed by rapid
thermal annealing (RTA) for 60 seconds or conventional furnace annealing (CFA)
for 15 minutes, respectively.
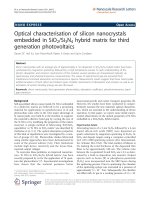
Figures 7.1 (a)-(c) are the cross section TEM (XTEM) images of the RTA
samples annealed at 800, 900 and 1000°C, respectively. It can be seen from these
figures that, when RTA is preformed at 800°C, numerous small Ge nanocrystals
are uniformly distributed in the entire bulk of the film. The voided region at the
surface of the film can be explained by the out-diffusion of Ge to the ambient.
When the annealing temperature was increased to 900 and 1000°C, one can
observe that, the nanocrystals grew in size and generally adopted a spherical
- 143 -
Chapter 7
Results & Discussions IV
shape. The size variation of the nanocrystals is also greater as compared to the
one annealed at 800°C, indicating that coarsening has taken place or is in the
process of occurring. This is most likely due to the fact that when annealed at 900
and 1000°C, Ge atoms are able to overcome kinetic limitations and enhance the
nucleation and growth of the nanocrystals.
The XTEM images of samples furnace annealed at 800, 900 and 1000°C
for 15 minutes are shown in Figures 7.1 (d)-(f), respectively. In comparison to the
samples annealed by RTA, the furnace annealed samples generally exhibit larger
nanocrystals at the same annealing temperatures. The size variation of the
nanocrystals is attributed to the much longer annealing duration of furnace
annealing which assists the diffusion of Ge atoms and therefore the growth of the
nanocrystals. In addition, it is interesting to note from the inset of Figure 7.1 (e),
unlike the nanocrystals of the RTA sample shown in the inset of Figure 7.1 (b),
the nanocrystals synthesized using furnace annealing at 900°C were well formed,
showing facets that are bounded by crystal planes. This implies that it is possible
to attain the equilibrium interface energy minimizing configuration at this
condition. Moreover, one can observe the lineup of the Ge nanocrystals near the
Si oxide/Si interface in Figure 7.1 (f). This is probably due to the huge increase of
Ge diffusivity at 1000°C, which allow the diffusion of Ge atoms towards the Si
substrate.
- 144 -
Chapter 7
Figure 7.1:
Results & Discussions IV
Ge plus Si oxide sample rapid thermal annealed at (a) 800°C, (b)
900°C, (c) 1000°C for 60 seconds and conventional furnace
annealed at (d) 800°C, (e) 900°C, (f) 1000°C for 15 minutes. The
inset is the HRTEM micrograph of Ge nanocrystal from the
corresponding sample.
- 145 -
Chapter 7
Results & Discussions IV
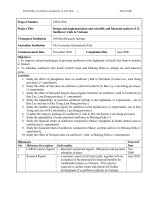
Figure 7.2 summarizes the compressive stress experienced by the Ge
nanocrystals which was calculated from Equation 6.1 in Section 6.3. It can be
seen from the figure that, for the RTA samples, the compressive stress increases
gradually from 0.3GPa to 1.2GPa as the annealing temperature increases from
800°C to 1000°C. Whereas for the furnace annealed samples, the compressive
stress decreases from 0.4GPa to 0.16GPa when the annealing temperature
increases from 800°C to 900°C, follow by a sharp increase to 1.3GPa at 1000°C.
Figure 7.2:
Comparison of stress experienced by Ge nanocrystals between
RTA and CFA samples.
It is reasonable to expect that, for the RTA samples, the low compressive
stress experienced by the nanocrystals when annealed at 800°C is because of the
small size of the nanocrystals, as observed in Figure 7.1 (a). The size of the
nanocrystal increases when the annealing temperature reaches 900°C and 1000°C,
- 146 -
Chapter 7
Results & Discussions IV
therefore, it becomes more difficult for the silicon oxide matrix to accommodate
those nanocrystals, and hence resulting in a build-up and increase in stress.
On the other hand, a furnace annealing at 800°C for 15 minutes allows the
growth of the nanocrystals due to its longer annealing time. This accounts for a
relatively higher value of P obtained at 800°C. A few groups have suggested that
conventional furnace annealing generally leads to higher activation energy for
nucleation or a slower crystallization process, as compared to RTA [3,4]. This,
coupled with the right diffusivity of Ge at 900°C, makes it possible for the
nanocrystals to form facets so as to minimize the interfacial energy. In the process
of faceting, it would be energetically favourable for the nanocrystals to grow
along planes that exerted the least pressure on the silicon oxide matrix as it
enables them to minimize their strain energy and thus minimize stress for the
nanocrystals. At 1000°C, the Ge atoms would become molten and lose their
atomic ordering. This resulted in a significant increase in the diffusivity of the Ge
atoms. Consequently, the nanocrystals will form very rapidly, giving rise to a
large compressive stress exerted on the nanocrystals. This large compressive
stress will then cause the nanocrystals to adopt a spherical shape in order to
minimize the surface-to-volume ratio of the nanocrystals and thus minimize the
strain energy of the nanocrystals. Note that, under such a large compressive stress,
nanocrystals are observed to be defective with multiple twinning, as shown in
Figure 7.1 (f).
- 147 -
Chapter 7
7.3
Results & Discussions IV
Influence of the capping stressor
In this section, we present results of stress development of the Ge
nanocrystals by applying the silicon nitride (SiN) capping stressor. It has been
reported that the annealed plasma enhanced chemical vapour deposition (PECVD)
SiN films exhibit considerable tensile strain. This tensile strain increases with
annealing temperature from 750°C and saturates at a value of 1.2GPa at around
1100°C [5,6]. This has been suggested to be linked to the release of hydrogen and
reformation of Si-N bond network after the annealing [5]. A possible reaction is
shown as follows.
Si2-N-H + 2N-H
2Si-N + NH3
(7.1)
In order to examine the effect of the SiN capping stressor on the formation
and stress state of the nanocrystals, three sets of samples were prepared by cosputtering a SiO2 + Ge target in argon at room temperature. One set of samples
was free of capping layer to serve as a control sample, while the other two sets of
samples were subject to a capping layer growth of either SiN or SiO2. The SiN
capping stressor with a thickness of around 200nm was grown by the PECVD
technique at 280°C with SiH4 and NH3 as source gases. The SiO2 capping layer
with a thickness of around 200nm was grown also by the PECVD technique at
280°C with SiH4 and N2O as source gases. In addition, the nanocrystals were then
synthesized by rapid thermal annealing of the samples from 800°C to 1000°C for
60 seconds.
Figures 7.3 and 7.4 are the XTEM images of the 1000°C rapid thermal
annealed samples without and with the SiO2 cap, respectively. As can be seen, for
- 148 -
Chapter 7
Results & Discussions IV
both samples, the nanocrystals are quite uniformly distributed throughout the film
with a lineup of the Ge nanocrystals near the Si oxide/Si interface. This is
probably due to the diffusion of the Ge atoms as mentioned before. Though both
samples exhibit the very similar distribution pattern of the nanocrystals, it should
be noted that the size of nanocrystals from the sample with SiO2 cap is relatively
larger as compared to the one without the capping layer. This could be explained
by the fact that the SiO2 capping layer will limit the out-diffusion of the Ge atoms
and therefore enhance the nucleation and growth of the nanocrystals.
Figure 7.3:
Ge plus Si oxide sample rapid thermal annealed at 1000°C for 60
seconds.
- 149 -
Chapter 7
Figure 7.4:
Results & Discussions IV
Ge plus Si oxide sample with SiO2 capping layer rapid thermal
annealed at 1000°C for 60 seconds.
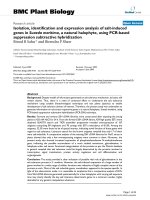
Figure 7.5 (a) shows the XTEM image of the 1000°C rapid thermal
annealed samples with the SiN cap and the inset are the HRTEM image of the Ge
nanocrystals. As compared to the one without the SiN cap (see Figure 7.3), the
sample with the SiN cap exhibited much denser Ge nanocrystals. Note that, SiN is
commonly used as a barrier material to prevent inter-diffusion of metal and
semiconductor. Therefore, it is reasonable to expect that, in the sample with the
SiN cap, the higher Ge supersaturation would lead to a reduction of barrier to
nucleation and hence more nanocrystal formation. This is further proven by the
secondary ions mass spectrometry (SIMS) results shown in Figure 7.6, whereby
- 150 -
Chapter 7
Results & Discussions IV
comparing to the as-prepared sample, Ge content of the capped sample is still well
preserved inside the silicon oxide matrix even after annealing.
It is also interesting to note that, for the SiN capped sample, there are
voided regions of Ge nanocrystal near the SiN/Si oxide interface and Si/Si oxide
interface (see Figure 7.5 (a)). From the energy dispersive x-ray (EDX) analysis
shown in the inset of Figure 7.5 (b), the Ge content near the Si/Si oxide interface
is estimated to be less than 2%. This is in good agreement with the SIMS result,
whereby a very significant Ge depletion near the interface was observed.
However, such a phenomenon was not found from both the sample without the
SiN cap and the control sample with the silicon oxide cap. This probably suggests
that the enhanced Ge diffusion may be linked to the large intrinsic tensile strain of
the SiN film.
- 151 -
Chapter 7
Figure 7.5:
Results & Discussions IV
(a) Ge plus Si oxide sample with SiN capping layer rapid thermal
annealed at 1000°C for 60 seconds. (b) HRTEM image of Si/Si
oxide interface (i.e. region (I) in (a)). The inset is the EDX
spectrum from the voided region of Figure 7.5 (b).
- 152 -
Chapter 7
Figure 7.6:
Results & Discussions IV
SIMS profiles of as-sputtered and RTA annealed SiN capped
sample.
Figure 7.7 shows the comparison of the stress experienced by Ge
nanocrystal in the sample with and without the SiN cap. Note that, there are two
competing factors which will influence the stress state of the nanocrystals in
dielectrics, one is the capping effect and the other is temperature-dependent
intrinsic tensile strain of SiN film. At a low temperature of 800°C, the breakage of
N-H bond and the reformation of Si-N bond network is very minimal and results
in the insignificant intrinsic stress. Coupled with the fact that the SiN cap will
effectively prevent the out-diffusion of Ge and hence lead to denser nanocrystals,
the stress experienced by the Ge nanocrystal from the SiN cap sample is therefore
expected to be slightly higher as compared to the uncapped sample. However,
when the annealing temperature is increased to 900 and 1000°C, although the
nanocrystals are denser, the observed compressive stress of the nanocrystals is
very much reduced owing to the reformation of the Si-N network described by
Equation 7.1. This suggests that, at such high temperature, the large intrinsic
- 153 -
Chapter 7
Results & Discussions IV
tensile strain of the SiN film starts to dominate over the capping effect, and
therefore relax the nanocrystals.
Figure 7.7:
(a) Comparison of stress experienced by Ge nanocrystals between
uncapped and SiN capped samples; (b) Typical Raman spectra of
as-grown and etched samples with and without SiN cap with RTA
at 1000°C for 60seconds.
- 154 -
Chapter 7
7.4
Results & Discussions IV
Influence of the Dielectric Matrix
In this section, we evaluate the stress or strain experienced by the Ge
nanocrystals in a different dielectric matrix (i.e. HfAlO). There are three series of
samples with increasing Ge content, namely, Samples A, B and C, prepared for
this work. According to Rutherford backscattering spectroscopy (RBS)
experiment, the Ge content in Samples A, B and C were estimated to be 10, 18
and 22 at.%, respectively. All the samples were subject to the rapid thermal
annealing for 60 seconds in order to synthesize the Ge nanocrystals.
It has been reported that, at an annealing temperature of 900°C, the HfAlO
matrix is likely to re-crystallize and aid the out-diffusion of Ge atom leading to no
formation of Ge nanocrystal [7,8]. We have confirmed this by annealing Sample
A via RTA at 900°C for 60 seconds. Figure 7.8 (a) shows the XTEM image of
Sample A annealed at 900°C for 60 seconds. It reveals an absence of Ge
nanocrystal which is in agreement with the featureless Raman results. Note that
the diffraction pattern shown in Figure 7.8 (b) indicates that the HfAlO matrix had
crystallized. The grain boundaries of the HfAlO matrix can act as fast diffusion
pathways for the Ge atoms [9]. This can lead to a reduction in Ge supersaturation
within the matrix and raise the barriers to nucleation. The increase in Ge atom
diffusion is clearly shown by the SIMS data in Figure 7.9. It can be seen that
Sample A upon RTA at 800°C for 60 seconds showed a minimum reduction of
Ge content as compared to the as-prepared sample. The slight dip of Ge
concentration at the film surface is probably due to the out diffusion of Ge to
ambient during RTA. However, for the sample annealed at 900°C for 60 seconds,
- 155 -
Chapter 7
Results & Discussions IV
the depletion of Ge in the film is very significant. As a result, it is reasonable to
expect that it is harder to form nanocrystals in samples annealed at 900°C due to
the lower Ge concentration. This is in agreement with our TEM results of Figure
7.8.
Figure 7.8:
(a) Cross section transmission electron microscopy (XTEM) image
of sample A annealed at 900°C for 60 seconds; (b) The
corresponding diffraction pattern of the annealed sample A.
- 156 -
Chapter 7
Figure 7.9:
Results & Discussions IV
Secondary ion mass spectrometry (SIMS) profiles of as-prepared
and annealed (800°C and 900°C for 60 seconds) Samples A.
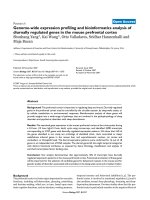
Figure 7.10 shows the hydrostatic pressure experienced by the Ge
nanocrystals embedded in HfAlO matrix. There is a Raman shift from 297 cm-1
(from the annealed sample A) to 300 cm-1 (corresponding sample with free
standing nanocrystals) as can be observed from the inset of Figure 7.10. This
suggests the nanocrystals embedded inside the HfAlO matrix experiences tensile
stress. Moreover, Figure 7.10 suggests that the Ge nanocrystals in Sample A are
under a tensile stress of about 0.62 GPa. However, for Sample C, with same
annealing process, the Ge nanocrystals experience a compressive stress of about
0.29 GPa. The tensile stress experienced by the HfAlO film upon cooling due to
the thermal mismatch between the Si substrate and HfAlO film can be
approximated as
- 157 -
Chapter 7
Results & Discussions IV
σ therm = (
Y
) film (α sub − α film )(T − Td )
1− v
(7.2)
where Y and ν are the Young’s modules and Poisson’s ratio of the film,
respectively, which had been estimated from the mechanical data of HfO2 and
Al2O3 to be ~357 GPa and ~0.25 [10-13], αsub = 3.1×10⁻⁶ K-1 and αfilm = 7.7×10⁻⁶
K-1 are the coefficients of thermal expansion of the Si substrate and the HfAlO
film [14], T and Td are the process temperature and the environmental
temperature, respectively.
The pressure acting on the nanocrystals should be different from the
pressure applied from the outside due to the difference in stiffness between the
matrix and nanocrystals material [15]. The pressure exerted on the nanocrystal,
PNC can be estimated by
PNC =
9 B (1 − v)
Pfilm
2Y + 3(1 + v) B
(7.3)
where B is the bulk modulus of the nanocrystal material (i.e. B = 75 GPa for Ge)
and Pfilm is the hydrostatic pressure experienced by the matrix [16]. From
Equations 7.2 and 7.3, we estimated that the Ge nanocrystal was under tensile
stress of ~0.86 GPa when annealed at 800°C. However, the experimental value
for Sample A (i.e. 0.62 GPa) is lower than this value. This suggests that the
nanocrystals might also experience another source of stress that is compressive in
nature.
- 158 -
Chapter 7
Results & Discussions IV
Figure 7.10: Hydrostatic Pressure (P) experienced by Ge nanocrystals
embedded in hafnium aluminium oxide matrix as a function of Ge
concentration; the inset shows a set of typical Raman spectra of
sample A annealed at 800°C for 60 seconds before and after
selective matrix removal.
Figure 7.10 shows that at higher the Ge concentration, the stress
experienced by the Ge nanocrystals becomes more compressive. To further
investigate the evolution of the stress, two sets of the TEM experiments were
done for Samples A and C annealed at 800°C for 60 seconds and Figure 7.11 (a)
and (b) are the corresponding XTEM images.
Figure 7.11 (a) shows that,
numerous nanocrystals are uniformly distributed throughout the matrix. The inset
of the Figure 7.11 (a) reveals that the nanocrystals are approximately ~5 nm in
diameter. Compare to Sample A, Figure 7.11 (b) shows that much bigger
nanocrystals are observed in the annealed Sample C with a diameter of ~10 nm.
The higher Ge content in Sample C resulted in a higher Ge supersaturation that
- 159 -
Chapter 7
Results & Discussions IV
lowers the barriers to nucleation and enhances the nucleation and growth rate of
the nanocrystals. With bigger nanocrystals, this can cause a compressive stress to
be exerted on the Ge nanocrystals, as had been observed for nanocrystals
embedded in a silicon oxide and sapphire matrices [17,18]. Therefore, for samples
with a higher Ge concentration (Sample C), it is possible for the larger Ge
nanocrystals to experience a higher amount of compressive stress. When this
compressive stress is larger than the tensile stress (due to the thermal mismatch
between the substrate and the film), it will result in a net compressive stress (i.e.
0.29 GPa) on the sample.
Figure 7.11: (a) XTEM image of sample A annealed at 800°C for 60 seconds,
the inset shows a typical high resolution transmission electron
microscopy (HRTEM) image of Ge nanocrystals embedded inside
the annealed sample A; (b) XTEM image of sample C annealed at
800°C for 60 seconds, the inset shows a typical HRTEM image of
Ge nanocrystals embedded inside the annealed sample C.
- 160 -
Chapter 7
7.5
Results & Discussions IV
Summary
It should be pointed out here that there are several reports on the
compressive stress experienced by Ge nanocrystals in silicon oxide matrix. In the
present work, we aim to tune the stress state of the nanocrystals from its intrinsic
compressive state to tensile stress by changing the annealing conditions, capping
stressor, or the dielectric matrix material. By comparing the Raman results of asprepared and free standing nanocrystal samples, we were able to quantitatively
study the hydrostatic pressure experienced by the Ge nanocrystals in different
dielectric matrices. Among the three tuning methods, we are only able to change
the stress state of the nanocrystals from compressive to tensile by introducing the
dielectric matrix to that of HfAlO. With the other two methods, one can engineer
the amount of compressive stress experienced by the nanocrystals in silicon oxide
matrix.
- 161 -
Chapter 7
Results & Discussions IV
References
[1]
L. Liu, K. L. Teo, Z. X. Shen, J. S. Sun, E. H. Ong, A. V. Kolobov and Y.
Maeda, “Raman scattering investigation of a Ge/SiO2/Si nanocrystal
system under hydrostatic pressure”, Phys. Rev. B, vol. 69, pp. 125333,
2004.
[2]
Y. Ishikawa, K. Wada, D. D. Cannon, J. F. Liu, H. C. Luan and L. C.
Kimerling, “Strain-induced band gap shrinkage in Ge grown on Si
substrate”, Appl. Phys. Lett., vol. 82, pp. 2044-2046, 2003.
[3]
L. K. Lam, S Chen and D. G. Ast, “Kinetics of nickel-induced lateral
crystallization of amorphous silicon thin-film transistors by rapid thermal
and furnace anneals”, Appl. Phys. Lett., vol. 74, pp. 1866-1868, 1999.
[4]
W. O. Adekoya, J. C. Muller, and P. Siffert, “Annealing kinetics during
rapid and classical thermal processing of a laser induced defect in n-type
silicon”, Appl. Phys. Lett., vol. 49, pp. 1429-1431, 1986.
[5]
P. Morin, E. Martinez, F. Wacquant and J. L. Regolini, “Thermal Stress
Relaxation of Plasma Enhanced Chemical Vapour Deposition Silicon
Nitride”, Mater. Res. Soc. Symp. Proc., vol. 875, pp. O14.6.1, 2005.
[6]
M. P. Hughey, and R. F. Cook, “Massive stress changes in plasmaenhanced chemical vapor deposited silicon nitride films on thermal
cycling”, Thin Solid Films, vol. 460, pp. 7-16, 2004.
[7]
N. Terasawa, K. Akimoto, Y. Mizuno, A. Ichimiya, K. Sumitani, T.
Takahashi, X. W. Zhang, H. Sugiyama, H. Kawata, T. Nabatame, and A.
- 162 -
Chapter 7
Results & Discussions IV
Toriumi, “Crystallization process of high-k gate dielectrics studied by
surface X-ray diffraction”, Appl. Surf. Sci., vol. 244, pp.16-20, 2005.
[8]
P. F. Lee, X. B. Lu, J. Y. Dai, H. L. W. Chan, E. Jelenkovic and K. Y.
Tong, “Memory effect and retention property of Ge nanocrystal embedded
Hf-aluminate high-k gate dielectric”, Nanotechnology, vol. 17, pp. 12021206, 2006.
[9]
Q. C. Zhang, N. Wu, L. K. Bera, and C. X. Zhu, “Study of Germanium
Out-Diffusion in HfO2 Gate Dielectric of MOS Device on Germanium
Substrate”, Mater. Res. Soc. Symp. Proc., vol. 829, pp. 449, 2004.
[10]
S. L. Dole, O. Hunter, and C. J. Wooge, “Elastic Properties of Monoclinic
Hafnium Oxide at Room Temperature”, J. Am. Ceram. Soc., vol. 60, pp.
488-490, 1977.
[11]
D. P. H. Hasselman, “On the Porosity Dependence of the Elastic Moduli
of Polycrystalline Refractory Materials”, J. Am. Ceram. Soc., vol. 45, pp.
452-453, 1962.
[12]
R. M. Spriggs, “Effect of Open and Closed Pores on Elastic Moduli of
Polycrystalline Ahmina”, J. Am. Ceram. Soc., vol. 45, pp. 454, 1962.
[13]
J. B. Wachtman and D. G. Lam. JR. “Young's Modulus of Various
Refractory Materials as a Function of Temperature”, J. Am. Ceram. Soc.,
vol. 47, pp. 254-260, 1959.
[14]
R. Thielsch, A. Gatto, and N. Kaiser, “Mechanical Stress and ThermalElastic Properties of Oxide Coatings for Use in the Deep-Ultraviolet
Spectral Region”, Appl. Opt., vol. 41, pp. 3211-3217, 2002.
- 163 -
Chapter 7
[15]
Results & Discussions IV
S. Takeoka, M. Fujii, S. Hayashi, and K. Yamamoto, “Size-dependent
near-infrared photoluminescence from Ge nanocrystals embedded in SiO2
matrices”, Phys. Rev. B, vol. 58, pp. 7921-7925, 1998.
[16]
M. Haselhoff, K. Reimann, and H. J. Weber, “CuCl nanocrystals in alkalihalide matrices under hydrostatic pressure”, Eur. Phys. J. B, vol. 12, pp.
147-156, 1999.
[17]
A. Wellner, V. Paillard, C. Bonafos, H. Coffin, A. Claverie, B. Schmidt,
and K. H. Heinig, “Stress measurements of germanium nanocrystals
embedded in silicon oxide”, J. Appl. Phys., vol. 94, pp. 5639-5642, 2003.
[18]
I. D. Sharp, Q. Xu, D. O. Yi, C. W. Yuan, J. W. Beeman, K. M. Yu, J. W.
Ager III, D. C. Chrzan and E. E. Haller, “Structural properties of Ge
nanocrystals embedded in sapphire”, J. Appl. Phys., vol.100, pp. 114317114324, 2006.
- 164 -