Synthesis and stress analysis of germanium nanocrystals embedded in dielectric matrices 5
Bạn đang xem bản rút gọn của tài liệu. Xem và tải ngay bản đầy đủ của tài liệu tại đây (2.39 MB, 14 trang )
Chapter 8 Results & Discussions V
- 165 -
Chapter 8
Results & Discussions V:
Effect of Substrate Geometry on the
Germanium Diffusion and the
Formation of Nanocrystals
8.1 Introduction
In Chapter 4, the influence of ambient and Ge concentration on the
formation of Ge nanocrystals have been systematically studied over a range of
annealing temperature. It was concluded that H
2
plays a very important role in
assisting the formation of the nanocrystals. In addition, there are further
explorations on the stress state of these samples in Chapter 6. The large
compressive stresses in the as-grown nanocrystals were found to be linked to
annealing time, annealing temperature, Ge concentration and annealing ambient
as well as the size, shape, density and quality of the nanocrystals.
It should be pointed out that, all the SiO
2
+ Ge films mentioned in the
pervious chapters were grown on top of flat silicon surface of (100) orientation.
However, there is a lack of comprehensive study on the Ge diffusion and
nanocrystal growth on different geometries. In this chapter, the different substrate
Chapter 8 Results & Discussions V
- 166 -
geometries will be created by the laser interference lithography and anisotropic
chemical etching. The diffusion of Ge atoms on such a substrate and the
formation of the Ge nanocrystals will be further discussed.
8.2 Fabrication of V-shape and U-shape groove by Laser Interference
Lithography
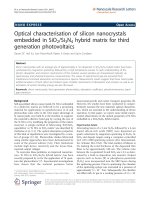
V-shape and U-shape grooves were fabricated on a p-type silicon wafer
with a (100) orientation and the processing steps are shown in Figure 8.1. Firstly,
a silicon oxide layer of 10 nm in thickness was thermally grown in O
2
ambient at
900°C (see Figure 8.1 (a)). This was followed by spin coating of a negative
photoresist layer (TSMR-iN032) of 100 nm (see Figure 8.1 (b)). Then, Laser
interference lithography (LIL) system with the Lloyd’s mirror setup and a 325 nm
helium-cadmium (He-Cd) continuous wave laser light source were used to pattern
the photoresist. A anisotropic etching of Si was carried out to selectively remove
the area of silicon after the developing and silicon oxide etching processes (see
Figure 8.1 (c)). The U-shape groove structures were fabricated by the anisotropic
etching of Si using a 30 % Potassium Hydroxide (KOH) solution at room
temperature with silicon oxide as masking layer (see Figure 8.1 (d)). It should be
noted that, as KOH is known to etch (100) plane much faster than (111) plane [1],
therefore, with sufficient etching time, a V-shape groove structure would be
created as shown in Figure 8.1 (e).
Chapter 8 Results & Discussions V
- 167 -
Figure 8.1: Cross section view of the process flow chart for the fabrication of
U-shape groove arrays on (100) silicon substrate by laser
interference lithography.
8.3 Synthesis of Ge nanocrystals in V-shape groove
The SiO
2
+ Ge thin film was firstly deposited in the V-shape groove by
the co-sputtering a SiO
2
+ Ge target in argon at room temperature. The samples
were subsequently subjected to rapid thermal annealing (RTA) at 1000°C for 60
seconds in order to synthesize the nanocrystals.
Chapter 8 Results & Discussions V
- 168 -
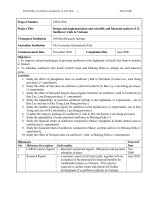
Figure 8.2 shows the cross section transmission electron microscopy
(XTEM) image of the sample after the RTA process. It can be seen from this
figure that, the film deposited on the bottom of the V-shape groove is relatively
thinner as comparing to the side wall of the groove and the mesa area. It has been
suggested that the income flux is the function of the arriving angle. The
anisotropic KOH etching of silicon has resulted in a relatively smaller arriving
angle at the bottom of the groove (i.e. 70.6°) as comparing to the one of the corner
of the mesa (i.e. 144.7°). This difference in the arriving angle will inevitably
cause the shadowing effect and results in the thicker film on the mesa and thinner
film inside the groove. It is well established that thermal annealing of Ge and
silicon oxide system will lead to Ge diffusion out from the matrix [2, 3], due to
the low solubility of Ge in the silicon oxide matrix. Therefore, during the
subsequent thermal annealing process, it was easier for the Ge atom to diffuse out
from the thin silicon oxide matrix to the ambient and to the silicon substrate and
results in no nanocrystal formation, as shown in the Figure 8.2.
Chapter 8 Results & Discussions V
- 169 -
Figure 8.2: Cross section transmission electron microscopy image of V-shape
groove sample annealed at 1000°C for 60 seconds.
In addition, although there is a relatively thicker film at the corner of the
mesa, it is interesting to observe that there are very few nanocrystals formed in
such an area. This phenomenon will be further discussed in the following sections.
8.4 Synthesis of Ge nanocrystals in U-shape groove
In order to minimize the shadowing effect and make a relatively
conformal film deposition, the KOH etching process is carefully calibrated and
the time is limited to fabricate the U-shape groove sample as shown in Figure 8.1
(d). In this section, two sets of samples were prepared. Sample A was co-sputtered
film with the U-shape groove substrate. Sample B, which is a control sample, was
co-sputtered film on Si (100) substrate.
Chapter 8 Results & Discussions V
- 170 -
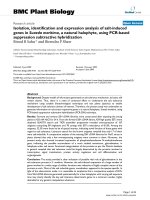
Figure 8.3 shows the Raman spectra and the Raman peak position of both
Sample A and Sample B after the rapid thermal annealing. We have shown
previously that the formation of Ge nanocrystal is kinetically limited at 700°C.
However, at 800°C, the diffusivity of the Ge atoms and the collision frequency
between the Ge atoms will increase and this should lead to a higher probability for
nucleation and hence the nanocrystal formation. This is confirmed by the Raman
band at around 300cm
-1
in Figure 8.3 (a) for both Sample A and Sample B. In
addition, the Raman peak positions of both set of samples exhibit a blue shift as
the annealing temperature increases from 800°C to 1000°C. This is probably due
to the growth of the nanocrystal at higher temperature that causes an increase in
the compressive stress experienced by the nanocrystals.
Chapter 8 Results & Discussions V
- 171 -
Figure 8.3: (a) Raman spectra of Sample A and Sample B after the RTA; (b)
summary of Raman peak position of annealed Sample A and
Sample B
It is interesting to note that, by applying the patterned substrate, the peak
position of the Raman band is located at relatively smaller wavenumber as
compared to the blanket substrate, as shown in Figure 8.3 (b). As the complete
Chapter 8 Results & Discussions V
- 172 -
miscibility of Ge and Si at high annealing temperate [3], and the extremely low
solubility of Ge in silicon oxide matrix, there will be always a driving force for
Ge to diffuse away from the matrix and towards the silicon substrate. This
diffusion will be significantly enhanced when the annealing temperature exceeds
the melting point of Ge (i.e. 937°C). By creating the U-shape groove substrate
and hence increasing the Si/silicon oxide interfaces, one enables more Ge
outdiffusion during annealing process. This outdiffusion will effectively lower the
Ge supersaturation near the interface and results in increase of formation of the
smaller nanocrystal and hence the red shift of the Raman band [4].
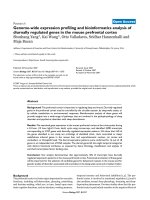
This effect of geometry (i.e. U-shape groove) on the diffusion of Ge atoms
to the Si can be further examined by the Raman results shown in Figure 8.4,
whereby there exists a weak peak between 410-440 cm
-1
for only the sample A
annealed at 1000°C for 60 seconds. The peak detected in the U-shape groove
sample has been attributed to the Si-Si phonon mode (from the substrate) in the
near vicinity of Ge atoms and this is caused by a significant diffusion of Ge atoms
to the Si substrate when annealed at 1000°C [5]. The absence of such peak for the
sample B (i.e. the blanket substrate sample) indicates the clearly the effect of
substrate geometry on the diffusion of Ge atoms when annealed at elevated
temperatures.
Chapter 8 Results & Discussions V
- 173 -
Figure 8.4: Raman spectra of Sample A and Sample B after the RTA at
1000°C for 60 seconds.
In order to confirm the existence and the distribution of the nanocrystal,
cross section transmission electron microscopy (XTEM) was done for both
Sample A and Sample B. At 800°C anneal (See Figure 8.5 and the inset),
numerous small Ge nanocrystals with the diameter of around 4nm can be seen in
the entire bulk of the film. When the annealing temperature increases to 900°C
one can observe from Figure 8.6 that, the nanocrystals grow in size and generally
adopt a spherical shape. This is in agreement with the observed blue shift of the
Raman band. The size variation of the nanocrystals is also greater as compared to
the one annealed at 800°C, indicating coarsening has taken place. The significant
increase in the diffusivity of Ge is most likely due to the fact that the annealing
temperature was near the melting point of Ge such that it enables the Ge atoms to
Chapter 8 Results & Discussions V
- 174 -
overcome kinetic limitations and enhance the nucleation and growth of the
nanocrystal.
Figure 8.5: Cross section transmission electron microscopy image of U-shape
groove sample annealed at 800°C for 60 seconds. The inset is high
resolution transmission electron microscopy image of the Ge
nanocrystals.
Figure 8.6: Cross section transmission electron microscopy image of U-shape
groove sample annealed at 900°C for 60 seconds.
Chapter 8 Results & Discussions V
- 175 -
Figures 8.7 (a) and (b) show the XTEM picture of Sample A and Sample
B annealed at 1000°C for 60 seconds. One can observe the relatively denser and
larger Ge nanocrystals from Sample B as compare to the one from Sample A. As
there are larger Si/silicon oxide interface created by the U-sharp groove, it is
reasonable to expect that, for Sample A, more Ge will diffuse into the Si substrate
from the matrix which will become most severe when the temperature reached
1000°C. The depletion of Ge will inevitably reduce Ge supersaturation, especially
near the interface, and hence results in smaller and less nanocrystal formation, as
shown in Figure 8.7 (a).
Note that, there is always a region around the corner of the mesa where no
Ge nanocrystal forms. The energy dispersive x-ray (EDX) in Figure 8.7 (a)
reveals that there is a significant Ge outdiffusion from the region. This could be
explained by the observation that the film quality of the silicon oxide film is
relatively poorer near the corner of the mesa, which is probably caused by higher
income flux due to the larger arriving angles. This low film quality will make the
Ge atom easier to diffuse out from such region. On the other hand, it has also been
suggested that the strain field will greatly affect the diffusion of the atoms [6].
Couple with the fact that the thermal expansion coefficient is very different
between Si and silicon oxide, it is reasonable to suggest that the protruded mesa
will generate a high strain field during the thermal process. This strain field as
well as the poor film quality may assist the Ge diffusion away from such area and
results in depletion of Ge and no formation of the nanocrystal.
Chapter 8 Results & Discussions V
- 176 -
Figure 8.7: Cross section transmission electron microscopy image of (a)
sample A and (b) sample B annealed at 1000°C for 60 seconds.
Chapter 8 Results & Discussions V
- 177 -
8.5 Summary
Artificial V-shape and U-shape grooves were fabricated on (100) Si
substrate via laser interference lithography. It was found that a threshold of 800°C
is necessary for the synthesis of Ge nanocrystals in the silicon oxide matrix. The
pile up of Ge nanocrystal near the Si/silicon oxide interface and the void region of
Ge nanocrystal around the corner of the mesa are suggested to be linked to the Ge
outdiffusion and strain-assisted Ge diffusion, respectively.
Chapter 8 Results & Discussions V
- 178 -
References
[1] G. T. A. Kovacs, N. I. Maluf, and K. E. Petersen, “Bulk Micromachining
of Silicon”, Proceedings of the IEEE, vol. 86, 1998.
[2] Y. Maeda, “Visible photoluminescence from nanocrystallite Ge embedded
in a glassy SiO
2
matrix: Evidence in support of the quantum-confinement
mechanism”, Phys. Rev. B, vol. 51, pp. 1658-1670, 1995
[3] K. H. Heinig, B. Schmidt, A. Markwitz, R. Grӧtzschel, M. Strobel, and S.
Oswald, “Precipitation, ripening and chemical effects during annealing of
Ge
+
implanted SiO
2
layers”, Nucl. Instrum. Meth. B, vol. 148, pp. 969-
974, 1999.
[4] J. L. Liu, G. Jin, Y. S. Tang, Y. H. Luo, K. L. Wang, and D. P. Yu,
“Optical and acoustic phonon modes in self-organized Ge quantum dot
superlattices”, Appl. Phys. Lett., vol. 76, pp. 586-588, 2000.
[5] M. I. Alonso and K. Winer, “Raman spectra of c-Si1-xGex alloys”, Phys.
Rev. B, vol. 39, pp. 10056-10062, 1989.
[6] E. Bassous, H. N. Yu, and V. Maniscalco, “Topology of Silicon Structures
with Recessed SiO
2
”, J. Electrochem. Soc., vol. 123, pp. pp. 1729-1737,
1976.