A linkage disequilibrium map of the human major histocompatibility complex in singapore chinese conserved extended haplotypes and ancestral blocks 4
Bạn đang xem bản rút gọn của tài liệu. Xem và tải ngay bản đầy đủ của tài liệu tại đây (6.29 MB, 25 trang )
Results
80
3.2 A High-Resolution Linkage Disequilibrium Map of the MHC
In the preceding section, the low-resolution, first-generation SNP map provided an
overview of the linkage disequilibrium patterns of the MHC in the Singaporean
Chinese population. From that map, the block-like structure of LD is seen and the
conserved extended haplotypes stretching across megabases were described. However
the density of the first generation SNP map limits the ability to resolve fine-scale
recombination patterns in the MHC. While only 31.5% of that map falls within a
haplotype block, the recent HapMap publication concluded that the fraction of the
genome covered by haplotype blocks is greater than 65% (International HapMap
Consortium, 2005).
In a bid to delineate the fine-scale recombination patterns, a higher resolution SNP-
variation map of the MHC in the local Chinese population was created. Rapid
improvements in SNP genotyping technology coupled with increased polymorphism
data from the International HapMap Project and MHC studies in other populations
(e.g. Miretti et al. 2005, de Bakker et al. 2006) facilitated a construction of such a
map. Having established the conserved haplotypes in the previous study, these were
taken into consideration and HLA-homozygous samples were sourced for and
included in the sample set. Genotyping these homozygous samples at a high-
resolution provides a high quality dataset to study in detail the conserved haplotypes
in the local population, and to compare these CEHs with those reported in other
populations. The data reported here will also provide a resource for studying and
understanding HLA-disease associations.
Results
81
3.2.1 High-Resolution SNP Variation Map of the MHC
For constructing a fine-scale variation map of the MHC, 2360 SNPs were genotyped
in 284 Singaporean Chinese individuals. The bulk of these samples consisted of 214
randomly selected and unrelated individuals. Of these 77 overlapped with the samples
genotyped in the previous map. Another 27 samples were taken from archived B-
lymphoblastoid cell-lines that were tested and selected for being homozygous at 2 or
3 HLA loci. These samples were representative of the CEHs identified in the previous
section. The final 41 samples were taken from 12 parental-offspring families (with at
least both parents and a child). These 12 families provided 48 phase-unambiguous
haplotypes that would be useful for improving the haplotype-reconstruction in the
unrelated individuals. A breakdown of the 284 samples is shown in Table 3.5 below.
Table 3.5: Composition of Samples Used in Constructing High
Resolution SNP Variation Map.
Sample Category
Count
Unrelated Chinese individuals
214
Chinese Nuclear Families (12 families)
41
Homozygous Cell-lines (See below for details)
29
Total
284
Haplotype Breakdown of Homozygous Samples
Count
A*0207, B*4601, DRB1*0901
8
A*3303, B*5801, DRB1*0301
5
A*0207, B*4601
3
A*1101, B*4001
3
A*1101, B*4001, DRB1*1101
2
A*1101, B*4001, DRB1*0901
2
A*0203, B*3802, DRB1*4003
1
A*1101, B*1502, DRB1*1202
1
A*1101, B*5401, DRB1*0803
1
A*2402, B*3501, DRB1*1501
1
A*1101, B*4001, DRB1*1201
1
A*1101, B*4001, DRB1*0405
1
Total
29
Results
82
SNP genotyping was once again performed using the Illumina GoldenGate assay on a
BeadArray platform. Of the 2360 SNP positions attempted, 2290 were successfully
genotyped. The overall genotyping quality was very high; the locus success rate was
over 97%, the call rate was over 99% and the reproducibility was higher than 99.99%.
Of the 284 Chinese samples genotyped, results were not obtained for 6 (all belonging
to the unrelated individuals group), giving a sample success rate of 97.9%.
For filtering out uninformative and possibly erroneously called genotypes, a series of
filters was employed. Only SNPs with at least a 5% minor allele frequency and in
Hardy-Weinberg equilibrium (using a p-value threshold of 0.001) were retained. The
minor allele frequency and heterozygosity distributions of the 2290 markers can be
seen in Figure 3.11. These charts show that the 2290 SNPs had a uniform MAF
distribution with more SNPS skewing towards the higher end of the heterozygosity
scale.
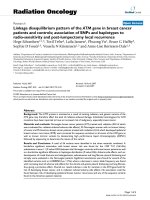
Figure 3.11 Minor Allele Frequency and Heterozygosity Distributions of the
High-Resolution MHC SNP Map
The MAF and heterozygosity distributions of the successfully genotyped SNPs are
shown in the 2 bar charts. Bars in grey indicate the proportion of markers that are
deemed non-informative and excluded in subsequent analyses. Out of the 2290
successfully genotyped SNPs, 1877 were retained in all.
Results
83
To weed out other potential genotyping errors, SNPs that had genotypes
disconcordant with pedigree structure in more than one family were also removed.
The locations of the SNPs were re-confirmed by mapping the flanking sequences used
in the design of the SNP assays back to the human genome assembly. This resulted in
the remapping of 2 SNPs within the MHC. The SNP “rs2308655” was remapped from
31,345,141 to 31,430,282 while “rs1611627” was remapped from 29,965,650 to
29,905,761. In both of these cases, the error was in the Illumina annotation, and the
error was communicated back to them.
In total 1877 markers were retained, establishing a SNP map that covers a 4.91Mb
segment of the chromosome 6p, from positions 28.97 to 33.88Mb. With an average
gap of 2.6kb (and a median of 1.6kb) between consecutive SNPs, this map is about 8
times denser than the previous one. Gap intervals range from 18bp to 71kb with over
88% of the gaps less than 5kb. There were 6 distinct gaps that span over 25kb and
these are listed in Table 3.6. Two of the largest gaps were within the hyper-variable
HLA-DRB (71kb) and RCCX loci (59kb), which exhibit MHC haplotype-specific
lengths and gene content (Dawkins et al. 1999). Individuals carrying different MHC
haplotypes may differ in the number of HLA-DRB paralogues as well as different
number of copies of the C4A/C4B genes within the RCCX locus. The other large gaps
cover segments that are densely packed with large tracks of repetitive and
transposable elements. These gaps most probably reflect difficulties in designing SNP
assays in regions with repetitive sequences and variable-length polymorphisms,
resulting in the lack of genotype information here.
Results
84
Table 3.6: Gaps Larger than 25kb in the High-Resolution SNP Map
Gap Length
(kb)
Position Along
Chromosome 6p (Mb)
Description of Loci
71.05
32.59 – 32.66
Hyper-variable DRB region
61.04
29.95 – 30.01
Gene desert densely filled with large
transposable elements
59.29
32.06 – 32.11
Hyper-variable RCCX region
55.56
33.54 – 33.59
Gene desert densely filled with large
transposable elements
43.35
31.38 – 31.43
Gene desert densely filled with large
transposable elements
27.87
33.79 – 33.82
IHPK3 gene loci interspersed with repeat
elements
The large gaps in this map coincide with regions of complex polymorphism and repeat
elements, reflecting the difficulty in designing SNP assays here.
For constructing the LD and haplotype maps of the Singaporean Chinese population,
only genotype data from the 208 unrelated individuals (6 samples failed the Illumina
genotype assays) were used. As the 29 specifically chosen homozygous cell-lines and
the 41 family-chromosomes were not a random sampling of the local Chinese
population, these were not included in constructing population LD maps. However,
genotype information from the HLA homozygous cell-lines are a valuable source of
extended haplotypes across the MHC and these were used in subsequent analysis of
HLA haplotypes and recombination breakpoints. The family-based genotypes were
used to reconstruct phase-unambiguous haplotypes that were subsequently used to
improve the haplotype phasing of the unrelated individuals (See Methods).
The allele frequencies for the SNPs in this data set were compared to those reported
for the 4 populations genotyped as part of HapMap project (International HapMap
Consortium, 2005). As expected, of the 4 populations the allele frequencies in the
Results
85
local Chinese show the tightest correlation with those reported in the Beijing Chinese
(CHB) samples (R
2
= 0.94), confirming the quality and reliability of the genotyping
data. There is also good correlation with the Japanese (JPT) allele frequencies (R
2
=
0.84), reflecting the relatively recent shared ancestry of the 2 ethnic groups. The CHB
and JPT datasets are frequently combined in HapMap data releases, but the results
here indicate that when using HapMap data for designing informative genotyping
panels in the local Chinese population, it is better to consider the CHB data only.
Figure 3.12 Comparing Allele Frequencies with HapMap Panels
Allele frequencies for the 1877 informative SNPs genotyped in the local Chinese
population were plotted against the corresponding allele frequencies from each HapMap
population and the Pearson correlation coefficient was calculated.
Clockwise from top left: CHB – Han Chinese (Beijing), JPT – Japanese (Tokyo), CEU –
Caucasian (CEPH), YRI – African (Yoruban, Nigeria). Data was obtained from HapMap
release 22.
R
2
=0.94
R
2
=0.84
R
2
=0.57
R
2
=0.45
Allele Frequencies of HapMap Population Panels
Allele Frequencies of Singaporean Chinese
Results
86
3.2.2 Estimating Coverage of Known Variation in the MHC using the high-
resolution SNP Map
The MHC is known to be the most polymorphic region in the genome and the 1877
SNPs genotyped in this study is a subset of the known variation here (Horton et al.
2008). The publicly available HapMap data offers the opportunity to address how
effective a proxy this 2.6kb-resolution SNP map is to the other known SNPs in the
Chinese population. Having established above that HapMap Han Chinese data is a
good representative for allele frequencies in the local Chinese population, this Han
Chinese data was used as a surrogate test set. Deposited Han Chinese genotypes in
release 22 of the HapMap consist of 9479 SNPs across the MHC, including the 1877
informative SNPs genotyped in this study. To test the efficacy of these 1877 in
representing the variation in the remaining HapMap Han Chinese SNPs not genotyped
in this study, allelic correlation – as determine by r
2
– between the 1877 SNPs and the
remaining HapMap SNPs were calculated from the HapMap Han Chinese genotypes.
The results are plotted in 2 bar charts in Figure 3.13. The panel of SNPs used in this
study represents most of the variation in the HapMap Han Chinese population well.
Of the 7602 HapMap SNP loci not genotyped in this study, more than half (51.1%)
are represented by a perfect proxy (r
2
= 1) within the 1877 marker set used. On
average, the 7602 SNPs were represented by a proxy SNP with a mean r
2
value of
0.84. Uninformative SNPs make up bulk of the 341 HapMap SNPs that were poorly
represented (defined as a SNP without a good proxy, or r
2
<= 0.3); 75% of these
poorly represented SNPs have a MAF of less than 5%.
Results
87
Interestingly, the distribution of the 341 poorly represented SNPs was not uniform
across the MHC, but rather there were 125 poorly represented SNPs concentrated
within a 900kb segment (32.3Mb to 33.2Mb) defined as the class II region (Horton et
al. 2004), while the remaining 216 were scattered across the other 4Mb of this SNP
map. Furthermore, the 125 poorly represented SNPs in the class II region had an
average minor allele frequency of 8%, compared to an average of 4% for the other
216. This result suggests that although the overall performance of the 1877-SNP map
in capturing HapMap variation is very high, some common variation in the class II
region is not well represented, and as r
2
values are an indicator of LD, this implies
that LD in the class II region is lower than the rest of the MHC.
Figure 3.13 Estimating Coverage of Known Variation in the MHC using the High-
Resolution SNP Map
To estimate how well the SNPs in this study represent the variation in the MHC, r
2
values
between the 1877 SNPs used and the remaining HapMap SNPs within the MHC locus, were
calculated using the genotype data of the HapMap Han Chinese population.
Panel A: Distribution of r
2
values. Half of the 7602 SNPs have a prefect proxy in the 1877 SNPs
(red portion of bar chart). Only 341 (4.5%) of the 7602 SNPs were poorly represented (defined as
r
2
< 0.3) by any of the 1877 SNPs.
Panel B: Of these poorly represented SNPs, the majority of them are present at a frequency of
less than 5% in the population, and thus not informative in the Han Chinese population.
r
2
= 1.0
Results
88
3.2.3 Fine-scale Linkage Disequilibrium Patterns of the MHC
Linkage-disequilibrium structure of the MHC was analysed in 2 ways. First, the
relationship of LD and distance was assessed by calculating D′ and r
2
between all
pairs of SNPs up to 500kb apart. This gives an overview of LD decay across the
4.9Mb SNP map. Second, as recombination is known to occur at preferred ‘hotspots’
and not uniformly across chromosomes, the detailed localised variation of LD over
kilobases was resolved by describing the location of haplotype blocks across the
MHC.
The MHC can be divided into 5 sub-regions that reflect the clustering of the different
classes of HLA genes within (Horton et al. 2004). To see if LD patterns differ across
these sub-regions, the SNP map was divided accordingly, with LD analysed in each
sub-region separately and also across the MHC as a whole. The 5 sub-regions are:
Extended class I (29.0Mb to 29.8Mb), class I (29.8Mb to 31.6Mb), class III (31.6Mb
to 32.3Mb), class II (32.3Mb to 33.2Mb) and extended class II (33.2 to 33.9Mb).
In this high-resolution variation map, all SNPs are in high LD with at least one other
SNP, as determined by D′. Of the 1877 SNPs, 1872 are in perfect LD with at least one
neighbouring SNP (D′=1) while the 5 remaining SNPs have at least a D′=0.9 with a
partner. Measured using r
2
it is also seen that SNPs alleles are highly correlated; 899
SNPs (47.9%) have a perfect r
2
with at least a partner, and over 94% (1170 SNPs)
have a SNP partner with an r
2
or at least 0.5.
By plotting average pairwise D′ and r
2
as a function of physical distance between SNP
pairs, LD is seen to decay with increasing physical distance across the MHC (Figure
Results
89
3.14). SNP pairs less than 20kb apart have an average D′ of 0.81 and pairs separated
by 500kb have an average D′ of 0.32. However, there is a noticeable difference in the
rate of decay of LD across the different sub-regions of the MHC. The class I, class III
and extended class II segments show a level of LD similar to the MHC average, but
SNP pairs in the extended class I region show a lower rate of LD decay across
distances while the opposite is seen for the class II region. Across the extended class I
region, SNP pairs less than 20kb apart have an average D′ of 0.91, and pairs separated
by 500kb have an average value of 0.36. By contrast, the corresponding values within
the Class II region are 0.78 and 0.28. This pattern of LD confirms the observation
reported in Caucasian MHC haplotypes (Miretti et al. 2005), and is in concordance
with the higher LD in the telomeric segment described in the previous section.
Figure 3.14 Pairwise Linkage Disequilibrium as a Function of Marker Distance
Average linkage disequilibrium values (r
2
– left, D’ – right) between all SNP pairs up to a
distance of 500kb apart are shown as a function of physical distance. Greater physical
distance affords more opportunity for recombination, hence the general trend of LD
decreasing with increasing marker distance. There is a noticeable spread between LD values
in the Extended Class I (blue curves) versus Class II (green curves) segments.
Results
90
However these average pairwise LD values mask the local variations seen on a finer-
scale. Widely spaced SNPs up to 500kb apart can be found in perfect LD (D′=1),
while some closely spaced markers less than 1kb apart exist in complete equilibrium
(D′=0). Linkage-disequilibrium distribution across this high-resolution SNP map can
be construed as consecutive runs of SNPs in strong LD interrupted by a sudden
breakdown of LD between closely spaced markers, similar to the observations of a
“block-like” structure of LD described in other parts of the genome (Daly et al, 2001,
Dawson et al. 2002, International HapMap Consortium 2005).
To map the structure of the haplotype blocks seen in the local Chinese population,
block boundaries were determined using a well-established criteria (Gabriel et al.
2002) that defines a consecutive run of SNPs with significantly high pairwise D′ as a
block. In contrast with the previous first generation map, this denser SNP map enables
more haplotype blocks to be uncovered. Most of the SNPs on this map (1712 out of
1877, or 91%) lie within defined haplotype blocks and a total of 203 haplotype blocks
can be identified across the MHC, covering 3.7Mb of this 4.9Mb map (75.25%). This
is similar to the 202 blocks covering 82% of the MHC region reported in a LD map of
a Caucasian population (Miretti et al. 2005). The haplotype block coverage also falls
into the range of the genome-wide average (67-87%) reported in the HapMap project
(International HapMap Consortium, 2005).
The haplotype blocks have an average size of 18.2kb and range from 70bp to 180kb.
As seen in the previous lower-resolution SNP map, 2 of the biggest blocks with sizes
of 180kb and 100kb lay within the extended class I region. This indicates that the
blocks identified in the lower-resolution SNP map are robust. There is an average of
Results
91
7.1 haplotypes per block and this is very similar to that reported in the Caucasian
population (18kb average, 6.4 haplotypes per block). Haplotype blocks are also
segments of low diversity – within a haplotype block, 95% of the total variation in the
local Chinese population is represented by an average of 4.4 haplotypes. Furthermore,
each haplotype block carries an average of 3.9 common haplotypes (present in greater
than 5% of the population).
The characteristics of the haplotype blocks seen at a MHC-wide average, as well as
when broken down into the 5 sub-regions of the MHC, are detailed in Figure 3.15.
The number of haplotype blocks (expressed as a ratio to physical length to account for
the different sizes of the MHC sub-regions) was greatest in the class II region with
over 60 blocks per Mb. By contrast there are 24 blocks per Mb in the extended class I
segment, while the MHC average is 41 blocks per Mb. Haplotype blocks in the
extended class I region are larger and have higher coverage, averaging 37.1kb in
length and extending across 88% of the region. Class II region haplotype blocks are
almost a third smaller (12.5kb) and cover only 76% of underlying DNA sequence.
This shorter, more fragmented haplotype structure of the class II region appear
consistent with the greater number of discovered recombination hotspots there
(Cullen et al. 1997, Jeffreys et al. 2001, Cullen et al. 2002). The haplotype block
characteristics mirror the pattern of stronger and longer LD in the extended class I
region, and weaker LD in the class II segment. The stark contrast of the haplotype
blocks within these 2 sub-regions is clearly illustrated in the LD heatmap in Figure
3.16.
Results
92
Figure 3.15 Characteristics of Haplotype Blocks in the MHC
The haplotype block structure of the MHC is described in each of the 5 sub-regions:
extended class I, class I, class III, class II and extended class II as defined in a recent
review (Horton et al. 2004).
The sub-regions exhibit distinct variation in haplotype blocks characteristics: fewer but
longer blocks with higher coverage in the extended class I, and more but shorter blocks
with lower coverage in the class II region. However, haplotype block diversity is similar
throughout the MHC.
Results
93
A. LD heat map of the Extended Class I region (positions 28970148 – 29769435 of chromosome 6p, 799kb)
B. LD heat map of the Class II region (positions 32320211– 33238408 of chromosome 6p, 918kb)
Figure 3.16 LD Heatmaps of the Extended Class I and Class II Regions
Linkage disequilibrium heatmap of the extended Class I (Panel A) and Class II (Panel B) regions, generated using the software Haploview
(Barrett et al. 2005), is shown in this figure
Level of pairwise LD is displayed using a colour scale, ranging from dark red regions indicating D´ >=0.9 to darker blue regions indicating
D´ <=0.1. Triangles with black borders are defined haplotype blocks. This heatmap clearly illustrates the fragmented and shorter haplotype
blocks in the Class II region, distinct from the contiguous and longer blocks in the extended Class I region.
Results
94
Earlier reported scans of diversity and LD across the human genome (Daly et al.
2001, Patil et al. 2001, Dawson et al. 2002) had predicted blocks of limited diversity
in which a small number of common haplotypes per block represents the majority of
the variation in a population. Even with higher-resolution maps, such as that used in
this study and other recent publications (Miretti et al. 2005, International HapMap
Consortium 2005), this trend is still observed. Despite the difference in block lengths
and counts between the different sub-regions of the MHC, the diversity of the
haplotype blocks remains consistent at around 4 common haplotypes per block. 95%
of the diversity in the population is represented by slightly more than 4 haplotypes per
block. Hence while homologous recombination shuffles longer haplotypes into
smaller and smaller blocks, the diversity background is still maintained and reflects
descent from those ancestral haplotypes (Patil et al. 2001). This should be taken into
consideration when studying disease associations in relation to conserved haplotypes
such as those seen in the MHC, and will be covered in greater detail in the following
sections of this thesis.
The detailed LD across the entire 4.9Mb region in this study is presented in a series of
panels in Figure 3.17. The locations of haplotype blocks are demarcated in the
diagrams and agree nicely with the variation of LD plotted as averaged D´ across
sliding windows. The HapMap project predicted 39 recombination hotspots across the
region (International HapMap Consortium 2005) and all of these hotspots fall outside
the boundaries of haplotype blocks in this study. Additionally, 6 precisely determined
recombination hotspots mapped within the MHC Class II region using sperm
recombinant mapping techniques (Jeffreys et al. 2000, 2001) also lie outside of
haplotype block boundaries in this study.
Results
95
Figure 3.17 High-Resolution LD and Haplotype Block Structure of the MHC
Panel A – Extended Class I region
The tracks from top to bottom:
SNP density of the SNP map across the segment (number of SNPs per 50kb), the location of tag SNPs reported in this study, location of expressed genes
(Wilming et al. 2007), haplotype blocks represented by red rectangles and averaged D´ across 10kb sliding windows
The locations of recombination hotspots reported in the HapMap project are indicated as green arrows, all falling outside of block boundaries.
There is a consistent agreement between the boundaries of haplotype blocks, locations of HapMap hotspots, and sharp decreases in D’.
Results
96
Figure 3.17 High-Resolution LD and Haplotype Block Structure of the MHC
Panel B –Class I region
The tracks from top to bottom:
SNP density of the SNP map across the segment (number of SNPs per 50kb), the location of tag SNPs reported in this study, location of expressed genes (Wilming
et al. 2007), haplotype blocks represented by red rectangles and averaged D´ across 10kb sliding windows
The locations of recombination hotspots reported in the HapMap project are indicated as green arrows, all falling outside of block boundaries.
There is a consistent agreement between the boundaries of haplotype blocks, locations of HapMap hotspots, sharp decreases in D’.
Results
97
Figure 3.17 High-Resolution LD and Haplotype Block Structure of the MHC
Panel C –Class III region
The tracks from top to bottom:
SNP density of the SNP map across the segment (number of SNPs per 50kb), the location of tag SNPs reported in this study, location of
expressed genes (Wilming et al. 2007), haplotype blocks represented by red rectangles and averaged D´ across 10kb sliding windows
The locations of recombination hotspots reported in the HapMap project are indicated as green arrows, all falling outside of block boundaries.
There is a consistent agreement between the boundaries of haplotype blocks, locations of HapMap hotspots, sharp decreases in D’.
Results
98
Figure 3.17 High-Resolution LD and Haplotype Block Structure of the MHC
Panel D – Class II region
The tracks from top to bottom:
SNP density of the SNP map across the segment (number of SNPs per 50kb), the location of tag SNPs reported in this study, location of expressed genes (Wilming et al.
2007), haplotype blocks represented by red rectangles and averaged D´ across 10kb sliding windows
The precise locations of 6 experimentally defined recombination hotspots described by Jeffreys et al. are depicted in red arrows. The locations of recombination
hotspots reported in the HapMap project are indicated as green arrows, all falling outside of block boundaries.
There is a consistent agreement between the boundaries of haplotype blocks, locations of HapMap hotspots, locations of sperm recombination hotspots and sharp
decreases in D’.
Results
99
Figure 3.17 High-Resolution LD and Haplotype Block Structure of the MHC
Panel E – Extended Class II region
The tracks from top to bottom:
SNP density of the SNP map across the segment (number of SNPs per 50kb), the location of tag SNPs reported in this study, location
of expressed genes (Wilming et al. 2007), haplotype blocks represented by red rectangles and averaged D´ across 10kb sliding
windows
The locations of recombination hotspots reported in the HapMap project are indicated as green arrows, all falling outside of block
boundaries.
There is a consistent agreement between the boundaries of haplotype blocks, locations of HapMap hotspots, sharp decreases in D’.
Results
100
3.2.4 Generation of Haplotype Tagging SNPs of the MHC
As mentioned in the previous section, the SNPs on this map are highly correlated with
almost half of the 1877 SNPs perfectly correlated with at least another partner (r
2
=
1). This implies that there is a certain amount of redundancy in this SNP map and it is
possible to derive a subset of this 1877 that will be sufficient in describing the
variation of the MHC in the Singaporean Chinese. This subset of SNPs can be thought
of as tag SNPs, and the objective here is to identify SNPs (tags) such that knowing the
genotype of these tags is sufficient to accurately predict the genotypes of the
remaining SNPs (the tests) (Daly et al. 2001, Johnson et al. 2001). Genotyping
regions ‘tagged’ by tag SNPs is hence redundant, reducing the number of markers that
need to be genotyped in association studies, improving power and efficiency (Johnson
et al. 2001, de Bakker et al. 2005).
By definition, tag SNPs are markers not only in high LD with neighbouring ones, but
also are highly correlated such that they can act as surrogates. Therefore to select tag
SNPs, r
2
values between SNP pairs were used, with the goal of choosing the minimal
set of tags such that all test SNPs can be captured by a tag with an r
2
or at least 0.8.
Using the program Tagger (de Bakker et al. 2005), 710 tags were generated for the
1877 SNPs in this map. These tags capture all test SNPs with a mean r
2
of 0.96 and
35% of test SNPS are captured with a perfect proxy (r
2
=1). The positions of the tag
SNPs are also indicated in Figure 3.17 in the previous section.
The distribution of the tag SNPs identified in each of the 5 sub-regions of the MHC is
detailed in Table 3.7. The number of tag SNPs needed is also expressed as a ratio to
the size of each sub-region, and this provides an indicator of the efficiency of the
Results
101
tagging across the MHC. This efficiency is seen to reflect the LD patterns of each
sub-regions; the extended class I region which has the strongest LD requires only 83
tag SNPs per Mb to capture the variation there but in contrast, the class II region
requires a nearly 3 times increase in the number of tag SNPs per Mb. Put another
way, there is a higher amount of redundancy in the extended class I region of the SNP
map. This also indicates that for cost efficiency in future genotyping studies of the
MHC, the SNP map can be re-designed with less SNPs genotyped in the extended
class I region without compromising performance, while more tag SNPs should be
placed in the class II region to improve the power of the association study.
Table 3.7: Distribution of Tag SNPs across the MHC
Total Number
of SNPs
Number of tag
SNPs
Size of Region
(Mb)
No. of tags /
Mb
Ext. Class I
257
66
0.80
83
Class I
733
259
1.81
143
Class III
242
116
0.73
159
Class II
505
204
0.92
222
Ext Class II
140
65
0.64
102
MHC
1877
710
4.90
145
The number of tag SNPs needed to capture the variation in each sub-region of the MHC is shown in
this table. The number of tag SNPs per Mb is also indicated and provides an indication of the tagging
efficiency in each sub-region.
On average, the class II region has the lowest tagging efficiency, with more tag SNPs needed per Mb.
Of the 710 tag SNPs more than half (388) are singletons, which is to say these are
tags SNPs that are not correlated with any other SNP, but only serve to ‘tag’
themselves. A large number of singleton tags lie in regions of low LD and outside of
haplotype blocks, 27.8% (108 out of 388) of singleton tags lie outside of a defined
haplotype block compared to only 4% of non-singleton tags (13 out of 322). With
detailed haplotype blocks structures such as the one described in this study, future
SNP maps for disease association studies could also be efficiently designed for
Results
102
decreased coverage in known haplotype blocks and increased density in regions of
low LD.
3.2.5 Transferability of Tag SNPs from HapMap Populations
An important consideration of tag SNPs design is its relevance to other populations,
especially those with a different base composition of ethnic groups. One of the stated
goals of the human HapMap project was to develop a set of tag SNPs that could guide
the selection of SNPs and reduce genotyping redundancy for genome association
studies (International HapMap Consortium 2005). These tag SNPs should not only be
valid for the 4 populations in the HapMap project, but should ideally be transferable
to other global populations. The SNPs in this study overlaps with that genotyped in
the HapMap samples and afforded an opportunity to test this transferability.
Tag SNP transferability may be defined as such: If a set of tags was selected in a
reference population to efficiently act as proxies for untagged SNPs, how well would
this set of tags capture the untagged variation in other populations?
To investigate this transferability, the genotypes for the complete set of 1877 SNPs
markers used in this study were extracted from each of the 4 HapMap reference
population panels (Beijing-Han Chinese (CHB), Tokyo-Japanese (JPT), CEPH-
Caucasians (CEU) and Nigeria/Yoruba-Africans (YRI)). Working with each
population panel separately, tag SNPs were generated with the same set of criteria:
selecting the minimal set of tags such that all test SNPs can be captured by a tag with
an r
2
or at least 0.8. Tag SNPs were also generated by treating the East Asian panels
as a single population (Chinese and Japanese) as well as all 4 panels as a whole. The
Results
103
transferability of each set of tag SNPs was assessed by testing how well the tags
capture the variation of the 1877 SNPs in the Singaporean Chinese population. The
results are tabulated in Table 3.8 below.
Table 3.8 Transferability of HapMap tag SNPs
HapMap
Panel
*
Number of
tag SNPs
Mean
maximum r
2
Percentage of non-
tag SNPs captured
with r
2
>= 0.8
Percentage of non-
tag SNPs with
perfect tag proxy
(r
2
=1)
CHB
790
0.92
90%
34%
JPT
632
0.84
70%
23%
JPT+CHB
780
0.91
87%
33%
YRI
872
0.86
74%
34%
CEU
806
0.87
76%
33%
HAPMAP
1034
0.93
88%
41%
SG Chinese
710
0.96
100%
35%
*
CHB: Han Chinese, JPT: Japanese, YRI: Yoruba-African, CEU: Caucasian CEPH
Of the 4 HapMap population panels, tag SNPs generated using the Han Chinese
clearly outperforms any of the other 3 populations, with transferability similar to tag
SNPs generated in the local population. This again reiterates the tight correlation in
allele frequencies between the Beijing and local Chinese populations. The Japanese
population is more homogenous then other populations and therefore the number of
tag SNPs defined using a Japanese population is smaller than the rest. However, the
performance of Japanese tag SNPs in the local Chinese population is clearly the
worst. Japanese tag SNPs captured the least number of SNPs with an r
2
of 0.8, had a
lowest average r
2
of captured SNPs, as well as lowest number of perfect proxies. As
the number of Japanese and Chinese samples typed in the HapMap project is smaller
than those of the African and Caucasian samples, the HapMap routinely groups the 2
Results
104
populations together as a combined “East Asian” population. The transferability tests
show that no advantage is gained by grouping the 2 East Asian population samples
together, and may in fact lead to a poorer performance in terms of average r
2
and
number of perfect proxy tags.
However, grouping the entire set of HapMap population panels together may be
beneficial. Since this combined set would include all the variation seen in the 4
populations, tags generated from it will all encompassing. As a result, the
transferability of this tag of SNPs has the best performance, in terms of the number of
perfect proxies and average r
2
values. This however comes with a price of having a
larger set of tag SNPs and increased genotyping requirements.