Tiểu luận môn hệ hỗ trợ quyết định OLAP CUBE OVERVIEW AND CASE STUDY
Bạn đang xem bản rút gọn của tài liệu. Xem và tải ngay bản đầy đủ của tài liệu tại đây (774.95 KB, 26 trang )
NATIONAL UNIVERSITY OF HO CHI MINH CITY
UNIVERSITY OF INFORMATION TECHNOLOGY (UIT)
DECISION MAKING SYSTEM
SEMINAR TOPIC
OLAP & USING SSAS TO ANALYZE OLAP CUBE IN
RETAIL DATABASE
GROUP 9
1. MAI HOÀNG THẮNG - CH1401032
2. TRẦN THANH TRÂM – CH1401038
3. BÙI BÁ NGUYÊN – CH1401029
4. NGUYỄN THỊ THÙY LINH - CH1401027
Advisor: Associate Professor Do Phuc
HCM, 07/2015
OLAP CUBE OVERVIEW AND CASE STUDY
CONTENTS
INTRODUCTION
In the past decade, Microsoft SQL Server Analysis Services established itself as one
of the leaders in the Business Intelligences systems market. Analysis Services helps
managers, employees, customers, and partners to make more informed business decisions
by enabling them to analyze information accumulated during a company’s day-to-day
operations.
Success of Analysis Services and the entire Business Intelligence market was
predefined by incredible growth of amounts of data accumulated as a result of everyday
functioning of a large number of companies. Today it’s hard to imagine a business or an
organization that doesn’t use an online transaction processing (OLTP) system. OLTP
systems provide means to highly efficient execution of a large number of small
transactions and reliable access to data stored in the result of the transactions.
It’s easy to see why analysis of data has become so important to the management of
modern enterprises. However, OLTP systems are not well suited to analyzing data. In the
past decades, an entire new market has emerged for systems that can provide reliable and
fast access for analyzing very large amounts of data: online analytical processing
(OLAP). OLAP enables managers, executives, and analysts to gain insight into data using
fast, interactive, and consistent interfaces to a wide variety of possible views of
information.
Because OLAP systems are designed specifically for analysis, they typically don’t
need to both read and write data. All that is necessary for analysis is reading data. With
this emphasis on reading only, OLAP systems enjoy a speed advantage over their OLTP
cousins. However, a read-only approach to the database architecture is not the only
distinction of the OLAP solution.
In scope of studying Decision Support System at Computer Science Department,
University of Information Technology, Associate Professor Do Phuc brings much
helpful knowledge on decision support system, specially on using OLAP technique to
make decision. Number Four group would like to thank a lot to this support from Mr
Phuc, then our group has some research and do presentation on OLAP. Here are some
main ideas will be in this document:
• Chapter 1 – Olap Overview
• Chapter 2 - Olap With Sql Server Analysis Service (SSAS)
• Chapter 3 - Olap Case Study - Decision Making With Shopping Malls
Number Four group believes that these information will give readers more details of
OLAP and how to use OLAP with SSAS through a sample case study.
NUMBER FOUR GROUP 2
OLAP CUBE OVERVIEW AND CASE STUDY
CHAPER 1 - OLAP OVERVIEW
1.1. OLAP Definition
OLAP (online analytical processing) is computer processing that enables a user to
easily and selectively extract and view data from different points of view. For example, a
user can request that data be analyzed to display a spreadsheet showing all of a
company's beach ball products sold in Florida in the month of July, compare revenue
figures with those for the same products in September, and then see a comparison of
other product sales in Florida in the same time period. To facilitate this kind of analysis,
OLAP data is stored in a multidimensional database. Whereas a relational database can be
thought of as two-dimensional, a multidimensional database considers each data attribute
(such as product, geographic sales region, and time period) as a separate "dimension."
OLAP software can locate the intersection of dimensions (all products sold in the Eastern
region above a certain price during a certain time period) and display them. Attributes
such as time periods can be broken down into sub-attributes.
OLAP is an acronym, standing for "On-Line Analytical Processing". This, in itself,
does not provide a very accurate description of OLAP, but it does distinguish it from
OLTP or "On-Line Transactional Processing".
Difference between OLAP and OLTP
Online Transaction Processing (OLTP) Online Analytical Processing (OLAP)
Designed to support Daily DML Operations
of your application
Designed to hold historical data for analyses
and forecast business needs
Holds daily Latest Transactional Data
related to your application
Data is consistent up to the last update that
occurred in your Cube
Data stored in normalized format Data stored in denormalized format
Databases size is usually around 100 MB to
100 GB
Databases size is usually around 100 GB to a
few TB
Used by normal users
Used by users who are associated with the
decision making process, e.g., Managers,
CEO.
CPU, RAM, HDD space requirement is
less.
CPU, RAM, HDD space requirement is
higher.
Query response may be slower if
the amount of data is very large, it can
Query Response is quicker, management can
do Trend analysis on their data easily and
NUMBER FOUR GROUP 3
OLAP CUBE OVERVIEW AND CASE STUDY
Online Transaction Processing (OLTP) Online Analytical Processing (OLAP)
impact the reporting performance. generate quicker reports.
T-SQL language used for query MDX is used for querying on OLAP Cube
1.2. Why do we need OLAP
When first investigating OLAP, it is easy to question the need for it. If an end user
requires high-level information about their company, then that information can always be
derived from the underlying transactional data, hence we can achieve every requirement
with an OLTP application. Were this true, OLAP would not have become the important
topic that it is today. OLAP exists & continues to expand in usage because there are
limitations with the OLTP approach. The limits of OLTP applications are seen in three
areas.
1.2.1. Increasing data storage
The trend towards companies storing more & more data about their business shows no
sign of stopping. Retrieving many thousands of records for immediate analysis is a time
and resource consuming process, particularly when many users are using an application
at the same time. Database engines that can quickly retrieve a few thousand records for
half-a-dozen users struggle when forced to return the results of large queries to a
thousand concurrent users.
Caching frequently requested data in temporary tables & data stores can relieve some
of the symptoms, but only goes part of the way to solving the problem, particularly if
each user requires a slightly different set of data.
In a modern data warehouse where the required data might be spread across multiple
tables, the complexity of the query may also cause time delays & require more system
resources which means more money must be spent on database servers in order to keep
up with user demands.
1.2.2. Data versus Information
Business users need both data and information. Users who make business decisions
based on events that are happening need the information contained within their
company's data. A stock controller in a superstore might want the full list of all goods
sold in order to check up on stock levels, but the manager might only want to know the
amount of fruit & frozen goods being sold. Even more useful would be the trend of
frozen good sales over the last three months.
NUMBER FOUR GROUP 4
OLAP CUBE OVERVIEW AND CASE STUDY
In order to answer the question "How many frozen goods did we sell today?", an
OLTP application must retrieve all of the frozen good sales for the day and then count
them, presenting only the summarized information to the end-user. To make a comparison
over three months, this procedure must be repeated for multiple days. Multiply the
problem by several hundred stores, so that the managing director can see how the whole
company is performing and it is easy to see that the problem requires considerable
amounts of processing power to provide answers within the few seconds that a business
user would be prepared to wait.
Database engines were not primarily designed to retrieve groups of records and then
sum them together mathematically and they tend not to perform well when asked to do
so. An OLTP application would always be able to provide the answers, but not in the
typical few-seconds response times demanded by users.
Caching results doesn't help here either, because in order to be effective, every
possible aggregation must be cached, or the benefit won't always be realized. Caching on
this scale would require enormous sets of temporary tables and enormous amounts of
disk space to store them.
1.2.3. Data layout
The relational database model was designed for transactional processing and is not
always the best way to store data when attempting to answer business questions such as
"Sales of computers by region" or "Volume of credit-card transactions by month". These
types of queries require vast amounts of data to be retrieved & aggregated on-demand,
something that will require time & system resources to achieve.
More significantly, related queries such as "Product sales broken down by region" and
"Regions broken down by product sales" require separate queries to be performed on the
same data set.
The answer to the limitations of OLTP is not to spend more & more money on bigger
& faster databases, but to use a different approach altogether to the problem and that
approach is OLAP.
OLAP applications store data in a different way from the traditional relational model,
allowing them to work with data sets designed to serve greater numbers of users in
parallel. Unlike databases, OLAP data stores are designed to work with aggregated data,
allowing them to quickly answer high-level questions about a company's data whilst still
allowing users to access the original transactional data when required.
1.3. OLAP Cube
The cube is the conceptual design for the data store at the center of all OLAP
applications. Although the underlying data might be stored using a number of different
NUMBER FOUR GROUP 5
OLAP CUBE OVERVIEW AND CASE STUDY
methods, the cube is the logical design by which the data is referenced. The easiest way
to explain a cube is to compare storing data in a cube with storing it in a database table.
A relational table containing sale records
An OLAP cube is a technology that stores data in an optimized way to provide
a quick response to various types of complex queries by using dimensions and measures.
Most cubes store pre-aggregates of the measures with its special storage structure to
provide quick response to queries.
The data are shown as a two-dimentional cube.
The two-dimensional cube reoriented.
NUMBER FOUR GROUP 6
OLAP CUBE OVERVIEW AND CASE STUDY
SSRS Reports and Excel Power Pivot is used as front end for Reporting and data
analysis with SSAS (SQL Server Analysis Services) OLAP Cube.
SSAS (SQL Server Analysis Services) is Microsoft BI Tool for creating Online
Analytical Processing and data mining functionality.
BIDS (Business Intelligence Development Studio) provides environment for
developing your OLAP Cube and Deploy on SQL Server.
BIDS (Business Intelligence Development Studio) comes with Microsoft SQL Server
2005, 2008 (e.g. Developer, Enterprise Edition) .
We have to choose OLAP Cube when performance is a key factor, the key decision
makers of the company can ask for statistics from the data anytime from your huge
database.
We can perform various types of analysis on data stored in Cube, it is also possible to
create data mining structure on this data which can be helpful in forecasting, prediction.
In our case, data warehouse is used as a source of data to Cube in BIDS. Once Cube
gets ready with data, users can run queries on Cube created in SSAS. SSRS Reports and
Excel Pivoting/Power Pivot can use OLAP Cube as source of data instead of OLTP
database to get performance for resolving Complex Queries.
SSRS Reports, Excel Power Pivot can be used for visualization/analysis of data from
cube.
1.4. History Of OLAP
The term OLAP was created as a slight modification of the traditional database term
OLTP (Online Transaction Processing).
Databases configured for OLAP employ a multidimensional data model, allowing for
complex analytical and ad-hoc queries with a rapid execution time.
They borrow aspects of navigational databases and hierarchical databases that are
speedier than their relational kind.
Nigel Pendse has suggested that an alternative and perhaps more descriptive term to
describe the concept of OLAP is Fast Analysis of Shared Multidimensional
Information (FASMI).
The first product that performed OLAP queries was Express, which was released in
1970 (and acquired by Oracle in 1995 from Information Resources). However, the
term did not appear until 1993 when it was coined by Ted Codd, who has been described
as "the father of the relational database".
NUMBER FOUR GROUP 7
OLAP CUBE OVERVIEW AND CASE STUDY
1.5. OLAP Operations
The user-initiated process of navigating by calling for page displays interactively,
through the specification of slices via rotations and drill down/up is sometimes called
"slice and dice".
a) Slice: A slice is a subset of a multi-dimensional array corresponding to a single
value for one or more members of the dimensions not in the subset.
OLAP Slicing
b) Dice: The dice operation is a slice on more than two dimensions of a data cube (or
more than two consecutive slices).
OLAP Dicing
c) Drill Down/Up: Drilling down or up is a specific analytical technique whereby
the user navigates among levels of data ranging from the most summarized (up) to
the most detailed (down).
NUMBER FOUR GROUP 8
OLAP CUBE OVERVIEW AND CASE STUDY
OLAP Drill-up and drill-down
d) Roll-up: A roll-up involves computing all of the data relationships for one or
more dimensions. To do this, a computational relationship or formula might be
defined.
e) Pivot: To change the dimensional orientation of a report or page display.
The output of an OLAP query is typically displayed in a matrix (or pivot) format. The
dimensions form the row and column of the matrix; the measures, the values.
OLAP pivoting
1.6. Data warehouse and OLAP
1.6.1. OLAP Solution components
In a typical OLAP implementation, the solution architecture has the following
components: Data sources, ETL, Data Warehouse and OLAP. In this section, we briefly
describe each of these components.
NUMBER FOUR GROUP 9
OLAP CUBE OVERVIEW AND CASE STUDY
a) Data Sources
When it comes to data sources used in data warehouse and OLAP solutions, data in
any format and structure is possible: RDBMS, legacy DBMS, Flat files, XML, Web
Service, etc.
b) Extraction, Transformation and Load (ETL)
ETL is a process that reads data, transforms it to multidimensional format and loads it
to data warehouse. While ETL can be implemented by basic programming, there are
various ETL-specific tools developed by different vendors. Using a specific ETL tool
provides faster development, easier maintenance and improved Meta data management.
c) Data Warehouse
A data Warehouse is the repository of data in multidimensional format. (Inmon 1995)
Data warehouses are intended to help data reporting and analysis. A data warehouse is
usually specific to a subject, like Marketing. If it covers different subjects, it is easy to
find all data items related to one subject together. Hence, a data warehouse is Subject
Oriented. A data warehouse is Non-Volatile; after data entered into the warehouse, data is
not supposed to change. Data in a data warehouse is integrated from all data sources that
contain data items related to the subject(s) that is (are) covered in data warehouse. In
order to be able to analyze trends over time, historical data should be collected in a data
warehouse. This is in contrast with Online Transaction Processing (OLTP) databases and
is the Time Invariant characteristic of the data warehouse.
d) OLAP
Data in a data warehouse is still in relational format, not able to meet performance and
ease of use requirements of complex analytical queries that are multidimensional in their
nature; OLAP provides data in so called OLAP cubes, designed specifically to improve
query performance and ease of use when analytical queries are posed. As this is the focus
of this report, the rest of this document covers OLAP concepts in SQL Server Analysis
Services (SSAS). SSAS is one of Microsoft SQL Server 2008 components that provide
OLAP support together with data mining functionalities.
1.6.2. Architecture and design options
There are several possible architectures to choose when implementing data warehouse
and OLAP solutions. The architecture choice is completely dependent on the
requirements. For example, it is possible in some cases to implement OLAP directly on
top of operational OLTP databases. In practice, most of the OLAP solutions rely on a data
warehouse in star schema.
NUMBER FOUR GROUP 10
OLAP CUBE OVERVIEW AND CASE STUDY
Data warehouse Architecture
Data warehouse Architecture includes tools for extracting data from multiple
operational databases and external sources; for cleaning, transforming and integrating
this data; for loading data into the data warehouse; and for periodically refreshing the
warehouse to reflect updates at the sources and to purge data from the warehouse,
perhaps onto slower archival storage. In addition to the main warehouse, there may be
several departmental data marts. Data in the warehouse and data marts is stored and
managed by one or more warehouse servers, which present multidimensional views of
data to a variety of frontend tools: query tools, report writers, analysis tools, and data
mining tools. Finally, there is a repository for storing and managing metadata, and tools
for monitoring and administering the warehousing system.
The warehouse may be distributed for load balancing, scalability , and higher
availability. In such a distributed architecture, the metadata repository is usually
replicated with each fragment of the warehouse, and the entire warehouse is administered
centrally . An alternative architecture, implemented for expediency when it may be too
expensive to construct a single logically integrated enterprise warehouse, is a federation
of warehouses or data marts, each with its own repository and decentralized
administration.
Designing and rolling out a data warehouse is a complex process, consisting of the
following activities:
• Define the architecture, do capacity planning, and select
• the storage servers, database and OLAP servers, and tools.
• Integrate the servers, storage, and client tools.
• Design the warehouse schema and views.
• Define the physical warehouse organization, data placement, partitioning,
and access methods.
• Connect the sources using gateways, ODBC drivers, or other wrappers.
NUMBER FOUR GROUP 11
OLAP CUBE OVERVIEW AND CASE STUDY
• Design and implement scripts for data extraction, cleaning, transformation,
load, and refresh.
• Populate the repository with the schema and view definitions, scripts, and
other metadata.
• Design and implement end-user applications.
• Roll out the warehouse and applications.
1.7. Type Of OLAP
1.7.1. Relational OLAP(ROLAP)
• Extended RDBMS with multidimensional data mapping to standard relational
operation. ROLAP provides functionality by using relational databases and
relational query tools to store and analyze multidimensional data.
• Build on existing relational technologies and represent extension to all those
companies who already used RDBMS.
• Data access language and query performance are optimized for multidimensional
data.
• ROLAP supports for very large databases.
1.7.2. Multidimensional OLAP(MOLAP)
• MOLAP implemented operation in multidimensional data. MOLAP extends
OLAP functionality to MDBMS.
• Best suited to manage, store and analyze multidimensional data. Proprietary
techniques used in MDBMS.
• MDBMS and users visualize the stored data as a 3-Dimensional Cube i.e Data
Cube.
• MOLAP Databases are known to be much faster than the ROLAP counter parts.
• Data cubes are held in memory called “Cube Cache”
1.7.3. Hybrid Online Analytical Processing (HOLAP)
HOLAP is a hybrid approach to the solution where the aggregated totals are stored in
a multidimensional database while the detail data is stored in the relational database. This
is the balance between the data efficiency of the ROLAP model and the performance of
the MOLAP model.
1.8. OLAP Application
The Online Analytical Processing framework allows users to do things that would not
be possible or would take a lot of time with the database offering only a two-dimensional
correlational analysis.
OLAPApplication takes data that is originally in different formats and brings this data
together in a way that is more user-friendly, efficient, and helpful. The basic operating
NUMBER FOUR GROUP 12
OLAP CUBE OVERVIEW AND CASE STUDY
principles of OLAP-based web development are data consolidation or roll up, data
drilling down, and what is rather gastronomically called slicing and dicing of data.
The different approaches allow the users to aggregate some data while going into the
most minute details on a different data set and observing a third data set from various
viewpoints at the same time. The complex mathematical and logical algorithms make an
OLAP web application indispensable in any situation where large volumes of data are
involved.
1.9. Advantages and Disadvantages
1.9.1. Advantages
a) Offer quicker analysis
An important advantage of OLAP cubes is that they enhance the speed that an
organization can investigate large data amounts. This is critical business tool in the
current competitive industry. The OLAP cubes can easily uncover relationships, identify
trends and offer numerous perspectives regarding an organization’s performance. All
these can be attained with only a few seconds.
b) Great reporting tool
OLAP cubes are normally used by an organization for the reporting advantage that
they offer. In fact, to really extend the advantages of these OLAP cubes in an
organization, you require a good reporting tool. This reporting tool enables the
organization to leverage data directly from the cubes and offer scalability for important
business intelligence that it delivers to managers and employees in all departments.
c) Improves decision making
Through enabling the employees within an organization to view the analysis got from
the OLAP cubes, better decisions can be made and this allows the company to become
more competitive. Financial planners and analysts can attain better visibility concerning
financial performance, thereby improve reporting. Furthermore, OLAP cubes enable
operation managers to make good decisions regarding asset utilization so as to locate cost
savings opportunities.
d) Flexible
OLAP cubes are flexible and users can easily view their business data using several
reporting tools such as Microsoft Excel. It offers enhanced reporting flexibility via highly
customized and rich reports.
Provided OLAP cubes are used in the correct place, they have no shortcomings. They
essentially allow users to dissect information in different dimensions.
1.9.2. Disadvantage
NUMBER FOUR GROUP 13
OLAP CUBE OVERVIEW AND CASE STUDY
OLAP, and its reliance on the data warehousing environment, are two of the most
significant new technology areas.
Moreover, the use of relational design and relational database technology are not
feasible implementations to support OLAP design because of the complexity of the
queries. The business problem is that OLAP queries are not real-time queries because of
the refresh cycle of data into the OLAP data repository.
Conventional designs call for integration of data into an operational data store where
it can be cleansed, transformed, extracted, & then loaded into the OLAP data repository.
This is accomplished through the use of (ETL) tools. The ETL process is generally
complicated because data must be integrated and transformed for loading into the non-
normalized relational schema usually associated with OLAP environments. As such, the
process can be complicated and time consuming, and with large amounts of data may
only occur at monthly or quarterly time intervals. This creates the problem of not having
real-time data in the OLAP repository.
Real-time data exists in the OLTP environment where the time horizon of data within
the OLTP environment is much shorter because performance decreases can occur with
growing amounts of data. This is opposite of the nature and goals of the OLAP
environment where data is aggregated and the time horizon of data grows to some large
amount as determined by the information life cycle policy of the organization.
The main problems you have to face using OLAP as a source is that OLAP engines, in
general, are designed to return small result sets from highly aggregated data, whereas
data mining, in general, is designed to perform operations on large sets of raw (or
preprocessed) data.
The implementation of OLAP in Analysis Services, requires that all of the result set
be materialized in memory before returning to the client. This generally isn't a big deal
for typical OLAP queries, but if you are, for instance, trying to mine all of your
transaction data for the past 10 years, you will run into difficulties, in short the data
gathered may not be (relatively) recent enough to qualify as real-time data for business
intelligence purposes.
NUMBER FOUR GROUP 14
OLAP CUBE OVERVIEW AND CASE STUDY
CHAPER 2 - OLAP WITH SQL SERVER ANALYSIS SERVICE (SSAS)
2.1. SQL Server Analysis Services (SSAS)
Microsoft SQL Server Analysis Services, SSAS, is an online analytical processing
(OLAP), data mining and reporting tool in Microsoft SQL Server. SSAS is used as a tool
by organizations to analyze and make sense of information possibly spread out across
multiple databases, or in disparate tables. Microsoft has included a number of services in
SQL Server related to business intelligence and data warehousing. These services include
Integration Services and Analysis Services. Analysis Services includes a group of OLAP
and data mining capabilities.
2.2. Data Mining
Data mining algorithms supported in SSAS could be classified into five categories.
Predicting a sequence of events, for example, to analyze sequence of weather situation
that ends to a specific phenomenon. Finding groups of common items in transactions,
most common example here is market basket analysis. Finding groups of similar items, a
typical application in this area is segmenting customer data to find distinct group of
customers. Another category is Predicting a discrete attribute, for example, predicting
whether one specific customer is likely to buy the new product or not. Predicting a
continuous attribute, for example, forecasting next month revenue.
Data Mining within SQL Server
2.3. OLAP - Multi Dimensional Data in SQL Server
OLAP facilities are provided within SQL Server as a whole and also within SSAS.
NUMBER FOUR GROUP 15
OLAP CUBE OVERVIEW AND CASE STUDY
Multidimensional Data within SQL Server
Multidimensional Data provides means for developers to design, publish and modify
data cubes. A data cube represents data in multidimensional format which is suitable for
advanced ad-hoc and analytical queries. Data in a cube is aggregated based on cube
dimensions. Cube data can come from relational databases, data warehouses and data
marts.
2.4. SSAS Architecture
From the architecture point of view, SSAS is a separated service running on windows
that follows standard client/server architecture. Each server can contain several Analysis
Services instances. Each analysis services instance contains several Analysis Services
databases. Analysis services databases contain multidimensional data structures, data
mining structures, data sources, and data source views.
Logical SSAS Architecture
NUMBER FOUR GROUP 16
OLAP CUBE OVERVIEW AND CASE STUDY
AMO (Analysis Management Object) Applications are software programs that are
uses to define manage and publish SSAS cubes and data mining structures.
Physical SSAS Architecture
All communications with SSAS is done using XML for Analysis (XMLA). SSAS
provides a number of ways to client applications to access data. They share a common
protocol to communicate with an instance of Analysis Services which is XMLA.
Asoftheclientside,SSASsupportsthinclients,meaningallqueriesareprocessedin server
side. There exist several data access providers to support different programming
languages; ADO MD, OLEDB for OLAP and ADO MD.net. All data access providers
communicate to the server using XMLA.
NUMBER FOUR GROUP 17
OLAP CUBE OVERVIEW AND CASE STUDY
SSAS Clients; Physical Architecture
2.5. SSAS Tools
2.5.1. SQL Server Management studio
SQL Server Management Studio is a general management tool to manage relational
databases, Analysis Services databases, Reporting Services objects, and integration
services packages. By connecting SQL Server Management studio to an Analysis
Services instance on a machine, following database management tasks can be performed:
e) Processing analysis services objects
Processing an analysis services object means populating it with data. For example,
SQL Server Management studio provides the facilities to process data cubes, which is
populating them with data from data sources.
f) Browsing analysis services objects
The brows facility is a graphical query builder. By browsing, the content of Analysis
Services objects is queried. For example, browsing a cube includes dragging attributes /
hierarchies and cube measures to respective pane and brows the data in the cube.
g) Constructing queries
NUMBER FOUR GROUP 18
OLAP CUBE OVERVIEW AND CASE STUDY
Multidimensional queries(MDX),Data Mining queries(DMX) and XML. A queries
can be posed to Analysis Services database via SQL Server Management studio.
h) Scripting Analysis Services objects
Scripting an object makes it an XMLA script so that it could be executed in another
analysis services instance to make the same object. Scripting only includes structures and
definitions. The data is provided after processing.
i) Managing Analysis Services Databases
Other general database management concepts are also included in SQL Server
Management Studio; Defining roles and security aspects of accessing the database and
making backups from analysis services databases.
2.5.2. Microsoft Business Intelligence Development Studio (BIDS)
BIDS is the development environment for OLAP cubes and data mining models.
BIDS is Microsoft Visual Studio with Analysis Services projects extension. After
development is done, BIDS publishes the analysis services project to an Analysis
Services database. Processing the database can be performed both from BIDS and SQL
Server Management Studio.
BIDS components:
j) Analysis Services Solution Explorer
The solution explorer show different objects within the analysis database that is being
developed. These include data sources, data source views, cubes, dimensions, mining
structures, roles, assemblies, and miscellaneous. By double clicking on any item in the
solution explorer, you can open that object with its specific designer.
k) Analysis Services Designers
There are four designers in BIDS, Data Source View Designer, Cube Designer,
Dimension Designer, and Data Mining Designer. Some of these designers are reviewed
in this report while performing tutorials.
l) Analysis Services Menus
There are four menus related to analysis services projects, database menu, cube
menu, dimension menu and mining model menu. Each of these are activated when the
respective designer is open.
m) Analysis Services Tools/Options
NUMBER FOUR GROUP 19
OLAP CUBE OVERVIEW AND CASE STUDY
The option menu provides some analysis services specific options on top of the
general ones: Connection and query timeouts, Default Deployment Server Edition,
Default Target Server, and Data Mining Viewers.
NUMBER FOUR GROUP 20
OLAP CUBE OVERVIEW AND CASE STUDY
CHAPER 3 - OLAP CASE STUDY - DECISION MAKING WITH SHOPPING
MALLS
3.1. Overview on shopping malls and activity
Number Four Global is having different malls in our city, where daily sales take place
for various products. Higher management is facing an issue while decision making due to
non availability of integrated data they can’t do study on their data as per their
requirement. So they asked us to design a system which can help them quickly in
decision making and provide Return on Investment (ROI) based on reports using Data
warehouse and OLAP model.
3.2. Develop database & data warehouse
- Database and data warehouse for Number Four Global were designed based
on Microsoft SQL Server
- Database was named as "NumberFourGroup"
- Data warehouse was named as "NumberFourceGroupDW"
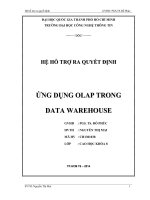
3.3. Develop OLAP Cube
- Finance cube
Finance cube for Number Four Data Warehouse
- Internet Sales cube
NUMBER FOUR GROUP 21
OLAP CUBE OVERVIEW AND CASE STUDY
for Number Four Data Warehouse
NUMBER FOUR GROUP 22
OLAP CUBE OVERVIEW AND CASE STUDY
- Reseller Sales cube
Reseller Sales cube
3.4. Process the cube
- All the cubes for the NumberFourGroupDW will be deployed and processed
using SSAS, especially SQL Server Business Intelligence Development Studio
or SQL Server Management Studio in Microsoft SQL Server
NUMBER FOUR GROUP 23
OLAP CUBE OVERVIEW AND CASE STUDY
Process cube using Microsoft SQL Server Managment Studio
3.5. Reports
System will use reports which are created using SSRS. All the reports will be
deployed to SSRS Server and integrate to the NumberFourGroup web application system
sothat the managers can view easily.
NUMBER FOUR GROUP 24
OLAP CUBE OVERVIEW AND CASE STUDY
CONCLUSIONS
Microsoft SQL Server has robust capabilities for development, maintenance and
querying of OLAP cubes. SSAS provides the combination of flexible architecture and
robust user friendly tools. The OLAP storage settings provide adequate options for
system designers.
SSAS flexible architecture makes it possible to integrate SSAS with any type of data
source, and any means of end user interaction. Since OLAP is additional to basic
database technologies and information technology solutions, there are always other
database related technologies and user interfaces that OLAP has to integrate to. SSAS
architecture flexibility makes it easier to integrate OLAP with existing database and
interface technologies.
SQL Server provides user friendly development tools. Business Intelligence
Development Studio(BIDS) is based on Microsoft Visual Studio 2008, one of the most
popular and user friendly development environments. Since BIDS has been used in other
Microsoft products before, it has become mature enough to facilitate OLAP development
and design.
SSAS gives many options to architecture designers to propose problem specific
OLAP storage solutions. There are seven predefined OLAP storage options In addition
to predefined storage options, architecture designers are given the chance to define even
more specific storage options based on particular application.
The scalability test reveals that query response time grows linearly with the database
size. As the main purpose behind OLAP is to support ad-hoc queries, the linear
complexity is a major problem in applications with huge data. On the other hand, real
time queries capabilities provided by ROLAP storage mode could be very helpful if the
database size is moderate.
NUMBER FOUR GROUP 25