Assessment and quantification of foetal electrocardiography and heart rate variability of normal foetuses from early to late gestational periods 4
Bạn đang xem bản rút gọn của tài liệu. Xem và tải ngay bản đầy đủ của tài liệu tại đây (3.5 MB, 29 trang )
Comparison of novel versus commercial HRV softwares
174
CHAPTER 11
COMPARISON OF NOVEL
VERSUS COMMERCIAL
HRV SOFTWARES
Comparison of novel versus commercial HRV softwares
175
1 Introduction
In this chapter, foetal HRV data derived from F-EXTRACT was compared to
that obtained from a commercial HRV software available for public use. This
commercial HRV software was the Nevrokard
HRV System (Medistar Inc.,
Slovenia). Differences in the algorithms used in these systems for the computation
and derivation of HRV, and for rejection and replacement of ectopic beats and other
artifacts, may lead to variations in the HRV data generated from the same ECG
recordings. Jung J et al. (Jung J et al., 1996) has shown that the results generated by 4
different commercial HRV systems on the same Holter ECG recordings were
significantly different.
2 Method
2.1 Nevrokard system description/operation
The Nevrokard HRV system is a commercial software package designed to
perform analysis of ECG data in the time and frequency domains. It is able to analyze
data series in single-column format such as those which were earlier exported (and
stored in the computer hard disk drive) from FEMO with the extension *.frr.
The basic steps for HRV analysis on the Nevrokard system were as follows:
The Nevrokard system was first started and data format to be analyzed was selected
to be *.frr. This additional step was required as the software also recognizes other file
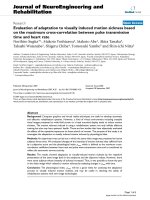
formats. After selecting a particular data file from the stored data files, the graph of
RR-interval versus time for the selected file then appeared on the screen. Any missing
Comparison of novel versus commercial HRV softwares
176
or spurious beats may be viewed (Figure 11-1). The Nevrokard software does not
contain any automated algorithms to detect and correct spurious beats, although it
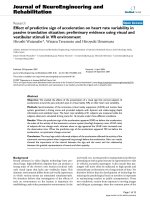
does allow the operator to manually modify any suspicious beats by dragging it with
the mouse key to the correct location (Figure 11-2). For example, say the RR-
intervals of a particular recording were all around the value of 400 ms except for one
which was found to be 900 ms, one can then move the beat from 900 ms to 400 ms
before proceeding with HRV analysis.
The next step was to select an appropriate interval of time free of erroneous
beats for performing the HRV evaluation. This was done simply by setting the start
and end points of the selected duration. The software is only able to analyze epoch
lengths of 2
x
, where x is any interger ≥ 6. Hence, the shortest analyzable epoch is 64
seconds (s), the next length being 128 s, followed by 256 s, 512 s, 1028 s and so on. If
other epoch lengths were selected using the mouse keys, the system would
automatically choose the nearest available lengths of 2
x
. For example, if 300 s or 800
s of data were manually selected, then the system would analyze the first 256 s and
512 s of data, respectively. In this study, epoch lengths of 256 s were analyzed for
reasons mentioned in Chapter 10.
One main difference between the two HRV systems is that the Nevrokard
system plots the RR-interval against time whereas F-EXTRACT plots it against beat
number. Thus, after selecting a period of 256 s on the Nevrokard system, its
corresponding period in terms of beat number was to be selected on F-EXTRACT.
Comparison of novel versus commercial HRV softwares
177
Figure 11-1: A screen on Nevrokard HRV software showing the graph of foetal
RR-interval versus time.
Comparison of novel versus commercial HRV softwares
178
←
(a)
↓
(b)
Figure 11-2: An artifact RR-interval (indicated by red arrow) measuring 900 ms
(a) is dragged by the cursor to an estimated value of 400 ms (b) on
the Nevrokard program.
Comparison of novel versus commercial HRV softwares
179
This was done by integrating into F-EXTRACT an algorithm that allowed the
conversion of the selected period’s start and end points in seconds to the
corresponding start and end points in beat numbers. This ensured that both the
Nevrokard and F-EXTRACT performed the HRV analyses on the same selected
period of RR-intervals. For F-EXTRACT, the results of the time- and frequency-
domain analyses on the selected epoch were generated by using programming
commands that included entering the start and end beat numbers on the MatLab
software. The details of operating F-EXTRACT are described in Chapter 9.
As for the Nevrokard system, after selection of the RR-interval epoch, time-
domain and frequency-domain analyses were performed. The information in the
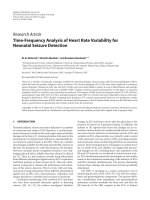
generated output for time-domain analysis is shown in Table 11-1. Figure 11-3 shows
the generated FFT spectrum, as well as the values of absolute and normalized VLF,
LF and HF power, and the LF/HF ratio. The Nevrokard software allows the frequency
ranges analyzed to be defined by the operator. The frequency bands selected for foetal
HRV analyses were the same for both HRV systems, i.e., very low frequency (VLF:
0.003-0.04 Hz), low frequency (LF: 0.04-0.15 Hz) and high frequency (HF: 0.15-1.0
Hz). Other frequency-domain parameters compared were total power, LF and HF
power in normalized units, as well as the LF/HF ratio.
In summary, after selection of the corresponding 256 s epoch and elimination
of ectopic and artifact beats, foetal HRV was evaluated by both the Nevrokard and F-
EXTRACT. In total, 374 foetal ECG (fECG) recordings performed on 18 to 41 week-
Comparison of novel versus commercial HRV softwares
180
Table 11-1: The time-domain statistics displayed by Nevrokard software:
Duration
Time Range from/to
No. of Samples
Maximum
Minimum
Max./Min.
Range
Mean
Median
95 % Conf. Interval
99 % Conf. Interval
Coef. of Variance
Variance
Std. Deviation (SDNN)
Std. Error (SENN)
SDSD
RMSSD
NN50 Count or NN27 Count (Fetal NN)
pNN50 or pNN27 (Fetal NN)
Comparison of novel versus commercial HRV softwares
181
Figure 11-3: A screen on Nevrokard HRV software showing the HRV power
spectrum and calculated VLF, LF and HF power in absolute and
normalized units.
Comparison of novel versus commercial HRV softwares
182
old foetuses were subjected to analysis by both HRV systems, thereby generating two
sets of HRV data from each fECG recording. Each set of HRV data included five
time-domain parameters (fHR, mNN, SDNN, rMSSD and pNN27) and six frequency-
domain parameters (absolute LF power, normalized LF power, absolute HF power,
normalized HF power, LF/HF ratio and total power). The Nevrokard and F-
EXTRACT systems were compared using the HRV data determined from their
algorithms.
3 Statistics
To evaluate the level of agreement between the Nevrokard and F-EXTRACT
HRV systems, the Bland-Altman technique (Bland JM and Altman DG, 2003, 1999)
was performed using Prism 4.03 for Windows (GraphPad Software Inc., San Diego,
CA, USA).
The Bland-Altman technique evaluates the agreement between two methods
of measurement and consists of a graphical presentation where the differences
between the two measurements (Y-axis) is plotted against their average values (X-
axis). In this study, HRV analyses were performed using Nevrokard and F-
EXTRACT systems on each of the 374 fECG recording. The differences in the values
of each time- and frequency-domain HRV measurement generated by these two
systems were plotted against their average values. For each HRV variable, the
absolute difference was calculated by subtracting values obtained by F-EXTRACT
Comparison of novel versus commercial HRV softwares
183
(F) from those obtained by Nevrokard (N), i.e., (N-F). This absolute difference was
then plotted against the average value of N and F, i.e., .
N+F
2
In the Bland-Altman plot, the middle solid line running horizontally across
the plot represents the mean of (N-F) throughout the range of mean HRV
measurements. For reference, a dotted line is drawn at y=0, which represents zero
difference between N and F. The upper and lower solid lines on the plots represent
the upper and lower 95% limits of agreement (LoA), which delineate the range within
which 95% of the differences lie. The 95% LoA were computed from the equation: đ
± 1.96 SD, where đ is the mean difference and SD is the standard deviation of the
differences. The Bland-Altman plot allows the visualization of how big is the
discrepancy or bias between the two methods, whether there is any consistent relation
or systemic bias between the difference and the mean, and whether the assumption of
constant standard deviation of the differences is satisfied.
When the data points on the Bland-Altman plot spread out as the magnitude
of measurements increase, the assumption of constant standard deviation is violated.
A logarithmic or percent Y-scale, which is computed by log (N-F) and {[(N-F) ÷
(N+F)/2] x 100}, respectively, is thus recommended (Bland JM and Altman DG,
1999). In this study, the percent plot is preferred because it is easily interpreted as
numbers can be read directly from the plot without the need for back log-
transformation (Dewitte K et al., 2002). Another advantage of the percent plot is that
it gives an indication of the magnitude of the difference with reference to its mean
Comparison of novel versus commercial HRV softwares
184
value, independent of the HRV variable being compared. This is useful considering
that there are many different HRV variables that vary substantially in their mean
values.
4 Results
4.1 Mean measurements obtained by Nevrokard and F-EXTRACT
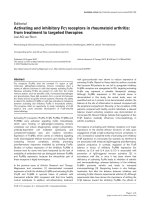
In Chapter 10, the mean values of HRV parameters obtained by F-
EXTRACT were presented. In Figures 11-4 and 11-5, the bar charts display the
means of time- and frequency-domain HRV parameters obtained by the two systems
and in relation to foetal gestational age. It can be seen in Figure 11-4 that the foetal
heart rate (fHR) and mNN measurements obtained by the two HRV systems were
very similar. The values of the other time-domain variables (SDNN, rMSSD, pNN27)
however, were approximately two times higher when measured by the Nevrokard
system.
In Figure 11-5, it can be observed that the LF power obtained by the two
HRV systems did not differ as much as the HF power, which was almost 5 times
higher when measured by the Nevrokard system. Similar to most time-domain
variables, the total power measured by the Nevrokard system was approximately
twice of that measured by F-EXTRACT. When the effect of the total power was
removed, the normalized LF and HF power measured by the Nevrokard system were
lower (approximately half) and higher (almost twice), respectively, than those
Comparison of novel versus commercial HRV softwares
185
Gestational age
>=37 wks
>32-<37 wks
>27-32 wks
>22-27 wks
18-22 wks
Fetal heart rate (bpm)
200
150
100
50
0
F-EXTRACT
Nevrokard
Gestational age
>=37 wks
>32-<37 wks
>27-32 wks
>22-27 wks
18-22 wks
mNN (ms)
500
400
300
200
100
0
F-EXTRACT
Nevrokard
Gestational age
>=37 wks
>32-<37 wks
>27-32 wks
>22-27 wks
18-22 wks
SDNN (ms)
60
50
40
30
20
10
0
F-EXTRACT
Nevrokard
Gestational age
>=37 wks
>32-<37 wks
>27-32 wks
>22-27 wks
18-22 wks
rMSSD (ms)
60
50
40
30
20
10
0
F-EXTRACT
Nevrokard
Gestational age
>=37 wks
>32-<37 wks
>27-32 wks
>22-27 wks
18-22 wks
pNN27 (%)
40
30
20
10
0
F-EXTRACT
Nevrokard
Figure 11-4: Bar charts of mean time-domain parameters at various gestational ages
as measured by Nevokard and F-EXTRACT.
Comparison of novel versus commercial HRV softwares
186
Gestational age
>=37 wks
>32-<37 wks
>27-32 wks
>22-27 wks
18-22 wks
LF power (ms2)
500
400
300
200
100
0
F-EXTRAC
T
Nevrokard
Gestational age
>=37 wks
>32-<37 wks
>27-32 wks
>22-27 wks
18-22 wks
Normalized LF power (n.u.)
70
60
50
40
30
20
10
0
F-EXTRAC
T
Nevrokard
Gestational age
>=37 wks
>32-<37 wks
>27-32 wks
>22-27 wks
18-22 wks
HF power (ms2)
1800
1600
1400
1200
1000
800
600
400
200
0
F-EXTRAC
T
Nevrokard
Gestational age
>=37 wks
>32-<37 wks
>27-32 wks
>22-27 wks
18-22 wks
Normalized HF power (n.u.)
90
80
70
60
50
40
30
20
10
0
F-EXTRACT
Nevrokard
Gestational age
>=37 wks
>32-<37 wks
>27-32 wks
>22-27 wks
18-22 wks
LF/HF ratio
2.5
2.0
1.5
1.0
.5
0.0
F-EXTRAC
T
Nevrokard
Gestational age
>=37 wks
>32-<37 wks
>27-32 wks
>22-27 wks
18-22 wks
Total power (ms2)
4000
3000
2000
1000
0
F-EXTRACT
Nevrokard
Figure 11-5: Bar charts of mean frequency-domain parameters at various
gestational ages as measured by Nevokard and F-EXTRACT.
Comparison of novel versus commercial HRV softwares
187
measured by F-EXTRACT. As such, the calculated LF/HF ratios were significantly
lower (averaging about one-sixth) than the LF/HF ratios calculated by F-EXTRACT.
4.2 Comparison of time-domain parameters between Nevrokard and
F-EXTRACT using Bland-Altman method
Differences between foetal HRV measured by the Nevrokard and F-
EXTRACT systems were analyzed using the Bland-Altman method. Table 11-2
displays the mean differences and LoA of HRV variables while Table 11-3 displays
the mean percent difference and the percent LoA of HRV variables. Figure 11-6
shows the comparison of differences in time-domain HRV parameters using the two
HRV systems. For fHR, the mean difference (N-F) was -1.5 bpm (-1.3%), suggesting
that the Nevrokard system generally measured 1.5 bpm (1.3%) lower than F-
EXTRACT. The upper and lower LoA were -20.2 bpm (-15.6%) and 17.2 bpm
(12.9%), which means that majority (95%) of the differences in fHR measured by the
Nevrokard system could range from being 20.2 bpm (15.6%) less than to 17.2 bpm
(12.9%) more than that measured by F-EXTRACT. Similar to fHR, the mNN
measured by the two HRV systems did not vary much, as shown by the mean
difference (N-F) of 7.1 ms, which is a negligible 1.3% difference. The LoA ranged
from -61.1 ms (-13%) to 75.3 ms (15.7%) (Tables 11-2 and 11-3).
Figure 11-6 shows that as the values of SDNN, rMSSD and pNN27
increased, there was an increase in the differences. Figure 11-6 also shows an
increase in the standard deviation of the differences (indicated by the spreading out of
Comparison of novel versus commercial HRV softwares 188
Table 11-2: Bland-Altman analysis (mean difference) of time- and frequency-
domain variables
HRV parameter
Mean
difference
(N-F)
SD of
difference
Lower limit
of
agreement
Upper limit
of
agreement
fHR (bpm) -1.5 9.5 -20.2 17.2
mNN (ms) 7.1 34.8 -61.1 75.3
SDNN (ms) 20.6 25.7 -29.7 70.9
rMSSD (ms) 30.3 19.0 -6.9 67.4
Time-
domain
pNN27 (%) 13.2 11.4 -9.1 35.5
LF power (ms
2
) -53.4 310.7 -662.5 555.7
LF norm (n.u.) -33.1 15.4 -63.2 -2.9
HF power (ms
2
) 910.2 869.0 -793.1 2613.5
HF norm (n.u.) 37.3 20.0 -1.8 76.4
LF/HF ratio -1.2 1.2 -3.6 1.1
Frequency
-domain
Total power (ms
2
) 1236.4 2199.7 -3075.0 5547.8
N- measurements obtained from Nevrokard
F- measurements obtained from F-EXTRACT
Comparison of novel versus commercial HRV softwares
189
Table 11-3: Bland-Altman analysis (mean percent difference) of time- and
frequency-domain variables
HRV parameter
Mean %
difference
(N-F)
SD of
difference
Lower limit
of
agreement
Upper limit
of
agreement
fHR (bpm) -1.3 7.3 -15.6 12.9
mNN (ms) 1.3 7.3 -13.0 15.7
SDNN (ms) 47.9 47.0 -44.3 140.1
rMSSD (ms) 87.9 45.8 -1.8 177.6
Time-
domain
pNN27 (%) 79.0 67.6 -53.6 211.6
LF power (ms
2
) -36.0 63.1 -159.7 87.7
LF norm (n.u.) -92.9 33.6 -158.8 -27.0
HF power (ms
2
) 101.6 56.1 -8.3 211.5
HF norm (n.u.) 61.0 28.9 4.4 117.6
LF/HF ratio -131.3 39.4 -208.5 -54.1
Frequency
-domain
Total power (ms
2
) 45.2 55.2 -62.9 153.3
Mean difference, SD of bias and limits of agreements are in %.
N- measurements obtained from Nevrokard
F- measurements obtained from F-EXTRACT
Comparison of novel versus commercial HRV softwares
190
90
110
130
150
170
190
-50
-25
0
25
50
Average fHR (bpm)
DIfference in fHR
400
500
600
700
-120
-80
-40
0
40
80
120
160
Average mNN (ms)
Difference in m NN
0
25
50
75
100
125
-100
-50
0
50
100
150
Average SDNN (ms)
Difference in SDNN
0
25
50
75
100
-50
0
50
100
Average rMSSD (ms)
DIfference in rMSSD
0
10
20
30
40
50
-40
-20
0
20
40
60
Average pNN27 (%)
Difference in pNN27
b
p
m ms
ms
ms
%
Figure 11-6: Bland-Altman plots of absolute difference (N-F) against average for
time-domain variables (ms). The middle solid line represents mean bias,
surrounded by upper and lower limits of agreement. N and F=
measurements obtained from Nevokard and F-EXTRACT, respectively.
Comparison of novel versus commercial HRV softwares
191
data points) with increasing values of SDNN, rMSSD and pNN27. As recommended,
Bland-Altman plots of percent difference were plotted when the criteria of constant
standard deviation is not met (Figure 11-7). For SDNN, the mean percent difference
was 47.9% and the LoA ranged from -44.3% to 140.1%. This indicates that the values
of SDNN measured by the Nevrokard system were nearly 50% higher than those
measured by the F-EXTRACT system. The rMSSD values measured by the
Nevrokard system were nearly 88% higher than those measured by the F-EXTRACT
system with LoA ranging from –1.8% to177.6%. As for pNN27, the values measured
by the Nevrokard system were 79% higher than those measured by the F-EXTRACT
system and the LoA ranged from –53.6% to 211.6% (Table 11-3).
4.3 Comparison of frequency-domain parameters between
Nevrokard and F-EXTRACT using Bland-Altman method
Figures 11-8 and 11.9 display the Bland-Altman plots of absolute and percent
differences, respectively, in the frequency-domain HRV variables, LF and HF power,
normalized LF and HF power, total power and LF/HF ratio. Table 11-3 displays the
mean percent difference and the percent LoA of these HRV variables. From Figure
11-8, similar to the plots of SDNN, rMSSD and pNN27, the bias and its standard
deviation widened as the magnitude of the frequency-domain HRV variables
increased. The mean difference for LF power was -36.0% (LoA= -159.7% to 87.7%),
indicating that Nevrokard system gave a value averaging 36% lower than F-
EXTRACT. The HF power on the other hand, was 101.6% higher (LoA= -8.3% to
211.5%) when measured by the Nevrokard system. The lower LF and higher HF
Comparison of novel versus commercial HRV softwares
192
90
110
130
150
170
190
-40
-20
0
20
40
Average fHR (bpm)
% Difference in fHR
300
400
500
600
700
-40
-30
-20
-10
0
10
20
30
40
Average mNN (ms)
% Difference in mNN
0
25
50
75
100
125
-150
-100
-50
0
50
100
150
200
250
Average SDNN (ms)
% Difference in SDNN
0
25
50
75
100
-100
-50
0
50
100
150
200
250
Average rMSSD (ms)
% DIfference in rMSSD
0
10
20
30
40
50
-100
0
100
200
300
Average pNN27 (%)
% Difference in pNN27
Figure 11-7: Bland-Altman plots of percent difference (N-F) against average for time-
domain variables (ms). The middle solid line represents mean percent
bias, surrounded by upper and lower limits of agreement. N and F=
measurements obtained from Nevokard and F-EXTRACT, respectively.
Comparison of novel versus commercial HRV softwares
193
0
500
1000
1500
2000
-2000
-1000
0
1000
2000
Average LF power
Difference in LF power
0
25
50
75
100
-100
-50
0
50
Average normalized LF power
Difference in LF norm
0
1000
2000
3000
4000
-2500
0
2500
5000
Average HF power
Difference in HF power
0
50
100
150
-50
0
50
100
150
Average normalized HF power
Difference in HF norm
0
1
2
3
4
5
6
7
-5
0
5
Average LF/HF
Difference in LF/HF
0
2000
4000
6000
8000
10000
-10000
-5000
0
5000
10000
15000
Average total power
Difference in total power
ms
2
n.u.
(
ms
2
)
(
n.u.
)
n.u.
ms
2
(
ms
2
)
(
n.u.
)
ms
2
(
ms
2
)
Figure 11-8: Bland-Altman plots of absolute difference (N-F) against average for
frequency-domain variables. The middle solid line represents mean bias,
surrounded by upper and lower limits of agreement. N and F=
measurements obtained from Nevokard and F-EXTRACT, respectively.
Comparison of novel versus commercial HRV softwares
194
500
1000
1500
2000
-300
-200
-100
0
100
200
Average LF power
% Difference in LF power
0
25
50
75
100
-200
-150
-100
-50
0
50
Average normalized LF power
% Difference in LF norm
0
1000
2000
3000
4000
-100
-50
0
50
100
150
200
250
Average HF power
% Difference in HF power
0
50
100
150
-50
0
50
100
150
200
Average normalized HF power
% Difference in HF norm
0
1
2
3
4
5
6
7
-250
-200
-150
-100
-50
0
50
Average LF/HF
% Difference in LF/HF
0
2000
4000
6000
8000
10000
-200
-100
0
100
200
300
Average total power
% Difference in total power
(ms
2
)
(n.u.)
(ms
2
)
(n.u.)
(ms
2
)
Figure 11-9: Bland-Altman plots of percent difference (N-F) against average for
frequency-domain variables (ms). The middle solid line represents mean
percent bias, surrounded by upper and lower limits of agreement.
N and F= measurements obtained from Nevokard and F-EXTRACT,
respectively.
Comparison of novel versus commercial HRV softwares
195
power measured by the Nevrokard system gave rise to low values of LF/HF ratios
(131.3% lower than those obtained by F-EXTRACT).
The total power, which is a summation of the LF and HF power, was 45.2%
higher (LoA= -62.9% to 153.3%) when measured by the Nevrokard system.
Normalized units of LF and HF power were 92.9% lower and 61.0% higher,
respectively, when measured by the Nevrokard system as compared to those
measured by F-EXTRACT. The LoA of normalized LF ranged from -58.8% to -
27.0% while that of HF power ranged from from 4.4% to 117.4% (Table 11-3).
5 Discussion
In this study, the agreement between two HRV systems was evaluated using
the Bland-Altman technique of comparing between methods of measurement. From
the Bland-Altman plots, it can be seen that the two HRV softwares agree well (bias
=1.3%) for fHR and mNN measurements. This may be because both fHR and mNN
are relatively simple measurements that require little or no data processing. The mean
difference in mNN of 7.1 ms was relatively similar to that obtained by other studies
that compared different HRV systems on adult subjects. Jung J et al. (Jung J et al.,
1996) assessed the agreement of 4 different commercially available HRV systems on
the same 24-hour Holter tape recording and obtained an inter-system difference
ranging from 7 ms to 100 ms in mNN. Sandercock GR et al. (Sandercock GR et al.,
2004) used 3 different HRV systems to analyze simultaneously-recorded short-term
ECG on 30 healthy adults and found that the bias in mNN measurements between
Comparison of novel versus commercial HRV softwares
196
systems ranged from 0.6 ms to 7.0 ms in the supine position. Yi G et al. (Yi G et al.,
2000), who studied the differences between 3 different HRV systems on the same 24-
hour Holter tape in survivors of acute myocardial infarction (MI), found a maximum
mean difference of 1.8 ms in mNN measures between systems.
Besides fHR and mNN, all other HRV measures show poor agreement
between the two softwares (bias >30% and wide LoA). The discrepancy between the
two softwares widened with increasing values of HRV measurement. This is not
surprising since the values of most HRV variables were approximately doubled when
measured by Nevrokard as compared to F-EXTRACT. Increasing values of x, 3x, and
5x measured by F-EXTARCT will be measured as 2x, 6x and 10x, respectively, by
Nevrokard. And their respective inter-system differences will be x (2x-x), 3x (6x-3x)
and 5x (10x-5x), which increase as the measured HRV values increase.
The mean difference in SDNN measured by the two HRV systems was found
to be 21 ms in this study. The maximum mean inter-system differences in SDNN
were observed to be 36 ms, 9.9 ms and 4.4 ms by Jung J et al. (Jung J et al., 1996),
Sandercock GR et al. (Sandercock GR et al., 2004) and Yi G et al. (Yi G et al., 2000),
respectively. The mean difference in rMSSD in this study was high (30 ms) relative
to the maximum mean inter-system differences in rMSSD obtained by Jung (12 ms),
Sandercock (2.2 ms) and Yi et al. (11.1 ms). Our mean difference in pNN27 (13%)
was also higher than the maximum mean difference in pNN50 between HRV systems
used by Jung (3%). Such wide variations in differences may be explained by
Comparison of novel versus commercial HRV softwares
197
dissimilar subjects and durations of ECG sampled. Jung and Yi examined 24-hour
HRV whereas Sandercock examined short-term HRV of 300 s. Adult HRV were
measured in the other 3 studies whereas foetal HRV was measured in this study.
Sandercock’s subjects consisted of 30 healthy adults, Yi’s subjects were 26 post-MI
patients, whilst Jung’s subjects included 7 patients with aortic valve disease and 4
healthy volunteers.
Generally, discrepancies in HRV measurements obtained from different ECG
recordings and analysis systems can arise due to differences in ECG recording and/or
differences in analogue-to-digital (A/D) conversion of the ECG signal. Since the ECG
recording and A/D conversion had been performed by the same equipment (FEMO),
and the same strip of recording was used for HRV analysis, the reason for the
incomparable results from the Nevrokard and F-EXTRACT could be due to
differences in the HRV analysis algorithms and/or differences in the processing of
erroneous beats. Due to the fact that both HRV systems applied the same
mathematical formulae for time-domain analysis, as well as the same FFT technique
for frequency-domain analysis, the disparity in the HRV results generated by
Nevrokard and F-EXTRACT is most likely due to the different system-dependent
processing of erroneous beats.
The Nevrokard system is manufactured for analysis of HRV in adults, whose
RR-intervals contain considerably less errors as compared to foetal RR-intervals.
Errors in RR-interval data occur when R peaks are misidentified. This can arise when
Comparison of novel versus commercial HRV softwares
198
the recording system either fails to mark an R peak or mistakenly marks a non-
existent R peak. Interference of skin surface conductivity and muscle action potentials
can further introduce errors. Abdominal foetal ECG recording may encounter the
problem of low voltages of foetal ECG signals due to the great distance of foetal heart
from the recording electrodes, as well as reduced conductivity (due to the vernix
layer). Foetal movements, which are beyond the control of the mother or investigator,
may also influence the ECG signals. These problems are not encountered during
short-term HRV recording in adults. As such, the algorithm for artifact-correction in
softwares such as the Nevrokard system, which are used for analyzing adult HRV,
may not be as robust as required for the analysis of foetal HRV. The F-EXTRACT
system was specially developed for foetal HRV analysis. It has an automated
correction algorithm that filtered beats that deviated from the previous qualified
interval
by more than 30% and replaced them by linearly-interpolated beats. In
addition to this, a filter with upper and lower threshold limits of fHRs of 170 and 110
bpm was incorporated to eliminate extreme values of foetal RR-interval durations. On
the contrary, the Nevrokard system does not contain any algorithms for automatic
correction of ectopic and artifact beats, although it does allow the operator to edit
extreme RR-interval values by a click-and-drag motion to a rough estimated value
(not by linear interpolation).
It has been demonstrated that uncorrected RR-interval data exhibited much
higher variability than corrected ones, as shown in the greater magnitude of all HRV
parameters (Marchant-Forde RM et al., 2004). Thus, in the F-EXTRACT system,