Environmental performance and sustainable architecture a critical review in the context of singapore public housing 3
Bạn đang xem bản rút gọn của tài liệu. Xem và tải ngay bản đầy đủ của tài liệu tại đây (17.18 MB, 131 trang )
Part III From Environmental Performance to
Sustainable Housing Performance –
Empirical Discussions
190
Chapter 9:
Land Use Efficiency
9.1
Prelude
Part III extends the discussion of environmental performance to sustainable housing
performance with empirical dimension through:
–
identifying the limitations of building environmental assessment method, and
–
including socio-economic factors and architectural design in sustainable housing discourse.
Both discussions are substantiated by practices found in Singapore public housing. For each
of the five sustainable housing performances, i.e. land use efficiency, energy efficiency, water
conservation, material efficiency, and experience of home, the discussion is generally
structured as followed:
(a)
Elaborate how each of the corresponding environmental performance criteria is
measured, and empirically analyse their interrelationship with other environmental
performance criteria, in order to highlight conflicts (where occur) among case studies’
results of environmental performances and the hierarchical approach in suggesting
solutions to the conflicts;
(b)
Correlate the results of Singapore public housing case studies’ environmental
performances against pertinent socio-economic data, in order to illustrate the
limitations of environmental performance domain and the influential factors of socio-
economics domain; and
(c)
Discuss the approaches to achieve high sustainable housing performance from the
Integrated Framework for Sustainable Housing Design and Discourse, substantiated
through the analysis of Singapore public housing practices. The study:
o
Identifies case examples of architectural design and socio-economics
strategies that contribute to sustainable housing performances as well as
191
environmental performances, but not reflected in building environmental
assessment method.
o
Identifies additional factors in socio-economics and architectural design
domains, on top of environmental performance domain, impacting building
environmental performances and sustainable housing performances.
o
Establishes an integrated approach to each sustainable housing performance
issue and give empirical dimension to the theoretical-constructed Integrated
Framework for Sustainable Housing Design and Discourse (established in
Chapter 5). Subsequently, the assessment criteria and factors that impact each
sustainable housing performance issue will be proposed and discussed.
The discussion in this chapter focuses on land use efficiency. Globally, land use efficiency is
one of the main issues in sustainable development (Jenks & Burgess, 2000) to undertake both
population growth and prevention the lost of natural environment to the development of built
environment. Locally, due to land scarcity and population growth, land use efficiency is always
a prime issue, especially in housing development.
192
9.2
Land use performance and Plot Ratio
The environmental performance of land use in GBC is relatively new concept for applying in
analysing public housing design. The constituting components of land use performance
criterion (L) in GBC, as expressed in equation (12), include the total site area (A
site
), building
footprint area (A
f
), percentage of hard-paved area of the site (P), and total net usable area of
the building (A
net
).
L = [A
f
+ (A
site
x P)] / A
net
(12)
In a housing development, A
site
is fixed, while the other components are variants. In order to
achieve good land use performance, the building footprint area (A
f
) and the percentage of
hard-paved area of the site (P) should be kept as low as possible, and the total net usable area
of the building (A
net
) should be as large as possible.
In Singapore, scarcity of land has always been a dominant issue, and has resulted in the
proliferation of high-rise high-density housing development in the country. The legislative
measurement and control of land use for each development is Plot Ratio (PR), which is also
commonly and conventionally found in architectural practice. In the Handbook on Gross
Floor Area by the Urban Redevelopment Authority, 'Plot Ratio of a site is defined as the ratio
of the gross floor area of a building(s) (A
gross
) to its site area' (URA, 2003), or:
PR = A
gross
/ A
site
(13)
In a housing development, A
site
is fixed, while A
gross
is the variant. In order to achieve good land
use in terms of PR, the commonly found strategies are designing higher building height and higher
housing density, or narrower spacing among housing blocks (HDB annual report, various issues).
193
In the comparison between land use performance and PR, the strategies to achieve high PR
are found to be more limited and do not recognise the credit of greenery provision on site. The
relationship between land use performance and PR can be described as that PR does not
determine, but only constitute to the score for land use efficiency.
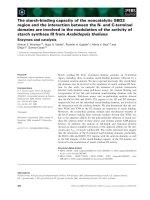
In order to gain further insight to the above relationship, empirical investigation into public
housing case studies are carried out. When juxtaposing indicative trendlines of PR values and
land use performance scores (Figure 9-1), the relationship between the two is not obvious.
The reason is that, in land use efficiency, it is the sum of building footprint and hard-paved
area, rather than the gross floor area in PR calculation that constitutes the values. Therefore,
case studies with larger total greenery area on ground and smaller building footprint yield for
higher land use efficiency score.
Plot Ratio
2.5
2.5
2.1
1.9
2.7
2.1
2
2.1
3.9
2.7
2.6
2
4
3.3
2.7
4.2
2.7
3.1
3.6
2.3
2.5
2.9
3
3.3
2.9
3.6
3.7
3.6
3.3
3.2
0
1
2
3
4
5
01: 1-R I
02: 2-R
S
03: 3-R I
04: 2-R I
05: 3-R
NG
06: 3- &
4-R NG
07: 4-R
NG
08: 5-R I
09: 4-R
S
10: 5-R
A
11: 3- &
4-R A
12: 4-R
A
13:
HUDC
14:
HUDC
15: 5-R
A
16: 5-R I
17: Exe.
Mais
18: Exe.
Aprt.
19: Exe.
Aprt.
20: Exe.
Mais.
21: 3-R I
Upg
22: 3-R
NG Upg
23: 4-R
A & 5-R
24: 4-R
A & 5-R
25: 4-R
A & 5-R
26: 4-R
A & 5-R
27: Exe.
28:
Premium
29:
Premium
30:
Premium
1960s
1970s
1980s
1990s
2000s
Trendline of Land Use Performance (GBC score)
-1.4
1.5
-1.1
-0.7
0.7
1.2
-0.6
3.5
-1
-0.7
-1.1
1.1
2.8
0.2
0.8
0.2
1.2
0.8
1.5
0.6
0.3
-0.6
0.4
0.7
2.4
0.7
0.3
0.2
0.4
1
-2
-1
0
1
2
3
4
5
01: 1-R I
02: 2-R S
03: 3-R I
04: 2-R I
05: 3-R NG
06: 3- & 4-R NG
07: 4-R NG
08: 5-R I
09: 4-R S
10: 5-R A
11: 3- & 4-R A
12: 4-R A
13: HUDC Mais .
14: HUDC A prt .
15: 5-R A
16: 5-R I
17: Exe. Mais
18: Exe. Aprt.
19: Exe. Aprt.
20: Exe. Mais.
21: 3-R I Upg
22: 3-R NG Upg
23: 4-R A & 5-R
24: 4-R A & 5-R
25: 4-R A & 5-R
26: 4-R A & 5-R
27: Exe.
28: Premium A & B
29: Premium B
30: Premium B & C
1960s
1970s
1980s
1990s
2000s
Figure 9-1
: Juxtaposition the indicative trendlines of Plot Ratio values and land use performance scores, of public
housing case studies
194
Case study number 08 – 5-room point block – is a good example, where the PR value is 2.1,
being the third lowest among the values of all case studies, but the score for land use efficiency
is 3.5, being the highest among the scores of all case studies. This is attributed to the large
greenery area in the total site of the development and the small footprint of the housing block.
Figure 9-2
: Large greenery area surrounding the housing blocks in case study number 08
Case study number 09 – 4-room slab block in Tampines – is an example of a reversed case. The
housing design has a PR value of 3.9, being the third highest among the values of all case
studies. However, its score for land use efficiency is -1, being the third lowest among the scores of
all case studies. This is due to the large surface parking area, resulting in small percentage of
greenery area in the total site area, and the rather large building footprint of a slab block structure.
Figure 9-3
: Large surface parking area around the housing blocks in case study number 09
195
In juxtaposing the two indicative trendlines of PR and land use performance (Figure 9-1), it is
observed that in the early decades, the two types of values are not correlated to each other
with the dominant low scores for land use performance. This is due to (1) the preference of
slab block structure, which has larger building footprint and lower building height, and (2) the
often use of open spaces among housing blocks for surface parking – a common practice
found in public housing at the time. In the period after 1990s, the indicative land use
performance trend in public housing design shows improvement. This is due to
–
the requirement of minimum greenery shaded area was established under design
guidelines of public housing (HDB, 1995),
–
multi-storey carparks with smaller land area usage for parking purpose were
introduced giving more area for greenery landscape, and
–
housing blocks are designed with various building shapes and higher building height
leading to smaller building footprints in its percentage to the total building net area.
Despite of the differences between the two concepts, there still exists, in general, a correlation
between PR and land use performance. Nevertheless, a high PR value, although does not
promise, is a constituting components leading to, high land use performance score.
In summary, the primary difference between the two is the area of greenery on the site. While
greenery area is a component in measuring land use performance, it is not considered in PR
calculation. From environmental perspective, this difference provides more flexibility in
architectural design to achieve high land use performance. This is illustrated by: case studies
with higher PR do not promise to have high land use performance; and conversely, case
studies with lower PR are still able to gain high land use performance (Figure 9-1). The
second case is of particularly encouraging for buildings in area with limited PR allowed by
planning control. This is because the design of the building still can overcome the obstacle
and can gain high land use performance, if large greenery area is provided.
196
9.3
Land use performance and its interconnectedness
9.3.1 Land use performance and change in ecological value of the site
The relationship between the land use performance, and change in ecological value of the site
performance demonstrate a supportive reciprocation. While the prior criterion encourages
minimising the use of land and to maximise greenery area, part of the later criterion takes a
step further in encouraging the providence of greenery area that contains high ecological
value. The measurement of the second criterion bases on 'the presence or absence of design
features that demonstrate that the site ecology has been disturbed, retained or improved'
(GBTool User Manual, 2002). The rationale is that to be high land use performance by
maximise the area of greenery alone is not enough because the environmental quality and
ecological values of the greenery have not been defined and are not controlled.
The above discussion can be better comprehended through a comparison between case study
number 8 and case study number 19 (Figure 9-4). In case study number 8, there are ample
areas of greenery and small building footprint, whereas case study number 19 has smaller
percentage area of greenery and larger building footprint. However, the ecological value of
case study number 8 is lower than the one of case study number 19. As illustrated in Figure
9-4, the large greenery areas of case study number 8 comprises of, however, mostly sparely-
grown grassland and barely a number of small tree. This setting yields minor room for
biodiversity development and does not contain high ecological value. In reverse, although
case study number 19 has smaller percentage of greenery area, the design and replanting of
mangrove trees along the river banks have not only restored the ecological value of the site
after construction, but also act as a green connector and promote biodiversity. As described by
the landscape architect, the riverbanks have been designed as green connectors linking Pasir
Ris Park in the north to the neighbourhood centre. The replanted mangrove plants and natural
vegetation have intermixed with each other along the riversides, restoring the natural state of
197
the river. Mangrove shells, fishes, birds including kingfisher, are among other species can be
found in the area (rewritten from interviewing with the senior landscape architect, June,
2004). The comparison of the two case studies has illustrated the necessity of, and positive
interaction between, the two criteria of land use performance and of change in ecological
value of the site performance, for a meaningful and comprehensive environmental and
ecological consideration in terms of land resource usage.
Figure 9-4
: Comparison of land use performance and change in ecological value of the site performance between
case study number 8 (above) and case study number 19 (below)
198
9.3.2 Land use performance and daylighting performance
Plot Ratio and visible angle of sky at window
The increase of PR, thus constituting to higher land use performance, is perceived as
overwhelming and suppressing opportunities for daylighting performance of the building.
In calculating daylight factor, one of the constituting factors to enhance the performance is the
visible angle of sky at window (degree). This visible angle of sky is 90
0
minus reduction for
overhangs and nearby buildings (GBTool User Manual, 2002). The implication for design
strategies to obtain high daylight factor is to have larger distance between housing blocks and
lower building heights in the housing estate in order to achieve a larger visual angle of sky at
window. This is obviously in contrast to the design strategies to achieve the objective of high
land use performance.
By juxtaposing the two indicative trendlines of PR and of the visual angle of sky at window
of public housing designs, the opposite trends of the two indicators are clearly addressed.
While the PR of public housing has been increasing decade after decade, the indicative trend
of visual angle of sky at window has been decreased, impacting the trend of daylight factor
performance. In the first two decades of public housing development, housing estates are
designed with the dominant PR ranged from 1.9 to 2.7, and the dominant visual sky angles at
window are ranged from 24
0
to 45
0
. Conversely, in the case studies built in year 2000 and
beyond, the PR values are higher (ranging from 2.9 to 3.7); whereas the visual angles of sky
at window are relatively lower (dominantly ranging from 22
0
to 38
0
).
199
P lo t Ratio
2.5
2.5
2.1
1.9
2.7
2.1
2
2.1
3.9
2.7
2.6
2
4
3.3
2.7
4.2
2.7
3.1
3.6
2.3
2.5
2.9
3
3.3
2.9
3.6
3.7
3.6
3.3
3.2
0
1
2
3
4
5
01: 1- R I
02: 2- R
S
03: 3- R I
04: 2- R I
05: 3- R
NG
06: 3- &
4- R NG
07: 4- R
NG
08: 5- R I
09: 4- R
S
10: 5- R
A
11: 3- &
4- R A
12: 4- R
A
13:
HU DC
14:
HU DC
15: 5- R
A
16: 5- R I
17: Exe.
Mais
18: Exe.
A prt.
19: Exe.
A prt.
20: Exe.
Mais .
21: 3- R I
Up g
22: 3- R
NG Upg
23: 4- R
A & 5-R
24: 4- R
A & 5-R
25: 4- R
A & 5-R
26: 4- R
A & 5-R
27: Exe.
28:
Pr e mium
29:
Pr e mium
30:
Pr e mium
1960s
1970s
1980s
1990s
2000s
Trendline of visual ang le of sky a t window (degree)
45
30
45
24
60
30
45
27
30
60
30
60
30
25
15
30
60
27
30
20
45
60
38
60
38
38
25
22
30
26
0
10
20
30
40
50
60
70
01: 1-R I
02: 2-R S
03: 3-R I
04: 2-R I
05: 3-R NG
06: 3- & 4-R NG
07: 4-R NG
08: 5-R I
09: 4-R S
10: 5-R A
11: 3- & 4-R A
12: 4-R A
13: HUDC Mais.
14: HUDC A prt.
15: 5-R A
16: 5-R I
17: Exe. Mais
18: Exe. A prt.
19: Exe. A prt.
20: Exe. Mais.
21: 3-R I U p g
22: 3-R NG Upg
23: 4-R A & 5-R
24: 4-R A & 5-R
25: 4-R A & 5-R
26: 4-R A & 5-R
27: Exe.
28: Premium A & B
29: Premium B
30: Premium B & C
1960 s
1970 s
1980 s
1990 s
2000 s
Figure 9-5
: Juxtaposition the indicative trendline of Plot Ratio and the one of visual angle of sky at window
The two trends are not obvious in the 1980s and 1990s, as the case studies have mixed PR values,
and mixed visual sky angles at windows. Nonetheless, case studies with high PR values (ranging
from 3.6 to 4.2 for case studies numbers 9, 13, 16, and 19) yield low visual sky angles at windows
of 30
0
. Similarly, case studies with high visual sky angles at windows (60
0
as found in case studies
numbers 10, 12, 17, and 22) do not have high PR values (2.7, 2, 2.7, and 2.9 respectively).
The discrepancy, as illustrated by the above two indicative trends, however, is not applied to all
the case studies. There are individual cases that demonstrate to achieve both high PR values and
large visual angles of sky at windows. This can be achieved as a result of design strategies in
articulating estate layout that allows windows facing to larger open spaces, rather than to narrow
the spaces between housing blocks. Taking the extreme example of case study number 24 –
block 660C Boon Lay, there are no windows facing East and West to the narrow spacing
between housing blocks. Instead, extensive windows are designed to face North and South to
200
the large open spaces. Stagger layout of housing blocks in the housing estate also help in
achieving this.
Figure 9-6
: There are no windows facing East and West to the narrow spacing between housing blocks. Instead,
extensive windows face North and South to the large open spaces
Nevertheless, there is an inconsistency between the objective of achieving higher PR and the
one of achieving larger visible angle of sky at window, as reflecting in the two indicative
trends of public housing evolution (Figure 9-5). This leads to the existence of a potential
discrepancy between the objective of land use performance and that of daylighting
performance.
Land use performance and daylight factor
When mapping the indicative performance trends of land use and of daylighting, both trends
show positive progression over times, regardless of the potential discrepancy as analysed. The
reason originates from the measurements of both land use performance and daylight factor,
that are not determined by the building height and spacing between buildings alone. In land
use performance, other considerations include building footprint area and percentage of
greenery area in the site. In daylight factor, other constituting components in the measurement
include the total area and reflectance of interior surfaces, the total area and average visibility
transmittance of windows.
201
When correlating the indicative performance trends of daylight factor and of visible angle of
sky at window, it is observed that there is a reverse trend between the two. While the
indicative trend of visible angle of sky at window descends, the one of daylight factor
performance ascends over times. This is because of the increase in window size (especially in
living/dining area) towards the later years of public housing development (Figure 9-8).
Trendline of Land Use Performance (GBC score)
-1.4
1.5
-1.1
-0.7
0.7
1.2
-0.6
3.5
-1
-0.7
-1.1
1.1
2.8
0.2
0.8
0.2
1.2
0.8
1.5
0.6
0.3
-0.6
0.4
0.7
2.4
0.7
0.3
0.2
0.4
1
-2
-1
0
1
2
3
4
5
01: 1-R I
02: 2-R S
03: 3-R I
04: 2-R I
05: 3-R NG
06: 3- & 4-R NG
07: 4-R NG
08: 5-R I
09: 4-R S
10: 5-R A
11: 3- & 4-R A
12: 4-R A
13: HUDC Mais .
14: HUDC A prt .
15: 5-R A
16: 5-R I
17: Exe. Mais
18: Exe. Aprt.
19: Exe. Aprt.
20: Exe. Mais.
21: 3-R I Upg
22: 3-R NG Upg
23: 4-R A & 5-R
24: 4-R A & 5-R
25: 4-R A & 5-R
26: 4-R A & 5-R
27: Exe.
28: Premium A & B
29: Premium B
30: Premium B & C
1960s
1970s
1980s
1990s
2000s
P e rfo rm a nc e of D a ylig ht F actor (GB C score)
-1.3
-0.9
-0.3
-1
0
-0.7
0.5
-0.3
0
0.3
-0.2
-0.2
0.3
0
-0.1
0
0.5
-0.4
-0.5
-0.3
-1.1
-1
0.4
0.9
0.3
-0.4
0.1
-1
-0.5
0
-2
-1
0
1
2
3
4
5
01: 1-R I
02: 2-R S
03: 3-R I
04: 2-R I
05: 3-R NG
06: 3- & 4-R NG
07: 4-R NG
08: 5-R I
09: 4-R S
10: 5-R A
11: 3- & 4-R A
12: 4-R A
13: HUDC Mais .
14: HUDC A pr t.
15: 5-R A
16: 5-R I
17: Exe. Mais
18: Exe. Aprt.
19: Exe. Aprt.
20: Exe. Mais.
21: 3-R I Upg
22: 3-R NG Upg
23: 4-R A & 5-R
24: 4-R A & 5-R
25: 4-R A & 5-R
26: 4-R A & 5-R
27: Exe.
28: Premium A & B
29: Premium B
30: Premium B & C
1960s
1970s
1980s
1990s
2000s
Trend line of visua l a ng le of sk y at window (degree)
45
30
45
24
60
30
45
27
30
60
30
60
30
25
15
30
60
27
30
20
45
60
38
60
38
38
25
22
30
26
0
10
20
30
40
50
60
70
01 : 1-R I
02 : 2-R S
03 : 3-R I
04 : 2-R I
05 : 3-R NG
06 : 3- & 4-R NG
07 : 4-R NG
08 : 5-R I
09 : 4-R S
10 : 5-R A
11 : 3- & 4-R A
12 : 4-R A
13 : HUDC Mais.
14 : HUDC A prt.
15 : 5-R A
16 : 5-R I
17 : Exe. Mais
18 : Exe. A prt.
19 : Exe. A prt.
20 : Exe. Mais.
21 : 3-R I U p g
22 : 3-R NG Upg
23 : 4-R A & 5-R
24 : 4-R A & 5-R
25 : 4-R A & 5-R
26 : 4-R A & 5-R
27 : Exe.
28 : Premium A & B
29 : Premium B
30 : Premium B & C
19 6 0 s
19 7 0 s
19 8 0 s
19 9 0 s
20 0 0 s
Figure 9-7
: Juxtaposing the indicative trendlines of land use efficiency, daylight factor performance, and visual
angle of sky at window
202
Figure 9-8
: An imagery trendline to illustrate windows in living area of public housing has been getting larger and
larger over times
In brief, although there is a potential conflict in the objectives between land use performance and
daylighting performance, the practice of public housing development has demonstrated that this
potential discrepancy can be minimised and even diminished through various design strategies.
9.3.3 Land use performance and impact on access to daylight of adjacent building
The measurement of impact on access to daylight of adjacent building performance base on
the vertical angle measured from the building line on the ground of the nearest adjacent
property to the roof line of the case study housing. The smaller the angle, the higher score the
case study housing achieves for this performance. This suggests design strategies of larger
spacing between buildings, and of lower building height; both of which, however, contradict
to strategies to obtain high land use performance.
In order to find out how the design of public housing over times has embarked upon this
discrepancy, the environmental performance of land use is mapped with the one of impact on
access to daylight of adjacent building (Figure 9-9). Empirically, the indicative trend of land use
performance has been increasing, whereas the other has been decreasing over time. Case studies
in the early stage, up to and including the 1980s, are often in slab block structure, 10 to 13 floor
heights, and are often placed parallel with other housing blocks in the estate with a minimum
distance of approximate 28m. These case studies yield for a rather steady and dominant higher
scores for impact on access daylighting of adjacent building, in compared to the case studies in
the 1990s and the year 2000 and beyond. The reasons for the relatively mixed scores among the
203
performances of case studies in the later decades include (1) more variety of building shapes,
forms and heights are applied even in one estate, and (2) housing blocks in an estate are
designed less rigorously in terms of spacing among buildings and orientations.
Trendline of land use efficiency (GB C score)
-1.4
1.5
-1.1
-0.7
0.7
1.2
-0.6
3.5
-1
-0.7
-1.1
1.1
2.8
0.2
0.8
0.2
1.2
0.8
1.5
0.6
0.3
-0.6
0.4
0.7
2.4
0.7
0.3
0.2
0.4
1
-2
-1
0
1
2
3
4
5
01: 1-R I
02: 2-R S
03: 3-R I
04: 2-R I
05: 3-R NG
06: 3- & 4-R NG
07: 4-R NG
08: 5-R I
09: 4-R S
10: 5-R A
11: 3- & 4-R A
12: 4-R A
13: HUDC Mais.
14: HUDC A pr t.
15: 5-R A
16: 5-R I
17: Exe. Mais
18: Exe. A prt.
19: Exe. A prt.
20: Exe. Mais.
21: 3-R I Up g
22: 3-R NG Upg
23: 4-R A & 5-R
24: 4-R A & 5-R
25: 4-R A & 5-R
26: 4-R A & 5-R
27: Exe.
28: Premium A & B
29: Premium B
30: Premium B & C
1960s
1970s
1980s
1990s
2000s
Impact on access to daylight of adjacent property (GBC score)
0.5
0.9
0.5
0.8
1.5
1.5
3
0
0
0
0
0
-0.6
-1
1.5
-1
-1.5
0
0
1.5
0
0
-1.5
-1.5
-1.5
-1.5
1.5
-1.5
0
0
-2
-1
0
1
2
3
4
5
01: 1-R I
02: 2-R S
03: 3-R I
04: 2-R I
05: 3-R NG
06: 3- & 4-R NG
07: 4-R NG
08: 5-R I
09: 4-R S
10: 5-R A
11: 3- & 4-R A
12: 4-R A
13: HUDC Mais .
14: HUDC A pr t.
15: 5-R A
16: 5-R I
17: Exe. Mais
18: Exe. Aprt.
19: Exe. Aprt.
20: Exe. Mais.
21: 3-R I Upg
22: 3-R NG Upg
23: 4-R A & 5-R
24: 4-R A & 5-R
25: 4-R A & 5-R
26: 4-R A & 5-R
27: Exe.
28: Premium A & B
29: Premium B
30: Premium B & C
1960s
1970s
1980s
1990s
2000s
Figure 9-9
: Mapping the indicative performance trend of land use performance and the one of impact on access to
daylight of adjacent property
At more detailed level, case studies with higher land use performance do have low performance
on impact on access to daylighting of adjacent building, and vice versa. An example can be
found in case study number 07 – a 4-room slab bock in Clementi. The case study housing has
low land use performance score (-0.6) – the fifth lowest score for this performance among the
case studies. There is large spacing between the case study and its adjacent housing block,
which has windows facing the case study building. This large spacing resulted in the highest
score (3) for impact on access to daylight of adjacent building among the case studies.
204
Figure 9-10
: Large spacing between the case study housing and the adjacent housing block (case study number 7)
In brief, the empirical indicative performance trends of public housing coincide with the
earlier theoretical analysis, in which there is a discrepancy between the design objectives of
land use performance and impact on the access to daylighting of adjacent building.
Furthermore, it is observed that land use performance of public housing design has been
receiving higher priority in the later decades.
9.3.4 Land use performance and visual privacy
The assessment of visual privacy performance bases on the distance of available point that
horizontal and downward views are available of the interior of bedroom and living areas of
certain percentage of dwelling units of the building. Interpreting from the above objective,
design strategies include:
(a)
Providing large spacing from the case study housing to its surrounding structures so
that the long distance from this external viewing points can limit viewing ability to
the case study housing;
(b)
Manoeuvring the orientations of the case study housing windows so that they will not
face to the proximal potential viewing points for privacy intrusion; and
(c)
Providing design elements as obstacles, e.g. external screen, to limit visual intrusion
to the internal of dwelling units.
205
Among the numbers of design strategies to achieve the objective of visual privacy, the
distances to the case study housing from the adjacent structures is of particular concern. The
longer this distance is, the better the case study housing performs in this aspect. This is,
however, the potential conflict to land use performance objective, which is in favour for more
compact form of development.
Trendline of Land Use Performance (GBC score)
-1.4
1.5
-1.1
-0.7
0.7
1.2
-0.6
3.5
-1
-0.7
-1.1
1.1
2.8
0.2
0.8
0.2
1.2
0.8
1.5
0.6
0.3
-0.6
0.4
0.7
2.4
0.7
0.3
0.2
0.4
1
-2
-1
0
1
2
3
4
5
01: 1-R I
02: 2-R S
03: 3-R I
04: 2-R I
05: 3-R NG
06: 3- & 4-R NG
07: 4-R NG
08: 5-R I
09: 4-R S
10: 5-R A
11: 3- & 4-R A
12: 4-R A
13: HUDC Mais .
14: HUDC A prt .
15: 5-R A
16: 5-R I
17: Exe. Mais
18: Exe. Aprt.
19: Exe. Aprt.
20: Exe. Mais.
21: 3-R I Upg
22: 3-R NG Upg
23: 4-R A & 5-R
24: 4-R A & 5-R
25: 4-R A & 5-R
26: 4-R A & 5-R
27: Exe.
28: Premium A & B
29: Premium B
30: Premium B & C
1960s
1970s
1980s
1990s
2000s
V is ua l p riva cy (GB C score)
-0.1
-0.1
-0.1
0.5
-0.2
-0.1
5
5
-0.3
3
-0.1
0
5
4
4
3.5
4.5
1.5
4.5
5
-0.1
-0.8
1.8
2
1.9
1
3.5
-0.5
0
2
-2
-1
0
1
2
3
4
5
01: 1-R I
02: 2-R S
03: 3-R I
04: 2-R I
05: 3-R NG
06: 3- & 4-R NG
07: 4-R NG
08: 5-R I
09: 4-R S
10: 5-R A
11: 3- & 4-R A
12: 4-R A
13: HUDC Mais .
14: HUDC A prt.
15: 5-R A
16: 5-R I
17: Exe. Mais
18: Exe. A prt.
19: Exe. A prt.
20: Exe. Mais.
21: 3-R I Up g
22: 3-R NG Upg
23: 4-R A & 5-R
24: 4-R A & 5-R
25: 4-R A & 5-R
26: 4-R A & 5-R
27: Exe.
28: Premium A & B
29: Premium B
30: Premium B & C
1960s
1970s
1980s
1990s
2000s
Figure 9-11
: Juxtaposing the environmental performance of land use with the one of visual privacy
To gain insights on how public housing designs over times have addressed this potential
discrepancy, the indicative trend of land use performance is mapped with the one of visual
privacy performance (Figure 9-11). Unpredictably, the two performance trends appear in
general being correlated to each other. In the early three decades, majority of case studies
receive lower scores for visual privacy performance (except for the individual case studies
number 7, 8, 10, 13 and 14). This is because of the dominant estate layout of parallel slab
block structures with windows facing to each other (Figure 9-12). This type of estate layout
206
also allows for large percentage of dwelling units in a housing block, the interiors of which
can be seen from the opposite structure. The exceptional case studies numbers 8, 10, and 14
are point block structures, in which the numbers of dwelling units are distributed evenly on
the 4 facades. The most vulnerably visual privacy façade can only affect a percentage of 1/4
of the total dwelling units of the housing, and thus the buildings has better visual privacy
performance due to their small percentage of affected dwelling units. Furthermore, the point
block housings are often arranged staggering with other surrounding blocks (as in case studies
numbers 8 and 10), which further enhance their visual privacy performance (Figure 9-13).
Figure 9-12
: Parallel layout of slab block housing that reduces visual privacy performance in case study number
04 (photo is taken after the estate underwent the main upgrading programme)
Figure 9-13
: Staggering layout of point block housing that enhances visual privacy performance in case study number 10
207
Majority of case studies, in the period between 1990 to the present day, receive higher scores for
visual privacy performance (except for case studies numbers 21, 22, 28 and 29), whereas land use
performance has also improved. The potential discrepancy between the two performances has
been diminished as a result of the application of design strategies to manoeuvre the orientations of
the case study housing windows (so that they will not face directly to the proximal potential
privacy intrusion viewing points) and providing design elements as obstacles, e.g. external screen,
to limit visual intrusion to the internal of dwelling units. As for the exceptional case studies,
particularly case studies number 21 and 22, which underwent a major main upgrading programme,
the visual privacy performance trends has further declined from the already low performance
scores. This is inevitable due to the 'Space Adding Item' (SAI) of the upgrading programme that
narrows the open space sandwiched between the housing blocks (Figure 9-14).
Figure 9-14
: Reduce in visual privacy due to narrower spacing between housings after upgraded with SAI (case
study number 22)
208
In brief, there exists a potential discrepancy between the objective of land use performance
and that of visual privacy performance. In the early decades, the design of public housing
often traded off visual privacy performance owing to the rigorous layout of parallel slab
blocks. However, in later decades, visual privacy in public housing design has been improved
along side with higher land use performance, as a result of being more flexible in building
forms, window orientations and estate layouts.
In brief, the discussions in this section have indicated that there are potential discrepancies in
the interconnectedness between land use performance and environmental performance of
daylighting performance, access to daylight of adjacent building, and visual privacy. When
discrepancies occurred, the implied suggestion from the practice of building environmental
assessment is trading-off less important environmental performance for a higher total
environmental performance. This practice can be seen in how public housing development in
the later decades takes on land use performance with higher priority to the performance of
access to daylight of adjacent building (see section 9.3.3). With the exception of this case, the
other two potential discrepancies, i.e. between land use performance and daylighting
performance, and between land use performance and visual privacy, can be overcome through
architectural design techniques and strategies (see section 9.3.2 and 9.3.4).
209
9.4
Land use performance and the trend of smaller household size
Globally, land use efficiency is one of the long-discussed issues in sustainable development
(Jenks & Burgess, 2000) to undertake both population growth and prevention of the lost of
natural environment to the development of built environment. Discarding strategies and
attempts to be land-use efficiency, e.g. building higher and denser, changes in household
structure and the trend towards smaller household size (especially in the developed
countries), have complicated this issue through the resulted rapidly increase of household
numbers. Rudlin and Falk state:
At the end of the twentieth century, the debate is […] about housing numbers, as a
result not of population growth but household growth. (Rudlin & Falk, 1998)
Due to the small size of the country, population growth and land-use have always been a
major issue in Singapore. Over the years, the population has continuously increased from
about 1.6 million in 1960 to nearly 3.4 million people in 2002. Density, as a result, has
simultaneously increased more than two folds from about 2810 persons/km
2
in 1960 to 6075
persons/km
2
in 2002 (Department of Statistic, Yearbook of Statistics Singapore (various
issues)). Strategies to undertake land-use issue include reclaiming land from the sea and
increasing building Plot Ratio. Nonetheless, the social trend of reducing household size
(Figure 9-15) has complicated the efforts.
Faced with the above land use issues, this session aims to investigate how the indicative land
use performance trend in public housing interacts with population increase, indicative public
housing density trend, and social trends of smaller household size. The above trends are
juxtaposed as illustrated in Figure 9-15 to facilitate the correlation analysis.
210
P o pula tio n and Public Housing Population
0
100000
200000
300000
400000
500000
600000
700000
800000
900000
1000000
1100000
1200000
1300000
1400000
1500000
1600000
1700000
1800000
1900000
2000000
2100000
2200000
2300000
2400000
2500000
2600000
2700000
2800000
2900000
3000000
3100000
3200000
3300000
3400000
3500000
3600000
1960
1961
1962
1963
1964
1965
1966
1967
1968
1969
1970
1971
1972
1973
1974
1975
1976
1977
1978
1979
1980
1981
1982
1983
1984
1985
1986
1987
1988
1989
1990
1991
1992
1993
1994
1995
1996
1997
1998
1999
2000
2001
2002
persons
Population
(people)
Public
housing
population
(people)
Trendline of Land Use Performance (GBC score)
- 1 .4
1.5
- 1 .1
- 0 .7
0.7
1.2
- 0 .6
3.5
- 1
- 0 .7
- 1 .1
1.1
2.8
0.2
0.8
0.2
1.2
0.8
1.5
0.6
0.3
- 0 .6
0.4
0.7
2.4
0.7
0.3
0.2
0.4
1
- 2
- 1
0
1
2
3
4
5
01 : 1-R I
02 : 2-R S
03 : 3-R I
04 : 2-R I
05 : 3-R NG
06 : 3- & 4-R NG
07 : 4-R NG
08 : 5-R I
09 : 4-R S
10 : 5-R A
11 : 3- & 4-R A
12 : 4-R A
13 : HUDC Mais.
14 : HUDC A prt.
15 : 5-R A
16 : 5-R I
17 : Exe. Mais
18 : Exe. A prt.
19 : Exe. A prt.
20 : Exe. Mais.
21 : 3-R I U pg
22 : 3-R NG Upg
23 : 4-R A & 5-R
24 : 4-R A & 5-R
25 : 4-R A & 5-R
26 : 4-R A & 5-R
27 : Exe.
28 : Premium A & B
29 : Premium B
30 : Premium B & C
19 60s
19 70s
19 80s
19 90s
20 00s
H ous ing Density (number of occupants / gross site area)
25.3
22.6
17.8
16.7
15.9
10.9
8 .9
9 .9
15.0
8 .2
10.8
6 .5
6 .1
6 .8
6 .2
11.0
5 .2
6 .2
7 .2
4 .1
7 .6
8 .0
8 .3
8 .7
7 .6
9 .3
8 .3
9 .8
8 .8
7 .0
0 .0
5 .0
1 0.0
1 5.0
2 0.0
2 5.0
3 0.0
01: 1 - R I
02: 2 - R S
03: 3 - R I
04: 2 - R I
05: 3 - R NG
06: 3 - & 4-R NG
07: 4 - R NG
08: 5 - R I
09: 4 - R S
10: 5 - R A
11: 3 - & 4-R A
12: 4 - R A
13: HUDC Mais.
14: HUDC Aprt.
15: 5 - R A
16: 5 - R I
17: E xe . Mais
18: E xe . Ap rt.
19: E xe . Ap rt.
20: E xe . Mais .
21: 3 - R I U pg
22: 3 - R NG Upg
23: 4 - R A & 5-R
24: 4 - R A & 5-R
25: 4 - R A & 5-R
26: 4 - R A & 5-R
27: E xe .
28: P r e m iu m A & B
29: P r e m iu m B
30: P r e m iu m B & C
1960s
1970s
1980s
1990s
2000s
oc c upants/100m2
The Trend of Mean Household Size by F lat Type
0
1
2
3
4
5
6
7
8
1968
1973
1977
1981
1987
1993
1998
N u m b e r of pe rs ons per household
1- Room
2- Room
3- Room
4- Room
5- Room
Ex e c
HUDC
Mean household
s iz e
Figure 9-15
: Juxtaposing the trend of population and public housing population growth (Source: Department of
Statistic, Yearbook of Statistics Singapore (various issues)); the indicative trendline of land use performance; the
indicative trend of public housing density (constructed from the case studies); and the trend of mean household
size by flat type (Source: HDB (2000) Profile of Residents Living in HDB Flats, HDB).
211
It is observed from Figure 9-15 that in the context of continuous increasing trend of
population and public housing occupants over the years, there have been responses from
public housing design – the strategies of increasing building Plot Ratio, and of building
denser and higher housing estates. However, despite the efforts, the indicative public housing
density trend appears to show an opposite tendency, particularly the sharp fall in the period
from the 1960s to the 1980s. This inconsistency raises question on the effectiveness of being
high land use performance in tackling growing population and land scarcity issues, in other
words, question on whether there exists a correlation between them.
On the other hand, when juxtaposing the indicative public housing density trend with the
trend of mean household size, there appears to be a correlation between the two. Both trends
show a sharp fall tendency in the period from the 1960s to the 1980s, and continuously and
gradually decrease towards the end 1990s.
The phenomenon from the above correlation analysis led to the conclusion that there is a
strong influence of public housing density from the social trend towards smaller household
size. Although there may exist a connection between being higher land use performance and
higher density in public housing design, this connection is feeble. The rationale lies in that
land use performance emphasises only on the building physical performance of the
effectiveness of site area usage in providing total net usable area of a building, rather than in
the numbers of residents accommodated (in other words, the actual social and economic
context).
In short, the results of these empirical analyses have substantiated the theoretical discussion in
Part I of the thesis.
212
9.5
Approach from the Integrated Framework
It has been understood that the increasing pressure on scarce land resource in Singapore
derives from both population growth and social trend of smaller household size. The
strategies, extracted from environmental performance domain, are not effective enough due to
their criteria and weighting system that by-pass the inclusion of current social trend and
innovative solution from architectural design. By including socio-economics and architectural
design domains, the discussion of land use performance in environmental performance can be
shifted to that of land use efficiency in sustainable housing performance. Before looking into
how the Integrated Framework for Sustainable Housing Design and Discourse contributes a
systematic approach to land use efficiency; section 9.5.1 reviews and reveals case examples,
which address land use efficiency from socio-economics and architectural design approaches,
found in Singapore public housing development. These strategies and approaches occur both
intentionally and incidentally.
9.5.1 Case examples of socio-economics and architectural design approaches
Approaches from socio-economics
In the evolution of public housing development, there have been examples of engaging land
use issue through dialogues with social and cultural milieus. Among the attempts to prevent
vacant and unwanted housing (which are land-use inefficiency), the evolution of public
housing has been flexible with the social trends that may affect housing demands. In the
1960s when meeting housing shortage was an urgent task, public housings were speedily
developed with dominant 1-room and 2-room flats. However, in mid 1970s, the mass
development of 1-room and 2-room flat types has given way to the dominant 3-room flat
development; which was in turn ceased to develop due to low demand in the late 1980s. 4-
room and 5-room flats were the main flat types for development in the 1990s and early 2000s
(HDB Annual Report, various issues from 1960 to 2003). In the early 2000s, due to the
213
impact of economic crisis and the high housing price, the demand for smaller flat size
reoccurred. In respond, HDB has decided to redevelop the 3-room flat types in mid 2004 (The
Strait Times, 15
th
March 2004).
Besides being flexible in flat type design to meet housing demands, public housing has also
engaged another strategy, which is reducing the flat size to respond to the social trend of
smaller household size. In 1993, all 4-room, 5-room, and Executive flats had their sizes
reduced about 5m
2
(HDB Annual Report, 1993). In 1997, these flat types had their size
further reduced about 10 m
2
(HDB Annual Report, 1998). Although the solution can not rely
on continuously reducing flat size that affects the residents’ quality of life (The Strait Times,
25th June 2003); the strategy, again, illustrates the approach to land use efficiency as a social
response.
A prolonged objective of public housing is to promote the traditional value of extended family
in the region. In line with this objective, HDB, after the housing crisis in the 1960s, built
multi-bedroom flats in larger number compared to 1- and 2-room flat types. However, as the
society became more affluence, residents had higher demands pertaining to their living
environment. Nuclear families started to form, and younger couples began to afford a flat for
their own (HDB Annual Report 1970). These leads to the trend of smaller household size till
the present day. An attempt made in housing design was the introduction of multi-generation
flat type, ‘which allow[s] families with grandparents or in-laws the benefits of living together
under one roof whilst at the same time retaining privacy for both the younger and older
generations’ (HDB Annual Report 1987/1988). Although the flats we re not well received and
the construction of these flats was discontinued, this initiative illustrates a potential solution,
offered from the socio-economic domain by responding the social setting to engage in
environmental issues of land use.