Development of optical phase evaluation techniques application to fringe projection and digital speckle measurement
Bạn đang xem bản rút gọn của tài liệu. Xem và tải ngay bản đầy đủ của tài liệu tại đây (8.79 MB, 153 trang )
DEVELOPMENT OF OPTICAL PHASE EVALUATION
TECHNIQUES: APPLICATION TO FRINGE PROJECTION
AND DIGITAL SPECKLE MEASUREMENT
BY
CHEN LUJIE
(B. Eng.)
A THESIS SUBMITTED
FOR THE DEGREE OF DOCTOR OF PHILOSOPHY
DEPARTMENT OF MECHANICAL ENGINEERING
NATIONAL UNIVERSITY OF SINGAPORE
2005
ACKNOWLEDGEMENTS
ACKNOWLEDGEMENTS
The author would like to take this opportunity to express his sincere gratitude to his
supervisors Assoc. Prof. Quan Chenggen and Assoc. Prof. Tay Cho Jui. It is their
indefatigable encouragement and guidance that enable him to complete this work and
be awarded the honor of the “President’s Graduate Fellowship”.
Special thanks to all staff of the Experimental Mechanics Laboratory and the Strength
of Materials Lab. Their hospitality makes the author enjoy his study in Singapore as an
international student.
The author would also like to thank his peer research students, who contribute to
perfect research atmosphere by exchanging their ideas and experience.
Finally, the author would like to thank his family for all their support.
i
TABLE OF CONTENTS
TABLE OF CONTENTS
ACKNOWLEDGEMENTS
TABLE OF CONTENTS
SUMMARY
LIST OF FIGURES
LIST OF SYMBOLS
CHAPTER 1 INTRODUCTION
1.1 Optical techniques and applications
1.2 Data-processing methods
1.3 Objective of study
1.4 Outline of thesis
CHAPTER 2 LITERATURE REVIEW
2.1 Fringe projection measurement
2.1.1 Fourier transform profilometry
2.1.2 Phase-measuring profilometry
2.1.3 Spatial phase detection profilometry
2.1.4 Linear coded profilometry
2.1.5 Removal of the carrier phase component
2.2 Digital speckle measurement
2.2.1 Difference of phases
2.2.2 Phase of differences
2.2.3 Direct phase-extraction
2.3 Quality-guided phase unwrapping
CHAPTER 3 DEVELOPMENT OF THEORY
3.1 Wrapped phase extraction
3.1.1 Three-frame phase-shifting algorithm with an
unknown phase shift
i
ii
v
vii
xi
1
1
4
6
7
8
8
9
13
17
20
21
25
27
31
34
37
41
41
41
ii
TABLE OF CONTENTS
3.1.1.1 Processing of fringe patterns
3.1.1.2 Processing of speckle patterns
3.1.2 Phase extraction from one-frame sawtooth fringe
pattern
3.2 Phase quality identification
3.2.1 Spatial fringe contrast (SFC) quality criterion
3.2.2 Plane-fitting quality criterion
3.2.3 Fringe density estimation by wavelet transform
3.3 Carrier phase component removal
3.3.1 Carrier fringes in the x direction
3.3.2 Carrier fringes in an arbitrary direction
CHAPTER 4 EXPERIMENTAL WORK
4.1 Fringe projection system
4.1.1 Equipment
4.1.2 Experiment
4.2 Digital speckle shearing interferometry system
4.2.1 Equipment
4.2.2 Experiment
4.3 Specimens
CHAPTER 5 RESULTS AND DISCUSSION
5.1 Wrapped phase extraction
5.1.1 Three-frame algorithm with an unknown phase shift
5.1.1.1 Processing of fringe patterns
5.1.1.2 Processing of speckle patterns
5.1.1.3 Accuracy analysis
5.1.2 Sawtooth pattern profilometry
5.1.2.1 Intensity-to-phase conversion
5.1.2.2 Accuracy analysis
5.2 Phase quality identification
5.2.1 Spatial fringe contrast (SFC)
5.2.1.1 Selection of processing window size
42
43
45
48
49
51
53
57
58
63
65
65
65
67
68
68
70
72
75
75
75
75
77
81
83
83
88
91
91
91
iii
TABLE OF CONTENTS
5.2.1.2 Performance comparison of unwrapping
algorithms
5.2.2 Comparison of conventional and plane-fitting
quality criteria
5.2.3 Fringe density estimation
5.2.3.1 1-D fringe density estimation
5.2.3.2 2-D fringe density estimation
5.2.3.3 Accuracy analysis
5.3 Carrier phase component removal
5.3.1 Carrier fringes in the x direction
5.3.2 Carrier fringes in an arbitrary direction
CHAPTER 6 CONCLUSIONS AND RECOMMENDATIONS
REFERENCES
APPENDICES
A. C++ source code for Nth-order surface-fitting
B. List of publications
95
101
106
106
110
113
114
115
117
122
126
135
135
138
iv
SUMMARY
SUMMARY
The integration of an optical measurement system with computer-based data-
processing methods has recently brought many researchers to the field of optical
metrology. In this thesis, several optical phase evaluation techniques for fringe
projection and digital speckle measurement have been proposed. The reported methods
encompass three stages of optical fringe processing, namely wrapped phase extraction,
phase quality identification, and post-processing of an unwrapped phase map.
Algorithms for wrapped phase extraction aim to reduce the complexity in
conventional data-recording procedures. A three-frame phase-shifting algorithm is
developed to reduce the number of frames necessary for the Carré’s technique. A
sawtooth fringe pattern profilometry method achieves intensity-to-phase conversion
through a simple linear translation instead of phase-shifting or Fourier transform.
Experimental results have proven the viability of the methods but indicated the
necessity of accuracy enhancement.
Phase quality identification based on the spatial fringe contrast (SFC) and a
plane-fitting scheme deals with phase unwrapping problems, such as the profile
retrieval of an object with discontinuous surface structure and the error minimization
for shadowed phase data. The proposed phase quality criteria are compared with the
conventional criteria: the temporal fringe contrast (TFC), the phase derivative variance,
and the pseudo-correlation. It is shown that SFC criterion would have potential to
replace TFC completely and the plane-fitting criterion had an advantage in detecting
projection shadow. A fringe density estimation method based on the continuous
wavelet transform is described also. According to the open literature, fringe density
v
SUMMARY
information is beneficial for many spatial filtering techniques in improving their
adaptation and automation. Simulated results have demonstrated the viability of the
present algorithm on a fringe pattern with added noise.
For post-processing of an unwrapped phase map, a generalized least squares
approach is proposed to remove carrier phase components introduced by carrier fringes.
With a series expansion method incorporated, the algorithm is able to remove a
nonlinear carrier and will not magnify the phase measurement uncertainty. As
indicated by a theoretical analysis and subsequent results, the linearity of the phase-to-
height conversion can be retrieved after carrier removal and the calibration process of a
measurement system can be significantly simplified.
It is concluded that the proposed phase evaluation techniques have provided
solutions to overcome some existing problems in the field of optical fringe analysis.
However, the accuracy and robustness of the proposed wrapped phase extraction
methods and the fringe density estimation algorithm still require further improvements.
This could form the basis for future research.
A list of publications arising from this research project is shown in Appendix B.
vi
LIST OF FIGURES
LIST OF FIGURES
Fig. 2.1 Typical fringe projection measurement system 8
Fig. 2.2 Crossed-optical-axes geometry
Fig. 2.3 Band-pass filter in the frequency spectrum
Fig. 2.4 Computer-generated fringe patterns projected by a LCD projector
Fig. 2.5 (a) Wrapped phase map; (b) Unwrapped phase map; (c) Object
shape-related phase distribution
Fig. 2.6 Carrier fringes in the x direction
Fig. 2.7 (a) Right-angle triangle and (b) isosceles triangle pattern
Fig. 2.8 (a) Original and (b) shifted frequency spectrum
Fig. 2.9 Difference of phases
Fig. 2.10 Phase of differences
Fig. 3.1 Theoretical sawtooth fringe pattern
Fig. 3.2 (a) Sinusoidal signal with high frequency at the center; (b) CWT
magnitude map
Fig. 3.3 (a) Geometry of the measurement system; (b) Vicinity of E
Fig. 4.1 Schematic setup of fringe projection system
Fig. 4.2 Setup of fringe projection system
Fig. 4.3 Setup of DSSI system
Fig. 4.4 Piezosystem Jena, PX300 CAP, PZT stage
Fig. 4.5 Schematic setup of DSSI system
Fig. 4.6 Determination of the amount of shearing incorporated
Fig. 4.7 Specimen A
Fig. 4.8 Specimen B
10
11
16
16
18
20
22
28
31
46
55
59
66
67
69
69
70
71
72
72
vii
LIST OF FIGURES
Fig. 4.9 Specimen C
Fig. 4.10 Specimen D
Fig. 4.11 Specimen E
Fig. 4.12 Specimen F
Fig. 5.1 Fringe pattern on specimen A
Fig. 5.2 Background intensity difference of FFT and phase-shifting
Fig. 5.3 (a) Wrapped phase map; (b) phase difference map
Fig. 5.4 Speckle fringe pattern (1.2 N load)
Fig. 5.5 (a) Smoothened fringe pattern by band-pass filtering; (b)
Wrapped phase map (1.2 N load)
Fig. 5.6 (a) Wrapped phase map obtained using 3-frame algorithm; (b)
Phase map smoothened by sine / cosine filter (1.2 N load)
Fig. 5.7 Speckle fringe pattern (5.3 N load)
Fig. 5.8 (a) Smoothened fringe pattern by band-pass filtering; (b)
Wrapped phase map (5.3 N load)
Fig. 5.9 Smoothened wrapped phase map by 3-frame algorithm (5.3 N
load)
Fig. 5.10 (a) Calculated and theoretical phase shift; (b) Absolute mean
difference between calculated and theoretical deformation phase
Fig. 5.11 Comparison of the slope distribution of section A-A indicated in
Fig. 5.10 obtained by the proposed method and by the theoretical
predication of thin-plate-deformation
Fig. 5.12 CCD camera-recorded intensity
Fig. 5.13 Cross-section after resetting the intensity of intermediate pixels
Fig. 5.14 Wrapped phase values obtained from intensities
73
73
74
74
75
76
77
78
78
79
80
80
81
82
83
84
85
85
Fig. 5.15 Sawtooth fringe pattern projected on specimen C 86
Fig. 5.16 Intensity along section A-A on Fig. 5.15 87
Fig. 5.17 Section A-A after modification of intermediate pixel’s intensity 87
Fig. 5.18 Phase values of section A-A converted from intensities 88
viii
LIST OF FIGURES
Fig. 5.19 Wrapped phase map extracted from the sawtooth fringe pattern
89
Fig. 5.20 Profile of section B-B, indicated in Fig. 5.18, obtained by (a) one-
frame sawtooth profilometry method and contact profilometer; (b)
PMP and contact profilometer
90
Fig. 5.21 Projected fringe pattern on specimen D
92
Fig. 5.22 3-D plot of region (a) ABCD x-direction pattern change, (b)
EFGH y-direction pattern change, in Fig. 5.21
92
Fig. 5.23 The effect of (a) , (b) phase shift in y direction on SFC
o
30
o
60
93
Fig. 5.24 (a) Effect of x direction phase shift on SFC; (b) fitting error
94
95
Fig. 5.25 Wrapped phase map of specimen D
97
Fig. 5.26 (a) Branch-cuts generated by the branch cut algorithm; (b) results
of the branch cut unwrapping algorithm
98
Fig. 5.27 (a) TFC map; (b) results by TFC-guided unwrapping
99
Fig. 5.28 (a) SFC map (without fitting error); (b) results by SFC-guided
unwrapping (without fitting error)
100
Fig. 5.29 (a) SFC map (with fitting error); (b) results by SFC-guided
unwrapping (with fitting error)
103
Fig. 5.30 (a) Phase derivative variance map; (b) unwrapped results guided
by variance map
104
Fig. 5.31 (a) Pseudo-correlation quality map; (b) Unwrapped results guided
by pseudo-correlation map
105
Fig. 5.32 (a) Plane-fitting quality map; (b) Unwrapped results guided by
plane-fitting map
107
Fig. 5.33 (a) Sinusoidal signal with high frequency at the center; Density
curve obtained by setting the scale increment step (b) with 1.0; (c)
with 0.2; (d) with 1.0 and a mean filter
109
Fig. 5.34 (a) Sinusoidal signal with additive noise; (b) CWT magnitude
map; Density curve obtained by setting the scale increment step
(b) with 1.0; (c) with 0.2; (d) with 1.0 and a mean filter
110
Fig. 5.35 Vertical fringe pattern
111
Fig. 5.36 (a) Intensity along sections A-A and B-B; Density curve along A-
A and B-B (b) without noise reduction weight; (c) with weight
ix
LIST OF FIGURES
Fig. 5.37 Density map of the vertical fringe pattern 112
Fig. 5.38 Circular fringe pattern with parabola density distribution 113
Fig. 5.39 Density map of the circular fringe pattern 114
Fig. 5.40 (a) Specimen E with carrier fringes in the x direction; (b)
unwrapped phase map.
115
Fig. 5.41 Phase distribution after removal of (a) a linear carrier; (b) a carrier
obtained by 2
nd
-order line-fitting.
116
Fig. 5.42 Comparison of results obtained by 2
nd
order curve-fitting, linear
carrier removal, and contact profiler
117
Fig. 5.43 (a) Specimen E with carrier fringes in an arbitrary direction; (b)
phase distribution after the removal of a carrier obtained by
independent line-fitting in the x and y directions.
118
Fig. 5.44 Specimen F with carrier fringes in an arbitrary direction
119
Fig. 5.45 Phase distribution after the removal of (a) a linear carrier; (b) a
carrier obtained by 2
nd
-order surface fitting.
120
Fig. 5.46 Comparison of results obtained by 2
nd
order surface-fitting, linear
carrier removal, and contact profiler
121
x
LIST OF SYMBOLS
LIST OF SYMBOLS
a Scale parameter of continuous wavelet transform
a
r
Scale of a wavelet ridge
b Shift parameter continuous wavelet transform
den Fringe density
den
x
Fringe density component in the x direction
den
y
Fringe density component in the y direction
Er Least squares error (penalty) function
f Frequency of the carrier fringes
h Height of object
I Light intensity
I
0
Background light intensity
I
A
Light intensity after loading of an object
I
B
Light intensity before loading of an object B
I
exp
Experimentally recorded light intensity
I
i
Light intensity of ith frame
I
M
Modulation light intensity
I
max
Maximum intensity value
I
min
Minimum intensity value
I
o
Light intensity of object speckle field
I
r
Light intensity of reference speckle field
j
1−
K
x,y
Slope criterion of a plane
xi
LIST OF SYMBOLS
l Distance from the exit pupil of imaging optics to the reference plane
m, n Variables
M, N Constant
Mor Morlet wavelet function
Q Phase quality
s Signal function
S Continuous wavelet transform (CWT) coefficient function
t
1
, t
2
Translating parameters
U Set of pixels
x, y Variables
δ
Phase shift between fringe or speckle patterns
δ
i
Phase shift introduced in the ith phase-shifted fringe patterns
φ
Phase of a physical quantity to be measured
φ
E
Phase measurement error
φ
c
Carrier fringes-related phase component
φ
obj
Unwrapped phase map in the measurement of an object
φ
ref
Unwrapped phase map in the measurement of a reference plane
φ
s
Shape-related phase component
φ
w
Wrapped phase
γ
Fringe contrast
γ
S
Spatial fringe contrast (SFC)
γ
T
Temporal fringe contrast (TFC)
θ
Speckle-related phase
0
ω
Frequency of the Morlet wavelet
xii
LIST OF SYMBOLS
s
ω
Instantaneous frequency of a signal
A Series coefficient vector
B Experimental phase data vector
X Spatial variable matrix
Im[ ] Imaginary part of a complex-valued argument
Re[ ] Real part of a complex-valued argument
sign[ ] Sign of an argument
W[ ] Wrapping operator that wraps a phase angle into [-π, π]
Average operator
xiii
CHAPTER ONE INTRODUCTION
CHAPTER ONE
INTRODUCTION
The basic approach in optical metrology is to use an optical technique to record a
physical quantity of interest. The recorded data are subsequently analyzed manually or
automatically to provide quantitative evaluation of the physical quantity. For this
reason, an optical measurement process is normally composed of data recording and
processing.
1.1 Optical techniques and applications
Optical data-recording techniques encompass a broad range of coherent and incoherent
light based methods. The former are based on the physical properties of light wave
such as interference and diffraction; while the latter are related to the geometrical
features of light beams. Typical coherent methods are interferometric optical testing,
holography, speckle interferometry and shearography.
Interferometers such as Newton and Fizeau interferometers are most widely
used in testing the quality of optical systems and components (Malacara, 1991). The
basic setups of these interferometers have been known for a long time, but depending
on applications, they can be modified into various forms. Moreover, a well adjusted
interferometric system can even produce interference pattern from incoherent light
fields; therefore, Newton and Mirau interferometers also play a significant role in
applications of white (incoherent) light interferometry.
The implementation of holography technique essentially relies on the coherent
light source – laser. Though the fundamental theory of holography was proposed by
1
CHAPTER ONE INTRODUCTION
Garbo in 1948, a flourish of this technique in the early 1980s was brought on by the
advent of laser. Owing to the large number of researchers in this area, the applications
of holography are abundant. From static deformation measurement with double-
exposure technique to dynamic event study using sandwich holography setup,
holography has established itself as one of the most promising techniques in the field
of optical metrology.
In exploring the measurement limits of holography, researchers discovered a
new phenomenon called speckle (Dainty, 1984). Speckle, formed by self-interference
of a large number of random coherent light beams, hinders high-resolution hologram
microscopy; and therefore in the past researchers tried different methods to reduce
speckles (Mckechnie, 1975). The turning point occurred when it was realized that the
speckle, a seemingly random phenomenon, is also an information carrier that could
record displacement, surface roughness or shape. Nowadays, the study of speckle-
related methods has become a self-contained research discipline. The electronic
speckle pattern interferometry (ESPI) has many advantages over traditional techniques.
The most significant improvement is that optical data are recorded in digital form that
facilitates the integration of optical measurement with computer-based data processing.
Speckle shearing interferometry called Shearography (Leendertz and Butters,
1973; Hung, 1974) is a branch of speckle method that generates the derivatives of
displacement. Compared with speckle interferometry, shearography is more insensitive
to environmental vibration and therefore suitable for in-situ measurement.
Shearography has been successfully applied to nondestructive testing in the car
industry and other areas.
In contrast to coherent methods, incoherent methods are able to work with a
broad-band light source. Typical examples are photoelasticity, moiré, fringe projection
2
CHAPTER ONE INTRODUCTION
and digital image correlation. Photoelasticity is the earliest optical technique that
gained wide acceptance in industry (Hearn, 1971). Currently, it is used on problems
that cannot be easily solved by other methods. Moiré (Durelli, 1970), on the other hand,
did not receive much attention at its early days. The specimen-grating preparation and
relatively low sensitivity restricted the application of moiré for large deformation
measurement. Over the years, the versatility of moiré method was explored in an
increasing number of applications such as the measurement of in-plane, out-of-plane
deformation, slope, curvature, and topographic contouring. Furthermore, the
development in the ability to manufacture and print high-frequency specimen gratings
has enabled moiré methods to reach interferometric sensitivities.
Fringe projection technique (Takeda, 1983) was proposed to achieve rapid,
non-contact, full-field assessment of an object surface profile. Depth information of an
object is encoded into deformed fringe patterns recorded by an image acquisition
sensor. The decoding process is implemented in a computer based on similar data
processing methods used for interferometric, speckle and moiré fringe patterns. The
advantage of fringe projection technique is that using a digital projection device such
as programmable liquid crystal display (LCD) projector, fringe density, intensity and
pitch can be changed digitally without modifying the physical setup. This greatly
facilitates research and development work and enables compact measurement systems
based on fringe projection.
Digital image correlation (Chu, 1986) is relatively new in optical metrology. It
largely relies on the latest computer technology. The measurement system contains one
or two digital cameras that capture an object surface image before and after
deformation. Using advanced image correlation algorithms, images at two states are
compared patch by patch resulting in a displacement pattern. Digital image correlation
3
CHAPTER ONE INTRODUCTION
has been applied to analyze a variety of engineering problems such as the measurement
of crack-tip displacements and velocity of the fluid flow.
After all, driven by the requirement of industry for nondestructive, high
precision measurement, optical techniques are playing a much more important role in
field of metrology today than ever before. New methods and techniques are proposed
at an increasing rate. Smart measurement systems that originate in the research field
today would become commercially available in the market a few years later. This is
mainly due to the development of computer technology that offers rapid data
acquisition and automatic data processing. A computer-based measurement system
provides high-speed analysis and systematic management of results. The ongoing trend
of optical measurement system with computer interface would in return bring in new
topics into the realm of research.
1.2 Data-processing methods
A number of optical data-recording techniques such as holography, speckle
interferometry, moiré and fringe projection record physical quantities like deformation,
shape, temperature, refractive index and other parameters, into a specific form of
image data – fringe pattern. A fringe pattern is produced either by coherent
interference of light fields or by incoherent projection of a periodical light structure
onto a test object surface. It encodes physical quantities of interest into intensity
fluctuations. In order to retrieve the measurement results, a process known as fringe
analysis must be incorporated. Techniques for fringe pattern analysis are as old as
interferometric methods. However, before integrating with computer technology,
fringe analysis was confined to manual fringe-counting. The real boost in automatic
fringe analysis began in early 1980s. Processed by computer-based algorithms, a fringe
4
CHAPTER ONE INTRODUCTION
pattern is converted to a phase map that provides direct assessment of the physical
quantities being measured.
In early 1990s, research in automatic fringe analysis gradually split into two
domains. The first deals with a process that extracts a wrapped phase map from fringe
patterns. Wrapped phase refers to a phase value that is wrapped in one cycle: (-π, π] or
[0, 2π). The choice of wrapped phase extraction algorithm is related to the data-
recording techniques used. Although a few algorithms are generally applicable to
various measurement setups, a large number of processing methods are specifically
designed for a particular optical technique. The second domain studies phase
unwrapping problems. In a phase unwrapping process, a wrapped phase map with
multiples of 2π jumps between fringe periods is converted to an unwrapped phase map
with a continuous distribution. Normally, an unwrapped phase value is related to the
physical quantity of interest and the measurement results are readily obtainable
through a phase-to-actual quantity conversion. Phase unwrapping is relatively
independent from optical techniques and an unwrapping algorithm is generally
applicable to wrapped phase maps extracted by different methods.
The separation of wrapped phase extraction and phase unwrapping is
essentially owing to two factors. Firstly, it is easier to retrieve a phase value wrapped
in one cycle at an early stage without considering the fringe order because intensity
fluctuation in a fringe pattern is continuous and no apparent periodical indicator for
fringe order is available. When a wrapped phase map is obtained, there would be 2π
phase jumps between fringe periods. This information facilitates the determination of
fringe order, based on which one can add or subtract multiples of 2π from a phase
value. Secondly, research in phase unwrapping is not restricted to optical metrology.
Researchers in other disciplines such as synthetic aperture radar (SAR), acoustic
5
CHAPTER ONE INTRODUCTION
imaging, medical imaging, and aperture synthesis radio astronomy, also put a lot of
effort in developing various phase unwrapping algorithms (Ghiglia, 1998). Since the
input of an unwrapping algorithm is a wrapped phase map regardless of how it is
obtained, many effective algorithms developed in these disciplines are brought into
optical metrology. Consequently, the fringe analysis process gradually evolves into
wrapped phase extraction and phase unwrapping.
In recent years, with the rapid development of computer technology, automatic
fringe analysis has received unprecedented enthusiasm. Several new areas are explored.
One of them is the direct retrieval of continuous phase map from a fringe pattern
without the intermediate step of wrapped phase extraction. This approach works well
in an environment with good signal to noise ratio but its application needs to be further
extended. Another area is the temporal fringe analysis, in which the spatial operation
of phase unwrapping is completely avoided. Temporal approach is able to solve many
problems, such as discontinuous profile measurement, that are difficult to handle in
phase unwrapping. However, it requires large amount of data and the data-processing
is extensive. The third area is technique-oriented fringe analysis. In this domain, data
processing methods are proposed based on specific measurement techniques to solve
very special problems. Although they may not be applicable for general purpose, they
could provide a good solution for a particular problem under consideration.
1.3 Objective of study
The main objective of this study is to develop optical phase evaluation techniques for
fringe projection and digital speckle measurement, and to overcome existing problems
in the area of optical fringe analysis. Specifically, (1) In the first stage, a three-frame
wrapped-phase-extraction method and a sawtooth profilometry method are developed
6
CHAPTER ONE INTRODUCTION
to simplify data-recording procedure. (2) In the second stage, a spatial-fringe-contrast
and a plane-fitting phase quality criteria are developed to facilitate the phase
unwrapping process and a fringe density estimation method is proposed to enhance the
performance of various spatial filtering techniques. (3) In the final stage, which deals
with post-processing of unwrapped phase maps, a carrier phase component removal
technique is proposed.
1.4 Outline of thesis
The thesis is organized into six chapters. In Chapter 1, a brief introduction of different
optical techniques and data-processing methods is given.
In Chapter 2, the fringe projection and digital speckle methods together with
their specific data-processing algorithms are reviewed. Existing carrier removal
strategies are discussed. The significance of phase quality in facilitating a phase
unwrapping process is also emphasized.
In Chapter 3, the theory of the proposed phase evaluation techniques, including
wrapped phase extraction, phase quality identification, and carrier phase component
removal, is presented.
In Chapter 4, the experimental work based on fringe projection and digital
speckle shearing interferometry is presented. The specifications of specimens used in
this study are included.
In Chapter 5, results obtained by the conventional and proposed methods are
compared. The advantages, disadvantages and accuracy of the proposed methods are
analyzed in detail.
In Chapter 6, the findings of this study are concluded and future research
directions are recommended.
7
CHAPTER TWO LITERATURE REVIEW
CHAPTER TWO
LITERATURE REVIEW
2.1 Fringe projection measurement
Fringe projection was a technique suitable for measurement of three dimensional (3-D)
shape of an object and, depending on the incorporated data-processing strategy, it was
also referred to as a certain profilometry method such as Fourier transform
profilometry (FTP) or phase measuring profilometry (PMP). A good review paper on
optical methods for 3-D shape measurement (Chen et al, 2000) showed that compared
with other optical methods, the measurement system of the fringe projection technique
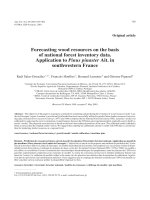
was relatively simple, as illustrated in Fig. 2.1.
Projection unit
Imaging unit
Reference plane
Object
Fig. 2.1 Typical fringe projection measurement system
The system consisted of a projection and an imaging unit. Fringe patterns from
the projection unit could be generated in several ways. A square or sinusoidal pattern
grating was commonly used as the source of the fringes (Takeda and Mutoh, 1983; Li
et al, 1990) before the advent of the digital projection device. A fringe projection
system with a digital projector, such as the liquid crystal display (LCD) projector or
8
CHAPTER TWO LITERATURE REVIEW
the digital mirror device (DMD), would be much more flexible than that using a
physical grating (Quan et al, 2001). With a digital projection unit, the phase shifting,
fringe density, intensity and other parameters could be changed digitally without
modifying the measurement setup. Furthermore, the digital instruments enabled new
data-processing strategies (Fang and Zheng, 1997; Sjodahl and Synnergren, 1999) as
well as compact measurement systems. In contrast to the diverse choices of a
projection unit, the imaging unit currently adopted was almost unexceptionally a
charged couple device (CCD) camera, since it provided convenient means for access to
an analogue image.
Based on the fundamental principle of triangulation, a fringe pattern projected
onto a test object would encounter shape deformation due to the surface height
variation. The objective of data-processing is to retrieve the object height distribution
from the deformed fringe pattern. The following sections provide a thorough review of
wrapped phase extraction methods for the fringe projection technique.
2.1.1 Fourier transform profilometry
Fourier transform profilometry (FTP) was introduced by Takeda et al. (1983). In the
paper, Takeda analyzed two kinds of experimental setup originally used in projection
moiré topography (Idesawa et al, 1977): crossed-optical-axes and parallel-optical-axes
geometry. The former was more applicable to FTP, since it would lead to a compact
projection unit. It was also widely adopted in digital projection devices. Figure 2.2
shows the crossed-optical-axes geometry. The projection axis P
1
P
2
and imaging axis
E
1
E
2
intersect at point O on a reference plane. The distance between P
2
and E
2
(the exit
pupil of the projection and imaging optics, respectively) is d, and the distance from E
2
9
CHAPTER TWO LITERATURE REVIEW
to the reference is l. Point A is arbitrary point on the object surface. Points B and C are
the intersections of P
2
A and E
2
A with the reference plane, respectively.
Fig. 2.2 Crossed-optical-axes geometry
P
1
E
1
l
C
B
A
d
h
Reference plane
Object
P
2
E
2
O
A periodical light structure, called carrier fringes, was projected onto the object
surface. The recorded intensity variation can be expressed by a Fourier expansion
[]
∑
∞
=
++=
1
0
),(2exp),(
2
1
),(),(
n
nM
yxnfxcyxIyxIyxI
φπ
[
∑
−
−∞=
++
1
),(2exp),(
2
1
n
nM
yxnfxcyxI
φπ
]
(2.1)
where I is the recorded intensity, I
0
represents the background intensity, I
M
represents
the modulation intensity, c
n
is the coefficients of the Fourier series, f is the frequency
of the carrier fringes, and
φ
is the phase modulation due to the height variation. The
intensity pattern was transformed to the frequency domain, where a band-pass filter
was applied to select the positive fundamental frequency component ( ), as shown
in Fig. 2.3. Frequency components outside the filtering window were set to zero and an
inverse Fourier transform of the filtered spectrum would give a complex-valued
intensity distribution
1=n
10
CHAPTER TWO LITERATURE REVIEW
[][
{}
),(2sin),(2cos ),(
2
1
),(' yxfxjyxfxyxIyxI
M
φπφπ
+++=
]
(2.2)
where I’ is the intensity given by the inverse Fourier transform, and j represents
1−
.
Fig. 2.3 Band-pass filter in the frequency spectrum
Negative
fundamental:
n = -1
Positive
fundamental:
n = 1
Zero-order: n = 0
0 f
-f
Filtering
window
Subsequently, a wrapped phase map could be obtained from I’
[]
[
]
[]
),('Re
),('Im
arctan),(2
yxI
yxI
yxfxW =+
φπ
(2.3)
where W[ ] denotes a wrapping operator that wraps a phase angle into [-π, π], Im[ ] and
Re[ ] denotes the imaginary and the real part of a complex-valued argument. A phase
unwrapping process could remove 2π phase jumps and retrieve a continuous phase
distribution. The resultant phase distribution contained a carrier phase component 2
π
fx
and the object shape-related phase
φ
. In order to remove the carrier phase component
introduced by carrier fringes, Takeda and Mutoh (1983) proposed to measure the phase
distribution of a reference plane without an object. On subtracting the phase map
measured without the object from the one with the object, the shape-related phase map
could be obtained. Other researchers did also propose alternative approaches for the
carrier removal, which will be discussed in detail in a later section.
11