Structural basis of protein stability at poly extreme crystal structure of amya at 1 6 a resolution 3
Bạn đang xem bản rút gọn của tài liệu. Xem và tải ngay bản đầy đủ của tài liệu tại đây (206.4 KB, 9 trang )
59
CHAPTER 3
BIOPHYSICAL CHARACTERIZATION OF AmyA
3.1 INTRODUCTION
Biophysical approaches, which are complementary to detailed molecular
protein structures from crystallography, can provide data that reveal insights into how
proteins
behave in solution and how they interact dynamically with each
other. From
X-ray
studies one may get three-dimensional
structures with different ligands bound
or structures at different conditions. From solution spectroscopy
one may get a
continuous variation of distribution of structures
between several conditions, e.g.
ligand binding, pH, temperature and salt concentration. The complete understanding
of the shape, size and thermal stability of proteins requires different biophysical
approaches.
Classical biophysical
analyses to determine size, shape, and solution properties
of
proteins have been around since the time of viscosity measurements
and
sedimentation analysis using the analytical ultracentrifuge. The size and shape of
molecules can be estimated by monitoring
the movement of these molecules in a force
field such as centrifugal
force for sedimentation, gravity for gel filtration, and
electrical
potential for electrophoresis.
The stability of a native protein structure at different conditions can be
assessed by measuring the change in the Gibbs free energy, ΔG, for
unfolding by
temperature or denaturant, as monitored by UV or florescence spectroscopy. A
combination of these methods is frequently the most effective
means to characterize
proteins. Since AmyA is active and stable in a wide range of salt concentration at high
temperature, it is important to know how AmyA behaves in solution at different salt
60
concentration. To understand the mechanisms by which AmyA in solution handles
two extreme conditions we carried out a series of biophysical experiments.
3.2 MATERIALS AND METHODS
3.2.1 Circular dichroism (CD) measurements
CD measurements were made with a Jasco J-715 spectropolarimeter equipped
with a Peltier cell holder and a PTC-348WI temperature controller. A cuvette with 0.1
cm pathlength was used throughout. A protein concentration of 0.1 mg ml
-1
(determined by the Bradford assay method) was used for wavelength scans. For
wavelength scans, a scan rate of 10 nm min
-1
was used with a time constant of 4 s and
3 scans were averaged. Data were collected at 65 ºC over a wavelength range of 190-
260 nm with a bandwidth of 1 nm. The solvent spectrum was subtracted from the
sample spectrum. The far UV CD spectra were analyzed by the secondary structure
analysis program CDNN, version 2.1 (Böhm et al, 1992) and data from 190-210 nm
were excluded from analysis as NaCl is known to have signals in this region of the
spectrum. Thermal melting was carried out at a scan rate of 5 °C per minute at 222 nm
using protein samples at different salt concentrations in 50 mM Tris (pH 8.0) and
heated from 40 to 100 ºC.
3.2.2 Analytical ultracentrifugation
Sedimentation velocity experiments were performed with a Beckman Optima
XL-I at the Center for Analytical Ultracentrifugation of Macromolecular Assemblies
(CAUMA, University of Texas Health Science Center, San Antonio, USA). All
samples were analyzed in 50 mM Tris buffer (pH 8.0) containing varying amounts of
NaCl (0-4 M). Sedimentation velocity experiments were performed at 20 °C and
61
speeds ranging between 3,000-50,000 rpm. Absorbance samples were spun in 2-
channel epon/charcoal center-pieces in the AN-50-TI or AN-60-TI rotor. Scans were
collected at 280 nm and using interference optics in the continuous mode with 0.003
cm step size setting and no averaging. Loading concentrations ranging between 0.9-
1.2 OD were measured at the given wavelength.
Data were analyzed with UltraScan, version 6.2
(). Hydrodynamic corrections for buffer conditions
were applied according to Laue (Laue et al, 1992), and as implemented in UltraScan.
The partial specific volume of AmyA was estimated according to the method by Cohn
and Edsall (Cohn and Edsall, 1943), and as implemented in UltraScan. Data were
analyzed using the van Holde–Weischet (van Holde et al, 1978) method, which
reports sedimentation coefficient distributions for the sample. Sedimentation
coefficient distributions were transformed into molecular weight distributions by
applying the Svedberg equation and assuming a particle shape that corresponds to an
expected frictional ratio, f/f
0
.
3.2.3 Analytical gel filtration
AmyA was subjected to gel filtration chromatography using an analytical
Superdex-75 column (Amersham Pharmacia) on a Duo Flow FPLC system (Bio-Rad).
The column was equilibrated with respective NaCl concentration containing 50 mM
Tris (pH8.0). AmyA samples at different NaCl concentrations were loaded to the
column and eluted at a flow rate of 0.5 ml min
-1
.
62
3.3 RESULTS
3.3.1 Thermal stability at different salt concentrations
To understand the relationship between the presence of salt and the thermal
stability of AmyA, temperature melt experiments were carried out at different salt
concentrations. Denaturation of AmyA was monitored by circular dichroism. The
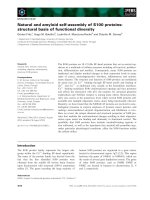
thermal stability of AmyA increases with respect to the increase in NaCl
concentration (Fig. 3.1). An increase of 7 °C in T
m
was observed at 4.7 M NaCl
concentration compared to 100 mM NaCl concentration. The thermal stability of
AmyA remains the same when NaCl was replaced with other similar monovalent salts
like KCl, NaBr, RbCl and CsCl (data not shown). However, the addition of the
bivalent salt CaCl
2
significantly increased the thermal stability of AmyA. At high
NaCl concentration, however, the presence of CaCl
2
did not show any marked
difference in the T
m
.
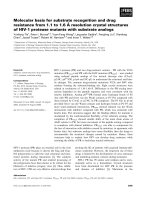
Figure 3.1 The CD spectra of AmyA at different salt concentration.
The CD spectra monitored at 222 nm demonstrating the thermal
denaturation of AmyA at different NaCl concentration.
63
On the other hand, we observed most surprisingly that AmyA showed the
maximum thermal stability in the complete absence of any salt. The protein was
extremely stable up to 100 °C when there was no salt. Furthermore, AmyA that was
pre-incubated for 30 minutes in the complete absence of NaCl in boiling water still
retained its activity (Fig. 3.2).
Figure 3.2 Activity of AmyA after temperature melt. Activity assay
of AmyA at different NaCl concentration before and after the
incubation of the AmyA sample in boiling water for 30 minutes.
Addition of as low as 5 mM NaCl or CaCl
2
to this solution decreased the
thermal stability and the melt was observed at 85 °C. To understand the
conformational changes at these conditions, the Far-UV CD spectrum of AmyA, both
in the presence and absence of salt, was analyzed (Fig. 3.3). Surprisingly, no
significant secondary structural change was detected. This indicates that AmyA
retains the overall fold at the entire salinity as seen in the low salt (lAmyA) and high
salt (hAmyA) crystal structures.
64
Figure 3.3 The Far-UV CD spectra of AmyA at different NaCl concentration.
3.3.2 Novel oligomerization and its implications for stability and function
Several studies have shown that many halophilic proteins are involved in salt
dependent oligomerization (Ishibashi et al, 2002; Jekow et al, 1999). To determine
whether AmyA undergoes any salt dependent oligomerization, we analyzed the
quaternary structure of AmyA by analytical ultracentrifugation and gel filtration
chromatography. The sedimentation behavior of the AmyA protein showed a very
strong dependence on NaCl concentration. When no salt was present, the protein had
a strong tendency to oligomerize and formed very large aggregates (Fig. 3.4).
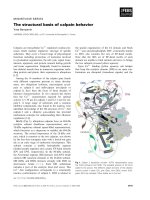
Sedimentation distributions were compared with the van Holde-Weischet
analysis, which provides model independent sedimentation coefficient distributions
that are corrected for diffusional boundary spreading (Demeler et al, 1997; Demeler et
al, 2004). By running at a relatively low speed (3000 rpm) it was possible to measure
an S-value distribution of the sample which indicated that 70% of the protein was
sedimenting with an S-value of around 85-90 S, about 25% of the protein sedimenting
65
between 20-80 S, and the remainder at larger S-values. This corresponds to aggregates
with a molecular weight distribution between 4-5.5 million Dalton with the majority
of the sample around 5 million Dalton.
Figure 3.4 Molecular weight distribution of AmyA at no salt. The
peak corresponds to a poly-dispersed aggregate of AmyA.
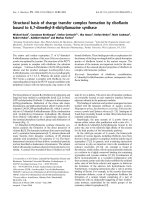
However, these aggregates retain 40% of activity when tested (Fig. 3.2).
Addition of as low as 5 mM of NaCl reversed most of the protein aggregates into the
monomeric form, sedimenting between 3.5 - 4.5 S, corresponding to the molecular
weight of the monomer (Fig. 3.5). The molecular weight and frictional coefficient
ratios were further confirmed by fitting the data from samples containing salt with
finite element solutions of the Lamm equation (Cao et al, 2005) (data not shown)
which confirmed the monomeric state for all samples containing salt.
66
Figure 3.5 Molecular weight distributions of AmyA in different
NaCl concentrations. The molecular weight of the peaks corresponds
to that of an AmyA monomer which is 55 Kilo Dalton.
Additionally, we confirmed this behavior with gel filtration chromatography.
Results from gel filtration chromatography with a Superdex-75 column at room
temperature are consistent with the results from analytical ultracentrifugation. In the
absence of NaCl, at 50 mM Tris (pH 7.5) AmyA exists in a large sized oligomeric
state (Fig. 3.6). Inter-conversion between the monomer and oligomer is strongly
influenced by salt concentration. Both the experiments indicate that in the absence of
salt AmyA forms a poly-dispersed oligomeric state without losing its tertiary structure
and activity.
67
Figure 3.6 Gel filtration profile of AmyA at different NaCl concentrations.
Oligomeric proteins are more thermostable than their monomers due to inter-
subunit interactions and often thermophilic and halophilic proteins form oligomers
(Ishibashi et al, 2002; Jekow et al, 1999; Richard et al, 2000). This indicates that
inter-subunit contacts of AmyA at the oligomeric state could be the reason why it is
very stable in the absence of salt. Also, this result suggests that AmyA
oligomerization might occur mainly through the high affinity ion binding sites that are
present on the surface. Addition of salt promotes salt binding to those sites and
removes the inter-subunit interactions. This oligomerization is very different from the
previously observed oligomerization in halophilic proteins in which oligomers are
formed at high salt concentrations due to the increase in water surface tension (Lin
and Timasheff, 1996). At low salt concentration these oligomers dissociate into
monomers and the protein loses its stability.