Analysis of 3 d maxillofacial image data 4
Bạn đang xem bản rút gọn của tài liệu. Xem và tải ngay bản đầy đủ của tài liệu tại đây (2.21 MB, 51 trang )
84
Chapter 4
Analysis of Volume Data
4.1 Introduction
In this chapter, we deal with three-dimensional volumetric data sets. Such 3-D data are
commonly provided by CT or MRI scanners. CT is especially suitable for visualizing
high-density objects such as bone, while MRI is sensitive to variations in soft tissue.
Since bone is the object of interest in this thesis, we focus on analysis of CT data sets.
CT data comprises a series of 2-D images that exhibit axial cross-sections of an object
such as a head. A CT image is a pixel map of the X-ray attenuation coefficient of the
tissue within a cross-sectional plane.
The attenuation coefficient is linearly converted
to a numerical scale named after Godfrey Hounsfield, the inventor of the first CT
scanner, as shown in Figure 4.1. The Hounsfield scale fixes the attenuation coefficient
of air at −1000H and that of water at 0H. Tooth enamel has the highest attenuation
coefficient in the human body, about 3000H. Thus, the range of the Hounsfield number
is slightly over 4000H, and at least 12-bit gray levels, equivalent to 4096 levels, are
necessary to quantize CT data without loss of information. In general, 16-bit gray
levels (65536 levels) are allocated to each pixel for the convenience of computer
hardware. In this thesis, however, we linearly transform the gray levels to 8 bits (256
levels) to make the data more workable. This does not matter because we are not
dealing with subtle variations of soft tissue.
85
Figure 4.1: Hounsfield numbers.
The skull has to be extracted from CT data for the applications in craniofacial surgery
that are concerned with the anomalies of the head and facial bones [17], [18]. The
extraction of the skull is traditionally done by thresholding [51], but the appropriate
threshold value may vary from one data set to another. It will be convenient if the
adequate threshold value for a data set at hand is determined automatically. In our
approach, background, i.e., air, is first excluded (Section 4.2.1), and then soft tissue is
removed using a histogram transformation method (Section 4.2.2).
The extraction of the mandible is important for maxillofacial surgery (or orthognathic
surgery) that is concerned with the correction of a wide range of jaw and facial
irregularities [16]−[19]. For instance, assessment of mandibular asymmetry is
considered to be an appropriate means of determining the effectiveness of
maxillofacial and orthodontic treatment [16], [19]. Currently, manual operation is
necessary for extracting the mandible, which is time-consuming and labor intensive.
We attempt to make this segmentation process automatic (Section 4.3). The
segmentation along the z-axis (i.e., between CT images) is first performed (Sections
4.3.1 and 4.3.2), and the segmentation in the x-y-plane (i.e., within a CT image) is
conducted using a double-thresholding technique (Section 4.3.3). The mandible is
86
finally segmented by region growing via connected component labeling (Section
4.3.4).
In recent years, CT has been increasingly used in orthodontic treatment as well,
because it provides 3-D information of the jaw without geometrical distortion
[20]−[25]. One of the most successful applications is in dental implantology, in which
an artificial root is surgically inserted into the jawbone to provide anchorage for a
dental prosthesis. Treatment of tooth loss with dental implants is today a routine
specialty procedure. For successful implant treatment, it is crucial to determine the
exact location of vital anatomic parts that need to be avoided during surgery. One such
internal structure is the inferior alveolar nerve (IAN), which is the branch of the
mandibular nerve that innervates the lower teeth, tongue, and lip. The IAN passes in
company with the inferior alveolar artery (jointly termed the inferior alveolar
neurovascular bundle) through a mandibular canal, the inferior alveolar nerve canal
(IAC). Violation or damage to the IAC can cause considerable complications [25].
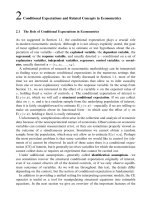
Panoramic radiography is one of the most commonly utilized radiographic techniques
in dental implantology (Figure 4.2). Panoramic images present a global view of the
shape and height of the jawbone and existing dentition for multiple implant placement,
and are widely employed for initial treatment planning or screening. However, despite
its widespread use, panoramic imaging has a number of limitations [26] in that it
provides no information about jaw thickness and suffers from a distortion factor of
about 25% [25].
87
Figure 4.2: Panoramic radiograph image.
To overcome these problems, we employ panoramic CT images (or panoramics),
which are a series of cross-sectional images along curved planes through the mandible.
In commercially available programs, panoramics are generated by reformatting a stack
of CT images [24]−[26]. Unlike panoramic radiography, these reformatted images are
free from distortion, magnification errors, and superimposition of other tissues, and
permit the accurate assessment of CT data in a manner that exceeds the information
gleaned from radiography alone [24]. These commercial programs, however, require
frequent human interventions for computing the panoramic images. In addition, none
of them is capable of automatically detecting the IAC. This could be due to the fact
that the structure of the IAC is not well defined and is often connected to adjacent
hollow spaces. It is not unlike a tube with many openings at the sides. Because of this
rather complicated structure, the accurate segmentation of the IAC remains elusive.
The problem could be exacerbated if a patient has been without teeth for a long time as
that could result in bone loss. Current software only allows the user to manually trace
the IAC for visualization purposes. In one prototype application, the IAC is modeled
with a 3-D polybezier path based on several control points specified by the user [70].
This means that the path between two consecutive control points is not related to the
88
IAC and may deviate from it significantly. To make the deviation small, many control
points will have to be specified.
In Section 4.4, we present a computerized method for extracting the IAC in panoramic
CT images. The panoramic images are generated automatically once a representative
CT slice is selected (Section 4.4.1). Hollow canals are then detected by analyzing the
voxel intensities and 3-D gradient orientations in the panoramics (Section 4.4.2).
Subsequently, we extract the axis of the IAC using a novel 3-D line- tracking
technique followed by the merging adjoining voxels to obtain the full extent of the
IAC (Section 4.4.3). Finally, the extracted canal is backprojected to the original CT
data to provide the clinicians with a visual aid for treatment planning. The method is
generic and may be used in other applications that require the extraction of tubular
structures.
We also work on the detection of other anatomic features on the jaw surface (Section
4.5). For this, we make use of the panoramic surface images of CT data (Section
4.5.1). The panoramic pseudo-reflectance image is employed for detecting a pair of
mental foramens (or foramina) (Section 4.5.2) and the panoramic range image for a
pair of mandibular foramina (Section 4.5.3). The foramina are small openings on the
mandibular surfaces through which blood vessels and nerves pass.
89
4.2 Extraction of the Skull
4.2.1 Exclusion of Background
The Hounsfield number of air and that of the human body are well separated (Figure
4.1). This can also be clearly seen in the gray-level histogram of CT data (Figure 4.3).
The histogram is bimodal, with the left peak corresponding to air (i.e., background)
and the right one the head. With the aim of extracting the skull, we first exclude the
background by selecting an appropriate threshold value between the two peaks in the
histogram.
There are a number of techniques proposed to determine a proper threshold value [73].
We have employed the Otsu method because of its reliability and computational
efficiency [71]. The threshold value determined by the method for the CT data of
Figure 4.3 was 39 (the vertical line in Figure 4.3). Figure 4.4 shows four images of the
CT data and Figure 4.5 the corresponding object maps obtained by thresholding. The
black areas are the background and the white areas the objects including the head. The
voxels in the dark areas are ignored in subsequent steps.
90
Figure 4.3: Gray-level histogram of a CT data set.
(a)
(b)
(c)
(d)
Figure 4.4: Four cross-sectional images from CT data set corresponding to the
histogram in Figure 4.3.
91
(a)
(b)
(c)
(d)
Figure 4.5: Four object maps corresponding to the four CT images of Figure 4.4
(threshold value=39).
4.2.2 Removal of Soft Tissue
We next attempt to remove the soft tissue of the head. After excluding the background,
the remaining voxels form a unimodal gray-level histogram (on the right side of the
vertical line in Figure 4.3). Since the skull occupies only a small portion of the CT
image compared with the soft tissue, the peak corresponding to the skull is far smaller
than that of the soft tissue and there is no clear valley, making it difficult to select the
appropriate threshold value.
Since the pixels in the neighborhood of an edge have larger gradient magnitudes, the
gray-level histogram for these pixels should have a single peak at a gray level between
the object and the background gray levels [72], [73]. This gray level is, therefore, a
92
suitable choice of the threshold value. We apply this idea to CT data to determine a
proper threshold value for separating the soft tissue from the skull. Just like their two-
dimensional counterparts, 3-D edges are also defined as discontinuities in image
intensity caused by the transition from one homogeneous 3-D region to another 3-D
region of a different mean intensity. Therefore, the intensity gradient
f∇
()
⎟
⎟
⎠
⎞
⎜
⎜
⎝
⎛
∂
∂
∂
∂
∂
∂
=∇
z
f
y
f
x
f
zyxf
,,,, (4.1)
provides information about the existence of an edge. The gradient magnitude
M
is a
useful measure of edge strength:
()
2
2
2
,,
⎟
⎠
⎞
⎜
⎝
⎛
∂
∂
+
⎟
⎟
⎠
⎞
⎜
⎜
⎝
⎛
∂
∂
+
⎟
⎠
⎞
⎜
⎝
⎛
∂
∂
=
z
f
y
f
x
f
zyxM
. (4.2)
Using the 3-D Sobel filter for obtaining a discrete approximation of the partial
derivatives in
x, y, and z directions, we apply Eqs. (4.1), (4.2), and select voxels with
large gradient magnitude. Figure 4.6 illustrates a cumulative histogram of gradient
magnitude where the horizontal line denotes the largest 10%. By doing this, the
selection of an appropriate threshold value for extracting edge voxels is automated.
The average gray level of the selected voxels serves as the threshold value of the CT
data. Figure 4.7 shows four skull maps obtained by this technique for the CT data of
Figure 4.4.
93
Figure 4.6: Cumulative histogram of gradient magnitude.
(a)
(b)
(c)
(d)
Figure 4.7: Four skull maps corresponding to the four CT images of Figure 4.4
(threshold value=96).
94
4.2.3 Results and Discussion
It should be noted that prior to the computations described above, it is necessary to
transform CT data to an isotropic volume, in which the sampling density is equal in all
three dimensions to comply with the use of the 3-D Sobel operator that is also
isotropic. CT images are usually obtained with considerable spacing between the
cross-sectional planes and the resolution in the image plane is much better than in the
direction perpendicular to it. Therefore, we would need to fill in the missing
information along the
z-axis by reconstructing extra CT images. In this experiment,
linear interpolation is used to make the voxel cubic.
Figure 4.8(a) shows 9 rendered surface images of the CT data of a child segmented at
various threshold values, while Figure 4.9(a) shows those of an adult. The central sub-
images show the segmentation result by the proposed method. In both cases, the soft
tissues are perfectly removed, while the skulls remain intact. The threshold values
were 104 for the first CT data set and 88 for the second. The threshold values for other
sub-images are varied from the center by
10
±
in raster order (Figures 4.8(b), 4.9(b)).
Obviously, the threshold values for the first sub-images (upper left) are too low and
almost all the soft tissues still remain. In contrast, the values for the last sub-images
(lower right) are too high and the skulls are excessively eroded.
The method is fully automatic and does not require intensive computation. It works
well and is robust to noise or outlying data because the threshold value is determined
by the average gray value of a group of voxels that are selected based on their gradient
magnitude. For the same reason, the method is fairly stable to the selection of the
threshold value (currently 10%) for selecting edge voxels in the cumulative histogram.
95
(a)
64 74 84
94 104 114
124 134 144
(b)
Figure 4.8: Segmentation results in a pediatric case. (a) Rendered surfaces of a CT data
segmented at various threshold values. (b) Threshold values used for each sub-image.
96
(a)
48 58 68
78 88 98
108 118 128
(b)
Figure 4.9: Segmentation results in an adult case. (a) Rendered surfaces of a CT data
segmented at various threshold values. (b) Threshold values used for each sub-image.
97
4.3 Segmentation of the Mandible
4.3.1 Extraction of Tooth Enamel
In CT data, the mandible is often in contact with the maxilla at the teeth. The key to a
successful segmentation of the mandible lies in how accurately the upper and lower
teeth are separated. We note that the surfaces of the teeth for biting are made of enamel
that has the largest X-ray attenuation coefficient in the human body (3000H). Thus, as
the first step for segmenting the mandible, we localize the contact surface by extracting
the tooth enamel, which can easily be done by thresholding. In our experiments, the
threshold value
enamel
τ
is set at 217 for CT data with 256 gray levels, equivalent to
about 2400H, which is low enough to extract tooth enamel and also high enough to
exclude cortical bones or hard bones that are below 2000H.
Figure 4.10 shows the tooth enamel voxels extracted by thresholding at
enamel
τ
. The x-
y planes correspond to axial cross-sections of a head, namely standard CT images. The
red rectangle depicts the plane determined by least-squares fitting to the extracted
enamel voxels. This plane approximates the occlusal plane (the imaginary surface at
which the upper and lower teeth touch) and will be used in the next step. The four blue
corner points encompass the region where enamel voxels are present (the enamel
region). The green voxels are those above the plane and the yellow ones below the
plane.
98
Figure 4.10: Tooth enamel extracted by thresholding and the occlusal plane determined
by least-squares fitting for the CT images in Figure 4.17. Green voxels are above the
plane and yellow ones below it.
4.3.2 Separation of Upper and Lower Teeth
In the second step, we classify all the columns (voxels along the z-axis) that contain
tooth enamel voxels into three cases (Figure 4.11).
• Case 1
There are two (or more) blocks of enamel voxels in a column. This is the case where
both the upper and lower teeth are present and the gap between them is detectable. We
find the upper boundary of the lower enamel block and use it as a separator of the
column. All the voxels above the separator are eliminated in subsequent processes.
99
• Case 2
There is only one block of enamel voxels with bone beneath it. This is the case where
the upper tooth is missing. We detect the upper boundary of the enamel block and all
the voxels above it are eliminated.
• Case 3
There is only one block of enamel voxels but adjoining air beneath it. This is the case
where the lower tooth is missing. In this case, we find the lower boundary of the
enamel block and all the voxels above it are eliminated.
For the columns inside the enamel region, but without tooth enamel, the occlusal plane
is used as a separator. In practice, we set the separator at the height of the plane plus a
slight margin (3 voxels) because the plane is only an approximation of the true
occlusal plane.
Figure 4.12 illustrates the result. The red voxels are considered as the upper teeth and
will be eliminated. The blue voxels are considered as the lower teeth and thus
registered as the mandible. The voxels separated wrongly may be corrected in a later
step (Section 4.3.4) if the erroneous blob is small.
100
Case 1 Case 2 Case 3
Separator Separator
Bone
Air
z
Enamel
Enamel
Enamel
Figure 4.11: Separation of tooth enamel in individual columns of CT data.
Figure 4.12: Separation result of upper (red) and lower (blue) tooth enamel for the CT
images in Figure 4.17.
101
4.3.3 Segmentation of the Mandible by Double Thresholding
In the third step, we extract the mandible in each CT image (i.e., x-y plane). We
employ a double-thresholding technique here in which two threshold values
bone
τ
and
enamel
τ
(
enamelbone
τ
τ
<
) are used. The lower threshold value
bone
τ
is used for
segmenting bone and is set at 110 (about 720H). The higher threshold value
enamel
τ
is
the one previously used for extracting tooth enamel. We show that the double-
thresholding technique may be a solution to the so-called partial volume effect in
which two or more tissues are present in one voxel.
Figure 4.13 illustrates a part of a hypothetical CT image containing the tips of both the
lower and upper incisors. Due to the limited spatial resolution, some of the voxels
contain part of the tooth tips together with air. The resulting intermediate intensity
values often cause false segmentation. Figure 4.14 (left) illustrates the enamel voxels
segmented at
enamel
τ
in the same 5×3 grid of Figure 4.13, while Figure 4.14 (right)
shows the bone voxels segmented at
bone
τ
, displaying an unwanted connection because
of the partial volume effect. The intensity value of enamel is so high that the intensity
value of the voxels between the two incisors becomes higher than
bone
τ
.
To separate this false connection, we use the higher threshold value
enamel
τ
for the
voxels surrounding the extracted tooth enamel as shown in Figure 4.15. Since we
know the locations of the enamel voxels in the first step (Section 4.3.1), it is easy to
generate the threshold map. The value of
bone
τ
can be selected automatically and
robustly by the method described in Section 4.2. This double-thresholding technique is
102
also robust to the selection of
enamel
τ
(currently 217), as the gray levels of bone (up to
200) and enamel (near 255) are far apart.
An upper incisor
A lower incisor
x
y
Figure 4.13: Partial volume effect in a CT image (x-y plane).
Bone voxelsEnamel voxels
Figure 4.14: False segmentation with an unwanted connection.
103
217
217
217
217
217
110
110
110
110
110
217
110
110
110
110
Figure 4.15: A threshold-value map.
4.3.4 Connected Component Labeling
After the segmentation of bone, a morphological operation is applied to remove
isolated voxels and also fill small holes. This can be done by switching 0 and 1
according to the majority of the 3
×3 neighborhood (the majority operation). Then we
select the component that is spatially connected to the bone segmented in the previous
CT image (Figure 4.16). The component that overlaps with the previous component is
labeled 1, while the component without overlap is labeled 2. The component labeled 1
is registered as the mandible.
The last two steps, double thresholding (Section 4.3.3) and connected component
labeling (Section 4.3.4), are repeated from one CT image to the next until no
connected component is found.
104
Label 1
Label 2
Label 1
Previous image Current image
Figure 4.16: Connected component labeling.
4.3.5 Results and Discussion
We segmented the mandible of a dry human skull (Figure 4.17) and a patient (Figure
4.19). The former CT data comprises 200 images of 280×256 pixels and the inter-slice
space is 1 mm. The latter CT data is made up of 180 images, each of 256
×384 pixels,
and the inter-slice spacing is 0.7 mm. Figures 4.18 and 4.20 show the segmented
mandibles in four viewpoints, respectively. The structure of the mandible is well
extracted with fine details. However, close observation reveals that parts of the lower
teeth are eroded and parts of the upper teeth are attached to the mandible. The accuracy
of the segmentation largely depends on the inter-slice distance of CT data. When the
inter-slice space is wide, and the upper and lower teeth are in full contact, the perfect
segmentation of the mandible will become almost impossible. There should be some
gaps between the upper and lower teeth to give rise to the partial volume effect.
The algorithm described here does not require lengthy processing time and works well
when the inter-slice spacing is not too wide (
m
m
1
≤
). One limitation of the method is
that it is not applicable to CT data of children because they have tooth buds of the
105
permanent teeth embedded within the mandible and thus the tooth enamel spreads
widely. This problem may be overcome by finding the occlusal plane that maximizes
the number of enamel voxels within it, instead of using least-squares fitting.
Figure 4.17: Dry skull.
Figure 4.18: Segmented mandible from the dry skull shown in Figure 4.17 in four
views.
106
Figure 4.19: Head of a patient.
Figure 4.20: Segmented mandible from a patient in four views.
107
4.4 Extraction of the Inferior Alveolar Nerve Canal
4.4.1 Computation of Panoramic CT Images
With the aim of extracting the IAC, we generate a series of panoramic CT images by
reformatting the original CT data. The data used in our investigation comprises 90
images of 512×512 pixels with 8-bit gray levels. The resolution in the image plane is
0.41 mm × 0.41 mm, while the inter-slice distance is 0.5 mm. The procedure consists
of the following steps.
Step 1: Select a slice of CT image that contains the mandible.
Step 2: Extract objects by thresholding.
Step 3: Fill holes.
Step 4: Select a target object (i.e., the mandible) if there is more than one object.
Step 5: Determine the midline of the mandible.
Step 6: Apply curve fitting to the midline and obtain the base curve.
Step 7: Generate a set of offset curves parallel to the base curve.
Step 8: Set up equally spaced sample points on the set of offset curves.
Step 9: Compute the intensity values of these sample points by interpolation.
Step 10: Repeat Step 9 for other CT images that contain the mandible.
Figure 4.21(a) shows a CT slice that contains a portion of the mandible (Step 1). The
selection of the first CT image is conducted manually, but subsequent steps are fully
automated. The objects in the image are extracted by Otsu thresholding (Step 2, Figure
4.21(b)). The holes are filled (Step 3, Figure 4.21(c)), and the target object (mandible)
is selected if there is more than one object present (Step 4, Figure 4.21(d)).
108
(a)
(b)
(c)
(d)
Figure 4.21: First four steps for computing panoramic CT images. (a) A CT image
with a mandible (Step 1). (b) After thresholding (Step 2). (c) After filling (Step 3). (d)
Selected target object (Step 4).
The midline of the mandible is determined by a morphological operation such as
thinning or skeletonizing (Step 5). We utilize the thinning operation provided by
MATLAB [74]. Figure 4.22 shows the extracted midline superimposed on the contour
of the mandible.