Synthesis and characterization of novel jacketed polymers and investigation of their self assembly and application 4
Bạn đang xem bản rút gọn của tài liệu. Xem và tải ngay bản đầy đủ của tài liệu tại đây (621.53 KB, 26 trang )
Chapter 4
Synthesis and characterization of novel polymeric
complexes with side-chain pyrimidine groups
112
4.1 Introduction
Polymeric complexes in the solid state are considered to be promising for the
development of smart materials that are characterized by the formation of supramolecular
structures through self-assembly process. Self-assembled materials formed by the
noncovalent bonds have attracted much interest owing to easy synthesis and high
processibility
1,2
.
Complexes between polymers and amphiphilic surfactants through noncovalent bonding
offer novel properties and phase structures not possessed by the individual components.
In the solid state, the complexes self-assemble into ordered structures via a delicate
balance of attractive and repulsive interactions. Dynamic molecular complexes can be
prepared via the self-assembly process using non-covalent bonding. For example,
hydrogen-bonded liquid crystal polymers, which include main-chain, side-chain, and
network structures, have been prepared by the self-organization of polymers and small
molecules. The noncovalent interactions play a key role in the formation of assembled
structures, and possibility to design novel functional materials
3
.
Kato et al. reported first supramolecular hydrogen bonded liquid crystalline polymeric
complexes
4
, in which polyacrylate with a benzoic acid moiety on the side chain was
complexed with stilbazole ester moiety. The complexes showed a nematic phase up to
252 °C. Ionic interaction, metal coordination and hydrogen bonding interactions were
employed to form ordered nanostructures
5-10
.
Kato et al. also reported complexes formed via poly(vinylpyridine) and nonadecylphenol
exhibited layered smectic structures due to the microsegregation of different amphiphilic
groups.
11
Antonietti et al. have studied polyelectrolyte-surfactant (eg. poly(n-
113
alkyltrimethylammonium styrene sulfonate) complexes which show an ordered lamellar
structure with ionic and nonpolar alkyl layers organized in an alternating layers
12-13
.
Ikkala et al. reported the formation of hierarchical structures from a complex prepared
from polystyrene-block-poly(4-vinylpyridine), pentadecylphenol, and methane sulfonic
acid
14-15
. Two structural changes occurred in the lattice: microseparation of block
copolymers and complexation as a function of temperatures cause drastic electrical
conductivity changes. By tailoring the relative ratio of the components, lamellar and
cylindrical structures were obtained
14-20
. Hollow cylinders were formed in a glassy rigid
PS medium from polystyrene-block-poly(4-vinylpyridine), and pentadecylphenol. Part of
the supramolecular template (pentadecylphenol) can be conveniently removed after the
structure has been formed
17-19
.
In general, when there is a good balance between attractive and repulsive interactions,
microphase-segregation is induced in the system. The phase behaviors of polymer-
amphiphilic systems can be modified through tailoring the attractive and repulsive
interactions in the systems. This can be realized via modifying the length of the alkyl
chain and change of the interaction of hydrogen bonding. Here we report the structure
properties investigation of polymers poly (4-dodecyloxy-2,5- bis(pyrimidin-5-yl)-phenyl-
1-yl methacrylate), poly(4-pyrimidin-5-yl-phenyl methacrylate) with the pyrimidine
group as the base functional group, study the complexes formed via host polymers with
pyrimidine groups and alkyl sulfonic acid and investigate their self-assembling properties
in the solid state.
114
4.2 Experimental section
4.2.1 Materials and reagents
All reagents and solvents were obtained from commercial supplies and used without
further purification unless noted otherwise. Tetrahydrofuran (THF) was distilled over
sodium and benzophenone under N
2
atmosphere. N,N-dimethylformamide (DMF) was
dried with molecular sieves (4 Å, Aldrich). Flash column chromatography was performed
using 60-120 mesh silica gel (Aldrich). Dibenzoyl peroxide (BPO) was recrystallized
from chloroform-methanol solution as glistening crystals, and used as initiators for
polymerization.
4.2.2 Instrumentation
Fourier transform infrared (FT-IR) spectra were obtained using a Perkin-Elmer 1616 FT-
IR spectrophotometer as KBr discs.
1
H NMR,
13
C NMR spectra were recorded on a
Bruker ACF 300 MHz spectrometer. Differential scanning calorimetry (DSC) and
thermogravimetric analyses (TGA) were recorded using a TA-SDT2960 and a TA-DSC
2920 at a heating rate of 10 °C min
-1
under N
2
environment. Gel permeation
chromatographic (GPC) analysis were conducted with a Waters 2696 separation module
equipped with a Water 410 differential refractometer HPLC system and Waters Styragel
HR 4E columns using THF as eluent and polystyrene as standard. The XRD patterns
were recorded on a powder diffractometer with a graphite monochromator using 1.54 Å
Cu Kα wavelength at room temperature (scan rate: 0.05
o
/s; scan range 1.5-30
o
). A Zeiss
Axiolab POM equipped with a Linkam LTS 350 hot stage was used to observe
anisotropic textures. All AFM images were recorded with a Digital Instruments (DI)
Multimode SPM IIIa system in contact mode using square pyramid Si
3
N
4
probes (25 °C,
115
in air). All films were prepared using spin coating of polymer solutions in THF (0.5
mg/ml) onto a glass slide at 2000 rpm. Melting points (Mp) were obtained on a BÜCHI
Melting Point B-540 apparatus and are uncorrected.
4.2.3 Synthesis of the host polymer
The host polymers: poly(4-pyrimidin-5-yl-phenyl methacrylate) (P1), poly (4-
Dodecyloxy-2,5-di(pyridin-5-yl)phenyl-1-yl methacrylate) (P2), poly (4-Dodecyloxy-
2,5-di(pyrimidin-5-yl)phenyl-1-yl methacrylate) (P3) were synthesized according to
Scheme 4.1.
OH
Br
OBn
Br
OBn
B(OH)
2
NN
Br
NN
OBn
NN
OH
ClO
OO
NN
BnBr
K
2
CO
3
/DMF
i,n-BuLi/THF
ii, B(O-i-Pr)
3
Pd(PPh
3
)
4
Toluene/EtOH/2M Na
2
CO
3
Pd/C
H
2
Et
3
N/THF
BPO/THF
O O
NN
n
1
2
3
4
5
6
P2
N
N
N
N
O
OC
12
H
25
O
n
P1
BPO/THF
N
N
N
N
O
OC
12
H
25
O
116
OBn
OC
12
H
25
B(OH)
2
(HO)
2
B
N
Br
Pd(PPh
3
)
4
Toluene/EtOH/2M K
2
CO
3
NN
OBn
C
12
H
25
O
NN
OH
C
12
H
25
O
H
2
Pd/C
NN
O
OC
12
H
25
O
OO
NN
OC
12
H
25
n
O Cl
Et
3
N
BPO/THF
7
8
9
P3
Scheme 4.1. Synthesis route for monomer and polymers
1-benzyloxy-4-bromo-benzene (2)
In a 250 ml round-bottom flask with a stirring bar was placed 17.3 g 1,4-dibromophenol
(0.1 mol), 27.3 g K
2
CO
3
(0.2 mol) and 150 ml acetone. The mixture was purged with N
2
for 20 min, heated to 60-70 °C under nitrogen atmosphere. 17.8 ml (0.15 mol) of benzyl
bromide was added dropwise. After finishing the addition, the reaction mixture was
stirred for 18 h, cooled to RT and filtered. The solution was concentrated and poured into
water. The pH of water was adjusted to about 6. The resulted precipitate was
recrystallized in ethanol to yield a white crystal. Yield: 21.4 g (81.6 %).
1
H NMR (300
MHz, DMSO-d6, δ ppm) 7.45 - 6.97 (m, Ar-H, 9 H), 5.09 (s, Ar-CH
2
-O, 2 H).
13
C NMR
117
(75.4 MHz, DMSO-d
6,
δ ppm) 157.5, 136.6, 132.1, 128.4, 127.8, 127.6, 117.1, 112.0 (Ar-
C), 69.4(O-CH
2
-Ar). MS (EI): m/z: 264.0, 262.0, 91.1, 65.0. Mp: 64 °C.
4-Benzyloxy-phenyl-2-boronic acid (3)
In a 500 ml round-bottom flask with a stirring bar was placed 10.5 g (40 mmol) of 1-
benzyloxy-4-bromobenzene and 150 ml dry THF. The solution was cooled to - 78 °C and
then a 1.6 M solution of butyllithium in hexanes (75 ml, 0.12 mol) was added slowly
under a nitrogen atmosphere. The solution was stirred at -78 °C for another 2 h, followed
by the dropwise addition of triisopropylborate (50 ml, 0.18 mol). After complete addition,
the mixture was warmed to RT, stirred overnight, and mixed with 200 ml of deionized
water. The organic phase was collected and dried with MgSO
4
and filtered, and the
solvent was removed under reduced pressure. The resulted light yellow solid was
recrystallized from acetone. Yield: 8.4 g (92.2 %).
1
H NMR (300 MHz, DMSO-d
6
, δ ppm)
7.83 (s, B-OH, 2 H), 7.73-6.95 (m, Ar-H, 9 H), 5.11 (s, Ar-CH
2
-O, 2 H).
13
C NMR (75.4
MHz, DMSO-d
6,
δ ppm) 161.5, 141.6, 132.1, 128.4, 127.8, 127.6, 117.1, 112.0 (Ar-C),
68.2 (O-CH
2
-Ar). MS (EI): m/z: 228.2, 184.2, 91.1. Mp: 185 °C.
5-(4-Benzyloxyphenyl) pyrimidine (4)
A 250 ml round bottom flask equipped with a condenser was charged with 4.56 g (20
mmol) of 4-benzyloxy-phenyl-2-boronic acid and 2.12 g (13.3 mmol) of 5-bromo-
pyrimidine, 60 ml toluene, 20 ml methanol and 60 ml sodium carbonate (2M). The
mixture was degassed via 3 cycles, before the catalyst of 0.2g tetrakis
(triphenylphosphine) palladium (2 mol%) was added in dark under argon atmosphere.
The flask was degassed once more and charged with argon. The reaction mixture was
heated to 100 °C for 48h, before being allowed to cool to RT and then filtered. The liquid
118
layer was separated with a separation funnel, and the aqueous layer was extracted with
toluene (100 ml × 2). The toluene layer was combined and washed with 3 × 100 ml water
and dried over MgSO
4
. The solvent was then removed under reduced pressure, and the
resulting crude product was purified using column chromatography on a silica gel using
hexane and ethyl acetate (2:1) as the eluant. Yield: 2.5g (44.3 %).
1
H NMR (300 MHz,
DMSO-d
6
, δ ppm) 9.2 - 9.1 (m, ArH, 3 H), 7.75 - 7.12 (m, Ar-H, 9 H), 5.19 (s, Ar-CH
2
-O,
2 H).
13
C NMR (75.4 MHz, DMSO-d6, δ ppm) 158.5, 157.5, 154.0, 136.6, 132.7, 128.4,
128.1, 127.8, 127.6, 126.0, 115.0 (Ar-C), 69.3(O-CH
2
-Ar). MS (EI): m/z: 262.1, 172.1,
91.1. Mp: 295 °C.
4-(Pyrimidin-5-yl) phenol (5)
To a 100 ml round-bottomed flask containing 10 % Pd/C (1.0g) in 50 ml THF was added
5-(4-benzyloxyphenyl) pyrimidine (2.17 g, 8 mmol). The flask was charged with nitrogen,
and a balloon filled with H
2
was fitted to the flask. The nitrogen gas was briefly
evacuated from the flask, and the H
2
gas was charged above the solution. The reaction
mixture was stirred for 24 h at ambient temperature and then filtered through a glass frit
containing a small layer of celite powder. After the solid was washed with THF (3 × 25
ml), the organic phrases were combined and the solvent was then removed with a rotary
evaporator to yield a light yellow solid. The resulting crude product was purified by
column chromatography on a silica gel column using hexane and ethyl acetate (1:4) as
the eluant. Yield: 1.4 g (98.2 %).
1
H NMR (300 MHz, DMSO-d6, δ ppm) 9.10 - 9.04 (m,
ArH, 3 H), 7.63 (d, J = 8.4 Hz, Ar H), 6.90 (d, J = 8.2 Hz, Ar H), 6.87 (b, O-H, 1 H).
13
C
NMR (75.4 MHz, DMSO-d
6
, δ ppm) 148.8, 136.6, 128.4, 127.8, 127.6, 119.6, 108.3(Ar-
C). MS (EI): m/z: 172.1, 118.1, 91.1. Mp: 116 °C.
119
4-(Pyrimidin-5-ylphenyl) methacrylate (6)
Triethylamine (2.5 ml, 17.9 mmol) and 4-(pyrimidin-5-yl) phenol (1.0 g, 5.8 mmol) were
dissolved in 30 ml dry THF placed in a 100 ml round-bottom flask. This solution was
cooled to 0 °C, and added a solution of methacryloyl chloride (1.2 ml, 12 mmol) in 4 ml
THF. After finishing the addition, the reaction mixture was warmed to room temperature
and stirred for 4 hr, filtered and the volatile components were removed under reduced
pressure. The resulting crude product was dissolved in dichloromethane, washed with
sodium bicarbonate solution, followed by water (3 × 50 ml). The organic layer was dried
over anhydrous magnesium sulfate and filtered. The excess solvent was removed under
reduced pressure and the resulted compound was purified using flash column
chromatography on a silica gel column with hexane and ethyl acetate (1:1) as the eluent
to yield the monomer. Yield: 0.85 g (61.0 %).
1
H NMR (300 MHz, CDCl
3
, δ ppm) 9.20
(s, ArH, 1H), 8.95 (s, ArH, 2H), 7.63 (d, J = 8.4 Hz, ArH, 1 H), 6.90(d, J = 8.2 Hz, ArH,
1 H), 6.39 (s, C=CH
2
, 1 H), 5.80 (s, C=CH
2
, 1 H), 2.09 (s, -CH
3
, 3H).
13
CNMR (75.4
MHz, CDCl
3,
δ ppm) 157.5, 154.8, 151.7, 129.1, 128.0, 127.7, 123.8, 122.8, 121 (Ar-C),
18.2(-CH
3
). MS (EI): m/z: 240.1, 172.1, 118.1, 84.0. Mp: 127 °C.
1-Benzyloxy-4-dodecyloxy-2, 5-di(pyridin-5-yl) benzene (7)
Compound 7 was synthesized according to the procedure described for the synthesis of 5-
(4-benzyloxy-phenyl) pyrimidine. Yield: 4.8 g (65.2 %).
1
H NMR (300 MHz, CDCl
3
, δ
ppm): 8.66 - 8.64 (m, Ar-H, 4 H), 7.54 - 7.26 (m, ArH, 9 H), 7.06 (s, ArH, 1 H), 7.00 (s,
ArH, 1 H), 5.05 (s, O-CH
2
-Ar, 2 H), 3.96 (t, J = 6.3 Hz, O-CH
2
-, 2 H), 1.76 (p, J = 7.5 Hz,
C(O)-CH
2
-, 2 H), 1.26 (b, -CH
2
- 18 H), 0.88 (t, J = 6.7 Hz, -CH
3
, 3 H).
13
C NMR (75.4
MHz, CDCl
3
, δ ppm): 157.0, 156.7, 150.8, 149.5, 140.9,131.5, 128.6, 128.2, 127.2,
120
20.4,115.9, 114.6, 106.2 (Ar-C), 71.7, 69.5 (O-CH-), 318, 29.5, 29.4, 29.3, 29.2, 29.1,
29.0, 25.9, 22.6 (-CH
2
-), 14.8 (-CH
3
). MS (EI): m/z: 522.4, 353.1, 263.1, 91.1. Mp: 129.5
°C.
4-Dodecyloxy-2, 5-di(pyridin-5-yl) phenol (8)
Compound 8 was synthesized according to the procedure described for the synthesis of
compound 5. From 4.0 g (7.7 mmol) of compound 7 was obtained 2.8 g of light yellow
powder. Yield: 2.8 g (84.1 %).
1
H NMR (300 MHz, CDCl
3
, δ ppm): 8.60 - 8.57 (m, ArH,
4 H), 7.60 - 6.95 (m, Ar-H, 6 H), 3.92 (t, J = 6.3 Hz, O-CH
2
-, 2 H), 3.60 (b, O-H, 1 H),
1.73 (q, J = 6.4 Hz, C(O)-CH
2
-, 2 H), 1.25 (b, -CH
2
- 18 H), 0.87 (t, J = 6.0 Hz, -CH
3
, 3
H).
13
C NMR (75.4 MHz, CDCl
3
, δ ppm): 150.2, 149.0, 148.6, 148.0, 124.4, 122.0, 117.5,
114.8, 106.4 (Ar-C), 68.8 (O-CH
2
-), 31.2, 28.9, 28.8, 28.7, 28.6, 28.5, 28.2, 25.4, 22.2,
20.2 (-CH
2
-), 14.1 (-CH
3
). MS (EI): m/z: 432.3, 264.1, 237.1. Mp: 150 °C.
4-Dodecyloxy-2, 5-di(pyridin-5-yl) phenyl-1-yl methacrylate (9)
Monomer 9 was synthesized according to the procedure described for the synthesis of
monomer 6. From 2.5 g (5.8 mmol) of compound 8 and 1.6 ml (11.6 mmol) methacryloyl
chloride was obtained 0.65 g (26.0 %) of monomer.
1
H NMR (300 MHz, CDCl
3
, δ ppm): 8.65 - 7.2 (m, Ar-H, 10 H), 6.17 (s, CH=C, 1 H),
5.65 (s, C=CH, 1 H), 4.00 (t, J = 6.0 Hz, -O-CH
2
-C-, 2 H), 1.90 (s, C=C-CH
3
, 3 H), 1.74
(p, J = 6.5 Hz, R(O)-CH
2
-, 2 H), 1.24 (b, -CH
2
-, 18 H), 0.86 (t, J = 6.5 Hz, -CH
3
, 3 H).
13
C NMR (75.47 MHz, CDCl
3
, δ ppm): 171, 149.80, 149.45, 141.17, 137.08, 136.62,
135.76, 134.62, 134.49, 133.79, 130.59, 129.33, 128.88, 126.63, 124.90, 124.07, 123.45,
113.72, 77.33, 76.91, 76.48, 69.11, 31.79, 30.79, 29.51, 29.11, 25.98, 22.56, 21.11, 18.13,
14.02. EI-MS: m/z: 500.2, 345, 331.9, 263, 86, 69.
121
Poly(4-Dodecyloxy-2, 5-di(pyrimidin-5-yl)phenyl-1-yl methacrylate) (P1)
P1 was described in chapter 2 as P03
Poly(4-(pyrimidin-5-yl )phenyl methacrylate) (P2)
Polymerization of monomer 6 was performed according to the procedure described for
P1. From 0.8 g (2.0mmol) of monomer 6 was obtain a light yellow powder. Yield: 0.5 g
(62.5%).
1
H NMR (300 MHz, DMSO-d
6
, δ ppm) 9.20-6.90 (m, ArH, 7 H), 1.95 (b, -CH-,
2 H), 1.74 (b, -CH
3
, 3 H). FT-IR (KBr, cm
-1
): 3041 (ArH stretching), 2958 (-CH
2
-
stretching), 1745 (ester C=O stretching), 1555, 1508, 1415 (Ar, C=C, C=N stretching).
1259, 1170, 1101 (C-O-C stretching). Mn: 0.60 × 10
4
; M
w
: 0.89 × 10
4
; PD: 1.5.
Poly(4-Dodecyloxy-2, 5-di(pyridin-5-yl) phenyl-1-yl methacrylate) (P3)
Polymer P3 was performed according to the procedure described for polymer P1. From
0.5 g (1 mmol) of compound 9 was obtained as light yellow polymer. Yield: 0.2 g (40%).
1H NMR (300 MHz, CDCl3, δ ppm): 8.65 - 6.97 (b, ArH, 10 H), 4.00 (b, -O-CH
2
-, 2 H),
1.75-1.65 (m, -CH
2
-, 4 H), 1.24 (b, -CH
2
-, 18 H), 0.86 (b, -CH
3
-, 6 H).
FT-IR (KBr, cm
-1
): 3041 (ArH stretching), 2958 (-CH
2
- stretching), 1745 (ester C=O
stretching), 1595, 1548, 1410(Ar, C=C, C=N stretching). 1274, 1170, 1101 (C-O-C
stretching). Mn: 0.62 × 10
4
; M
w
: 1.16 × 10
4
; PD: 1.9.
4.2.4 Preparation of complexes
Appropriate amounts of host polymer and dodecylbenzenesulfonic acid (DBSA) were
separately dissolved in appropriate solvent (for P1, in THF; for P2, P3, in DMF). The
concentration of the solution was 50 mg/ml. The DBSA solution was added dropwise to
the host polymer solution and the mixture was kept stirring for 2 days in room
temperature before evaporating the solvent. The complexes were further dried at 50 °C in
122
high vacuum for two days. The complexes are marked as Pn(DBSA)
x
, where x is the
number of DBSA molecules per repeating unit of the host polymer.
4.3 Results and Discussion
4.3.1 FTIR characterization
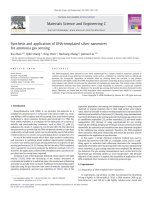
The interaction of the two components in complexes can be investigated using FTIR
spectroscopy, where the frequency shifts of the absorption bands of functional groups
provide information on the nature and intensity of the interactions. Figure 4.1 shows the
FTIR spectra of P1(DBSA)
x
, where the x is 0.5, 1.0 and 2.0 respectively. The pyrimidine
is weaker base than pyridine, usually the second C=N groups in pyrimidine ring are very
difficult to protonate after the first protonation.
500 1000 1500 2000 2500 3000 3500 4000
1223 cm
-1
P1
x= 0.5
x= 1.0
x= 2.0
1552 cm
-1
1619 cm
-1
1552 cm
-1
1619 cm
-1
1552 cm
-1
1619 cm
-1
Absorbance (a.u.)
Wavenumber (cm
-1
)
Figure 4.1. FTIR spectra of P1(DBSA)
x
and the host polymer P1
The stretching peak at 1552 cm
-1
from pyrimidine groups of the host polymer is strongly
affected with the formation of the complexes. With the increase of the content of the
DBSA, the peak at 1552 cm
-1
decreases and a new peak at 1619 cm
-1
appears. It is known
123
that a strong acid such as DBSA is capable of protonating the pyridine ring to form a
pyridinium ring
7
. Similiarly, it is reasonable to attribute the peak at 1619 cm
-1
to the
vibration of the pyrimidinium groups. When x = 2.0, it is expected that all pyrimidine
groups were protonated by DBSA, and the peak at 1552 cm
-1
was observed to all shifted
to the 1619 cm
-1
. It is also noted that the peak at about 1220 cm
-1
increases with the
increase of DBSA. This may be due to the increase of the SO
3
-
in DBSA with the
deprotonation of –SO
3
H. It is important to note that a large shift of 66 cm
-1
was observed
upon full complexation. This evidence supports that the acidic proton of DBSA is
completely transferred to the pyrimidine ring, the interaction has strong ionic character
between the positively charged pyrimidinium ring and negatively charged sulfonate anion.
Therefore, the proton transfer rather than hydrogen bonding is expected to take place.
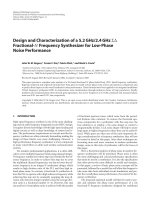
Figure 4.2 shows the FTIR spectra of P2(DBSA)
x
, where the x is 0.3, 0.75 and 1.0
respectively.
500 1000 1500 2000 2500 3000 3500 4000
1185 cm
-1
P2
x= 0.3
x= 0.75
x= 1.0
1612 cm-1
1608 cm
-1
1555 cm
-1
1608 cm
-1
1555 cm
-1
Absorbance (a.u.)
Wavenumber (cm
-1
)
Figure 4.2. FTIR spectra of P2(DBSA)
x
and the host polymer P2
124
Similarly the characteristic peak at 1555 cm
-1
of the P2 with pyrimidine groups was
observed to shift to 1612 cm
–1
with the full complexation and the increase of the peak at
around 1190 cm
-1
means the increase of the SO
3
-
groups upon deprontonation, which
support the formation of the complexes. A shift of 57 cm
-1
corresponding to the
formation of a pyrimidinium ring is observed, however it is a weaker band compared
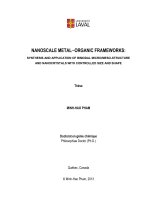
with P2(DBSA)
x
. Figure 4.3 shows the FTIR spectra of P3(DBSA)
2.0
and host polymer
P3. The polymer P3 with pyridine groups in side chain shows characteristic peaks at
1595, 1547, and 1410 cm
-1
due to the C=C vibration. The peak at 1595 cm
-1
is observed
to shift to 1628 cm
-1
and the peak at 1210 cm
-1
is shown obviously an increase upon full
complexation.
500 1000 1500 2000 2500 3000 3500 4000
1210 cm
-1
P3
X= 2.0
1595 cm
-1
1628 cm
-1
Absorbance (a.u.)
Wavenumber (cm
-1
)
Figure 4.3. FTIR spectra of P3(DBSA)
2.0
and the host polymer P3
125
4.3.2 Thermal analysis
Thermally induced phase transition behaviors of complexes P1(DBSA)
x
were evaluated
by differential scanning calorimetry (DSC) in a nitrogen atmosphere. The DSC traces are
shown in Figure 4.4.
-50 0 50 100 150 200 250
t
iso
88.8
o
C
t
iso
107.5
o
C
T
g
36.6
o
C
T
g
27.8
o
C
T
g
29.3
o
C
T
g
29.9
o
C
x= 2.0
x= 1.0
x= 0.5
P1
heat flow (mW)
Temperature (
o
C)
Figure 4.4. DSC curves of the first heating scan for complex P1(DBSA)
x
and host
polymer P1
In the previous study, it is demonstrated that the polymer P1 (described as P03 in chapter
2) is a liquid crystalline polymer, which undergoes an isotropic transition at 107.5 °C
with a T
g
at 29.3 °C. For the complexes P1(DBSA)
x
, with x = 0.5, the complex shows
two endothermic transitions, whereas the isotropic transition at 88.8 °C decreases
obviously compared with the pristine polymer P1. When x increase to 1.0 and 2.0, the
second endothermic transitions disappear with only the glass transitions are observed,
which appear at 27.8 and 36.8 °C respectively. It is noted that T
g
s of the complexes don’t
126
decrease with the increase of the DBSA though DBSA contains a long flexible alkyl
chain. This may be attributed to two factors: one, the host polymer already have a long
flexible alkyl chain, thus the plasticized effect is not so obvious with the addition of
DBSA, but the ionic effect from complexes enhances the interaction, then exert some
influence on the T
g
. Both combined effects might explain the change in the T
g
of the
complexes. Figure 4.5 shows the DSC curves for host polymer P2 and complexes
P2(DBSA)
x
(x= 0.3, 0.75, 1.0). P2 exhibits a clear glass transition (T
g
) at 135.3
o
C. With
the increase of DBSA (from x= 0.3 to x= 0.75), the T
g
s of complexes decrease from
135.3 °C to 99.0 °C and 64.5
°C, respectively. That change may be due to the increase of
the long flexible alkyl chains with the inlet of DBSA. It is interesting that P2(DBSA)
1.0
shows two endothermic transitions. Besides the T
g
at 73.4 °C, a small transition appears
at 137 °C, which may be an isotropic transition. However, POM and X-ray cannot detect
this change.
Figure 4.6 shows the DSC traces for host polymer P3 and complexes P3(DBSA)
2.0
. The
host polymer shows three endothermic transitions at 88.3, 100.3 and 135.7 °C,
respectively. P3(DBSA)
2.0
appears two transitions at 89 and 138.6 °C. Compared with
curve of host polymer P3, the peak in P3(DBSA)
2.0
appears broader.
127
0 50 100 150 200 250
P2
x= 0.3
x= 0.75
x= 1.0
T
1
: 137
o
C
T
g
: 73.4
o
C
T
g
: 64.5
o
C
Tg: 135
o
C
T
g
: 99
o
C
Heat Flow (mW)
Temperature (
o
C)
Figure 4.5 DSC curves of the first heating scan for complex P2(DBSA)
x
and host
polymer P2
0 50 100 150 200 250
x = 2.0
P3
T
2
: 138.6
o
C
T
1
: 89
o
C
T
3
:135.7
o
C
T
2
: 100.3
o
C
T
1
: 88.3
o
C
Heat Flow (mW)
Temperature (
o
C)
Figure 4.6 DSC traces of the first heating scan for complex P3(DBSA)
1.0
and host
polymer P3
128
4.3.3 POM study
The novel polymeric complexes P1(DBSA)
x
were analyzed with polarized optical
microscopy to identify the mesophase of the pristine polymer and complexes (shown in
Figure 4.7).
When the isotropic liquid of P1 was cooled with a rate of 0.5 °C min
-1
to 95 °C, a mosaic
texture was formed (shown in Figure 4.7a) and complex P1(DBSA)
0.5
exhibited a typical
focal-conic fan texture of smectic A phase
22
when cooled to 78 °C from a isotropic melt
(Figure 4.7b) while no birefringent textures were found from other complexes
P1(DBSA)
1.0
and P1(DBSA)
2.0
during cooling. It is well known that the broad
polydispersity of polymers will cause hindrance to form mesophase by polymers, which
may explain the lack of recognizable textures from the polymer P1
23
. For P1(DBSA)
0.5
,
DBSA may act as a plasticizer to enhance the packing during cooling, thus a typical
smectic mesophase is formed. However, with the increase of the amount of DBSA, the
order disappeared totally.
4.3.4 X-ray diffraction analysis
XRD measurements were carried out to collect more information on the molecular
arrangements and packing model of novel complexes. X-ray diffraction patterns for
pristine polymer P1, P1(DBSA)
0.5
and P1(DBSA)
1.0
are shown in the Figure 4.8. The d-
spacing distance was derived using the Bragg’s law d = nλ/2sin(θ) (λ = 1.54 Å). The
reflection angle 2θ and the space distance d are listed in Table 4.1.
129
a
b
Figure 4.7. Polarized optical micrographs of (a) P1 observed at 95 °C on cooling with a
0.5 °C min
-1
from isotropic melt, (b) P1(DBSA)
0.5
observed at 78 °C on cooling with 1.0
°C min
-1
from isotropic melt.
510152025
30.6 A
o
11.9 A
o
18.0 A
o
35.9 A
O
29.4 A
o
P1(DBSA)
0.5
P1(DBSA)
1.0
P1
relative intensity(a.u.)
2-theta(degree)
Figure 4.8 X-ray diffraction patterns of polymer P1, P1(DBSA)
0.5
and P1(DBSA)
1.0.
130
Table 4.1. Peak angles (°) and d spacings (Å) for the complexes P1(DBSA)
x
Polymer
2θ
1
/° 2θ
2
/° 2θ
3
/° 2θ
4
/° 2θ
5
/°
d
1
(Å) d
2
(Å) d
3
(Å) d
4
(Å) d
5
(Å)
P1
2.46 2.86 4.91 7.42 19.8 35.9 30.6 17.9 11.9 4.5
P1(DBSA)
0.5
3.02. 20.1 29.4 4.4
The XRD diffraction pattern of P1 shows sharp reflection in the small angle region at 2θ
= 2.46, 2.86 and 4.91
o
, from which d spacings of 35.9 Å, 30.6 Å and 17.9 Å are derived.
It also offers a sharp reflection in the middle angle region and a broad halo at 2θ = 7.42
and 19.9
o
, from which d spacings of 11.9Å and 4.5 Å are derived. The XRD diffraction
pattern of complex P1 (DBSA)
0.5
shows one reflection in the small angle region at 2θ =
3.02
o
, from which d spacing of 29.4Å can be calculated, whereas the P1(DBSA)
1.0
bear
no reflection in the diffraction pattern. The P1(DBSA)
0.5
lattice appeard to have some
long-range order, however, the reflection in the small angle is broader than that of host
polymer and the reflection in middle angle region is missed, which indicates that the
ordered packing decreases compared with that of the host polymer
. With the increase of
the amount of DBSA, and the decrease of the free pyrimidine groups, long-range order
disappears.
In the previous study on the novel jacketed polymer P1 (described in chapter 2 as P03), a
2D rectangular columnar mesophase was determined. The pyrimidine groups on the
terminal position play a critical role in the self-assembly of the polymer, which helps to
pack the polymer chains in ordered structures
24-27
. With the addition of DBSA, the long-
range order is difficult to form inside the lattice. When the polymers were combined with
131
excess of DBSA, the polar and stabilizing effect of pyrimidine groups is decreased and
the side flexible chains in the lateral position interfere with the packing of the mesogenic
units, which results in more disorder in the lattice.
X-ray diffraction patterns for pristine polymer P2, P2(DBSA)
1.0
are shown in the Figure
4.9. The reflection angle 2θ and the space distance d are listed in Table 4.2. The
diffraction pattern for P2 only exhibits one broad halo at 2θ = 19.6
o
, and no sharp
reflection is found, which indicates that the polymer is short of any long-range position
order. P2(DBSA)
1.0
shows
a series of peaks at middle and large angler region. That may
be due to the crystallization of the long alkyl chain from DBSA
28
. Further investigation is
needed to explain the results fully.
5 1015202530
P2
x= 1.0
Intensity (a.u.)
2-theta (degree)
Figure 4.9. X-ray diffraction patterns of polymer P2, and P2(DBSA)
1.0.
132
Table 4.2. Peak Angles (°) and d spacing (Å) for the complexes P2(DBSA)
1.0
Polymer
2θ
1
(°) 2θ
2
(°) 2θ
3
(°) 2θ
4
(°) 2θ
5
(°)
d
1
(Å) d
2
(Å) d
3
(Å) d
4
(Å) d
5
(Å)
P2(DBSA)
1.0
12.5 16.6 18.9 24.4 26.1 7.86 5.93 5.21 4.04 3.78
P2
19.6 5.02
4.3.5 Morphology study
By using atomic force microscopy (AFM), the morphology of the polymeric complex
was investigated. AFM analyses were performed on spin-coated films on a glass sheet.
The AFM images from P1 and P1(DBSA)
0.5
are displayed in Figure 4.10.
The image from P1 (Figure 4.10a) displays a well-ordered fibrous structure, which is
characteristic of cylindrical rod type polymers whereas the image from P1(DBSA)
0.5
(Figure 4.10b) shows a particle structure, which is dramatically different from that of the
pristine polymer P1. The component DBSA exerts a significant effect on the materials
packing. This can be attributed to the decrease in the effect of pyrimidine groups with the
increase of amounts of DBSA. The diameter of the fiber from pristine polymer is about
100 nm while the diameter of the particle from complex is much bigger, almost at 1 µm.
After annealed at 60 °C for different time intervals, P1(DBSA)
0.5
was investigated with
AFM about the thermal effect on the morphologies of complexes. The images are shown
in Figure 4.10c (after annealed for 4h) and d (after annealed for 8 h). The images show
that porous structures were formed from the particle structure. This may be due to
decomposition of the complex after annealing.
133
a
b
c
d
Figure 4.10. AFM images (contact mode) of film on glass slide by spin-coated from a
solution (0.5 mg/ml) in THF (a) pristine polymer P1; (b) complex P1(DBSA)
0.5
; (c)
P1(DBSA)
0.5
after annealed at 60 °C for 4h; (d ) P1(DBSA)
0.5
after annealed at 60 °C for
8h.
4.3.6 Conclusion
A series of complexes base on Poly (4-Dodecyloxy-2, 5-di (pyrimidin-5-yl)-phenyl-1-yl
methacrylate) and dodecylbenzenesulfonic acid were prepared. FTIR studies show that
the vibrating brand at 1552 cm
-1
corresponding to the pyrimidine ring in host polymer
shifts to 1634 cm
-1
corresponding to pyrimidinium ring in complexes, which indicates the
134
proton transfer rather than hydrogen bonding is considered to take place. DSC, POM and
X-ray diffraction results show that only when the DBSA content is low (x=0.5), the
complexes keep the liquid crystal properties and appear a lamella structure. P1(DBSA)
0.5
takes a particle morphology which is contrast to the fibrous state of pristine polymer. A
porous structure is formed after annealing the complexes, which may provide an easy
way to prepare the porous materials.
A series of complexes from poly(4-Dodecyloxy-2, 5-di (pyridin-5-yl) phenyl-1-yl
methacrylate) or poly (4-(pyrimidin-5-yl) phenyl methacrylate) and dodecylbenzene
sulfonic acid were prepared. However, no long-range order was detected in these
complexes in the X-ray diffraction studies.
References
1. Thunemann, A. F. Prog. Polym. Sci. 2002, 27, 1473-1572.
2. Zhou, S.; Chu, B. Adv. Mater. 2000, 8, 545-556.
3. Kato, T.; Mizoshita, N.; Kanie, K. Macromol. Rapid Commun. 2001, 22, 797-
814.
4. Kato, T.; Frechet, J. M. Macromolecules 1989,22, 3818-3822.
5. Kato, T.; Kihara, H.; Ujiie, S.; Uryu, T.; Frechet, J. M. Macromolecules 1996, 9,
8734-8739.
6. Kawakami, T.; Kato, T. Macromolecules 1998, 31, 4475-4479.
7. Ikkala, O.; Ruokolainen, J.; Brinke, G. ten; Toekkeli, M.; Serimaa, R.
Macromolecules 1995, 28, 7088-7094.
8. Jiao, H., Goh, S. H.; Valiyaveettil, S. Macromolecules 2001, 34, 7162-7165.
135
9. Valkama, S.; Ruotsalainen, T.; Kosonen, H.; Ruokolainen, J. Torkkeli, M.;
Serimaa, R.; Brinke, G. ten; Ikkala, O. Macromolecules 2003, 36, 3986-3991.
10. Valkama, S.; Lehtonen, O.; Kosonen, H.; Torkkeli, M.; Serimaa, R.; Brinke, G.
ten; Ikkala, O. Macromol. Rapid Commun. 2003, 24, 556-560.
11. Kato, T.; Nakano, M.; Moteki, T.; Uryu, T.; Ujiie, S. Macromolecules 1995, 28,
8875-8876.
12. Antonietti, M.; Conrad, J. Angew. Chem. Int. Ed. Engl. 1994, 33, 1869-1870.
13. Antonietti, M.; Conrad, J.; Thunemann, A. F. Macromolecules 1994, 27, 6007-
6011.
14. Ruokolainen, J.; Brinke, G. ten; Ikkala, O.; Torkkeli; M.; Serima, R.
Macromolecules 1996, 29, 3409-3415.
15. Ruokolainen, J.; Makinen, R.; Torkkeli, M.; Makela, T.; Serimaa, R.; Brinke, G.
ten; Ikkala, O. Science 1998, 280, 557-560.
16. Ruokolainen, J.; Brinke, G. ten; Ikkala, O. Adv. Mater. 1999, 11, 777-780.
17. Maki-Ontto, R.; Moel, K.; Odorico, W.; Ruokolainen, J.; Stamm, M.; Brinke, G.
trn; Ikkala, O. Adv. Mater. 2001, 13, 117-121.
18. Moel, K.; Ekenstein, G.; Nijland, H.; Polushkin, E.; Brinke, G. ten; Maki-Ontto,
R.; Ikkala, O. Chem. Mater. 2001, 13, 4580-4583.
19. Maki-Ontto, R.; Moel, K.; Polushkin, E.; Ekenstein, G.; Brinke, G.ten; Ikkala,
O. Adv. Mater. 2002, 14, 357-361.
20. Ikkala, O.; Brinke, G. ten Science 2002, 295, 2407-2409.
21. Dierking, I. “Textures of Liquid Crystals” Wiley-VCH, Weinheim, 1978.
22. Tschierske, C. J. Mater. Chem. 1998, 8(7), 1485-1508.
136