A framework for formalization and characterization of simulation performance 3
Bạn đang xem bản rút gọn của tài liệu. Xem và tải ngay bản đầy đủ của tài liệu tại đây (236.82 KB, 41 trang )
64
Chapter 3
Performance Characterization
Simulation performance analysis is important because it can be used to identify
opportunities for performance improvement and to compare different modeling and
parallelism strategies. However, analyzing simulation performance is a complex task
because it depends on many interwoven factors [FERS97].
In this chapter, we propose a framework for characterizing simulation performance.
Simulation performance is characterized along the three natural boundaries in modeling
and simulation, i.e., physical system (simulation problem), simulation model, and
simulator (implementation). The main objective is to provide a basis for analyzing
simulation performance from a simulation problem to its implementation. We focus on
time (event parallelism) and space (memory requirement) performance at each layer.
Event parallelism is defined as the number of events executed per unit of time.
Therefore, event parallelism is influenced by the unit of time which complicates
performance comparison across layers because the time units used at different layers are
different. An additional process is therefore necessary to allow performance comparison
across layers. We propose a time independent performance measure called strictness
which focuses on the dependency among events only.
Chapter 3. Performance Characterization 65
This chapter is organized as follows. First, we present our motivation and review a
number of related works that influence our research. Next, we propose our performance
characterization framework. This is followed by a discussion on time performance
analysis. The next section presents space performance analysis. Next, we discuss the
concept of event ordering strictness. Finally, we conclude this chapter with a summary.
3.1 Motivation
In this section, we review a number of performance evaluation frameworks that motivate
our research. They focus on either a certain simulator (e.g., Time Warp protocol, CMB
protocol) or a certain aspect of performance study (e.g., benchmark, workload) as shown
in the following discussion. This motivates us to propose a framework that unifies them.
3.1.1 Related Works
Barriga et al. noted that a common benchmark suite is required in evaluating the
performance of a simulation [BARR95]. They advocated an incremental benchmark
methodology to evaluate the time performance (event rate) of a Time Warp protocol.
The ingenious idea here is that they start from a simple benchmark (i.e., self-ping), and
by incrementally adding more complexity to the benchmark, they measure various
overheads of the Time Warp protocol running on a multiprocessor. They also showed
that the incremental benchmark methodology can be used to compare the performance of
different variations of Time Warp protocol.
Chapter 3. Performance Characterization 66
Balakrishnan et al. presented a general performance analysis framework for parallel
simulators in [BALA97]. The main objective is to provide a common benchmark suite
that studies the performance of simulators using synthetic and realistic benchmarks. To
achieve this objective, they implemented several tools, i.e. Workload Specification
Language (WSL) and Synthetic Workload Generator (SWG). WSL is a language that
describes a benchmark and its workload parameters. SWG generates synthetic workloads
based on a given WSL. A translator is required to translate WSL to the code recognized
by a target simulator. They applied this framework to analyze the time performance
(event rate) of a Time Warp protocol. These tools can also be used to support the
incremental benchmark methodology [BARR95].
Jha and Bagrodia characterized simulation performance as a function of protocol
independent factors and protocol dependent factors [JHA96]. The protocol independent
category includes factors such as processor speed and communication latency. The
protocol specific category includes factors such as null message overhead in the CMB
protocol. The same performance characterization is also mentioned in [BARR95].
However, Jha and Bagrodia's proposed framework analyzes protocol independent factors
only. They implemented an Ideal Simulation Protocol (ISP) based on the concept of
critical path analysis (CPA). ISP computes the critical path by actually executing the
simulation model on parallel computers in contrast to a uniprocessor in the original CPA.
Therefore, they claimed that ISP gives a more realistic upper bound on speed-up than
CPA. Further, they defined the efficiency of protocol as the ratio of the execution time
of ISP to the execution time of the target protocol. Of course, as in CPA, their
performance evaluation framework is limited to non-supercritical protocols such as the
CMB protocol [JEFF91]. Recently, based on the same performance characterization as
Chapter 3. Performance Characterization 67
in [BARR95, JHA96], Song evaluated the time performance of a CMB protocol
[SONG01]. However, his work focuses on the protocol dependent factors, i.e., the
blocking time in the CMB protocol.
Teo et al. proposed a different performance evaluation framework which evaluates
performance along three components: simulation model, parallel simulation strategy, and
execution platform [TEO99]. The simulation model views the physical system to be
simulated as a queuing network of LPs. The parallel simulation strategy refers to the
protocol dependent factors. The execution platform refers to platform dependent factors,
such as the speed of processors and communication latency. The paper focuses on the
event parallelism analysis at the simulation model.
Liu et al. implemented a parallel simulator suite called Dartmouth Scalable Simulation
Framework (DaSSF) [LIU99]. They proposed a simple high level approach to estimate
the performance of their simulator. They measured the simulator’s internal overheads
such as context switching, dynamic object management, procedure call, dynamic
channel, process orientation, event list, and barrier synchronization. They used these
measurements to estimate the performance of the simulator in simulating a given
physical system.
In the early days, most work in the performance evaluation of parallel simulation
concentrated on time performance and assumed that the amount of memory was
unlimited [LIN91]. Since then, there has been a growing body of research that studies the
space aspect of parallel simulation but most of it concentrates on managing the memory
required to implement various synchronization protocols. In particular, the conservative
Chapter 3. Performance Characterization 68
approach focuses on reducing the number of null messages, for example, the carrier-null
mechanism [CAI90], the demand-driven method [BAIN88], and the flushing method
[TEO94]. In the optimistic approach, the focus is placed on delimiting the optimism,
thus constraining memory consumption, and on reclaiming memory before a simulator
runs out of storage. Examples include the various state saving mechanisms [SOLI99], the
use of event horizon in Breathing Time Bucket [STEI92], the adaptive Time Warp
[BALL90], the message send-back [JEFF90], the artificial rollback [LIN91], and the
adaptive memory management [DAS97].
There are also a number of studies which examine the minimum amount of memory
required for various parallel simulation implementations under the shared-memory
architecture (but not applicable to the distributed memory architecture [PREI95]). Their
main objective is to design an efficient memory management algorithm which guarantees
that the memory requirement of the parallel simulation is of the same order as sequential
simulation. Jefferson refers to this algorithm as an optimal memory management
algorithm [JEFF90]. Jefferson and Lin et al. proved that the CMB protocol is not
optimal [JEFF90, LIN91]. Lin and Preiss analyzed the memory requirement of
sequential simulation, the CMB protocol and the Time Warp protocol [LIN91]. Based on
their characterization, they showed that the CMB protocol may require more or less
memory than sequential simulation depending on the characteristics of the physical
system. However, the Time Warp protocol always requires more memory than sequential
simulation. Das and Fujimoto studied the effect of varying memory capacity on the
performance of the Time Warp protocol [DAS97]. In particular, they studied the time
performance of the Time Warp protocol as a function of the available memory space.
Chapter 3. Performance Characterization 69
Wong and Hwang noted that space performance (i.e., memory requirement) has not been
extensively studied [WONG95]. They proposed a critical path-like analyzer to predict
the amount of memory consumed in a variant of the CMB protocol by measuring the
number of events in the system. However, they did not give any analytical or empirical
results. Based on their (unreported) preliminary result, they suggested that it is possible
to predict the memory requirement of the CMB protocol from the execution of a
sequential simulator.
The space performance becomes increasingly important as the simulation problem
becomes more complex. Liljenstam et al. modeled the effect of a large scale Internet
worm infestation [LILJ02]. They noted that the packet-level simulation uses a large
amount of memory to model hosts and packets. They observed that the memory usage
would exceed 6GB to model 300,000 hosts. A large scale multicast networks simulation
also requires a significant amount of memory [XU03]. The memory requirement can be
as high as 5.6GB for 2,000 stations. Zymanski et al. noted that with the emerging
requirements of simulating larger and more complicated networks, the memory size
becomes a bottleneck [ZYMA03].
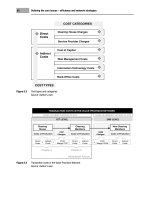
3.1.2 Performance Metrics
As shown before, most frameworks focus on the time performance of a simulator. The
common metrics used are:
Chapter 3. Performance Characterization 70
1. Speed-up – it is defined as the ratio of the execution time of the best sequential
simulator and the execution time of a target simulator [JHA96, BAJA99, BAGR99,
SONG00, XU01].
2. Event rate – it measures the throughput of a simulator, i.e., the average number of
useful events executed per unit time [BARR95, FERS97, BALA97].
3. Execution time – it measures the amount of (wall-clock) time that is required to
complete a simulation [SOKO91, BAJA99, BAGR99].
4. Efficiency – it is defined as the ratio of the execution time of ISP to the execution
time of the target protocol [JHA96]. This is different from the definition of efficiency
in parallel computing, i.e., the ratio between speed-up and the number of processors.
5. Blocking Time – it is defined as the duration when an LP is waiting for a safe event to
be executed [SONG01].
6. Cost per simulation time unit – it is the ratio of wall-clock time to simulation time
[DICK96, LIU99].
Although, it has not been studied extensively, some researchers have indicated that the
appropriate metrics for space performance are:
1. Average memory usage – it is defined as the average memory usage for every
processor [YOUN99]. Young et al. studied the time and space performance of their
proposed fossil collection algorithm. The average memory usage shows the memory
utilization across all processors during simulation run.
2. Peak memory usage – it measures the maximum memory used for a simulation run.
Zhang et al. defines it as the maximum of all machines' maximal memory usage
[ZHANG01, LI04]. Young et al. used a different definition, i.e., the average of all
machines' maximal memory usage [YOUN99].
Chapter 3. Performance Characterization 71
3. Maximum number of events [JEFF90, LIN91].
4. Null message ratio – it is defined as the ratio of total number of null messages to
total number of events. This metric is specific to the CMB protocol [BAIN88,
CAI90, TEO94].
3.2 Proposed Framework
Given the many proposed frameworks, we feel that it is essential to have a complete and
unified performance evaluation framework. The previous section has shown that most
researchers characterize simulation performance as a function of protocol dependent
factors and protocol independent factors [BARR95, JHA96, SONG01]. Bagrodia also
included the partitioning related factors in addition to the protocol dependent factors and
protocol independent factors [BAGR96]. Ferscha further noted that a performance
evaluation framework should consider the six categories of performance influencing
factors, namely, simulation model, simulation engine, optimization, partitioning,
communication and target hardware [FERS96]. Later, Ferscha et al. simplified the
classification into three categories, namely, simulation model, simulation strategy, and
platform [FERS97]. Simulation model refers to the characteristics of a model, such as
the probability distribution function of job arrivals. Simulation strategy refers to the
characteristics of a protocol, such as state saving policy in the Time Warp protocol and
null message optimizations in the CMB protocol. Platform refers to the characteristics of
an execution platform, such as processor speed, communication latency and memory
size. The same characterization is also suggested in [TEO99].
Chapter 3. Performance Characterization 72
We propose to characterize simulation performance in three layers, i.e., physical system,
simulation model, and simulator as shown in Figure 3.1. This thesis focuses on the
physical systems that are formed by sets of interacting service centers. Hence, a physical
system can be formalized as a directed graph where each vertex represents a service
center and an edge from service center i to service center j shows that service center i
may schedule an event to occur in service center j. The time used at the physical system
layer is called physical time (see Chapter 1).
The second layer is the simulation model layer. In the virtual time paradigm [JEFF85], a
simulation model is viewed as a set of interacting logical processes (LPs). Each LP
models a physical process (service center) in the physical system. The interaction among
physical processes in the physical system is modeled by exchanging events among LPs
in the simulation model. Therefore, a simulation model can also be formalized as a
directed graph where each vertex represents an LP, and an edge from LP i to LP j
denotes that LP i may send an event to LP j. The time unit used at the simulation model
layer is timestep. A timestep is defined as the time that is required for an LP to process
an event.
A simulation model is implemented as a simulator, and it is executed on a computer
consisting of one or more physical processors (PPs). In a sequential simulator, events
are executed based on a total event order. In a parallel simulator, one or more LPs at the
simulation model layer are mapped onto a PP. Therefore, the set of PPs also forms a
directed graph where an edge from PP i to PP j denotes that PP i may send an event to PP
j. The simulator constitutes the third layer.
Chapter 3. Performance Characterization 73
Figure 3.1: Three-Layer Performance Analysis Framework
Ideally, any analysis at the physical system layer should be independent of the simulation
model and implementation. It should depend on the characteristics of the physical
system only. Therefore, analysis can be conducted before building a simulation model
(hence, its implementation). Similarly, any analysis at the simulation model layer should
be implementation independent so that analysis can be conducted before implementation.
Analysis at the simulator layer is implementation dependent.
In order to relate the analyses conducted at two different layers, we need a unifying
concept. Bagrodia et al. introduced a unifying theory of simulation, and from the theory,
they derived an algorithm called the space-time algorithm [BAGR91]. A simulator
called Maisie was built to implement the space-time algorithm. A physical system can be
modeled and simulated using Maisie. The performance of a simulator that is supported
by the Maisie run-time system can be evaluated. Theoretically, Bagrodia et al. showed
that sequential simulation, the CMB protocol, and the Time Warp protocol are instances
SC
1
SC
2
SC
3
SC
4
SC
6
SC
5
LP
1
LP
3
LP
4
LP
2
LP
6
LP
5
PP
1
PP
2
Physical
System
Simulation
Model
Simulator
Chapter 3. Performance Characterization 74
of the space-time algorithm. However, the relationship between different instances and
their performance is not clear and they did not show the comparative results.
The idea of using a unifying concept where each simulator can be seen as an instance of
the same abstraction motivates us to use the concept of event ordering introduced in
Chapter 2 as the unifying concept. The reason is that event ordering exists at the three
layers. Therefore, it is possible to use the concept of event ordering to relate analyses
from the different layers. Based on the physical time, there is only one event order in any
physical system (Definition 2.11). At the simulation model layer, the event order in a
physical system can be modeled using different event orders to exploit different degrees
of parallelism. In the implementation (simulator layer), synchronization overhead is
incurred in maintaining event ordering at runtime. Similar to [BAGR91], where every
simulator can be seen as an instance of the time-space algorithm, every simulator in our
framework can be seen as an implementation of an event order.
3.3 Time Performance Analysis
Event parallelism is commonly used as a time performance measure [WAGN89,
SHOR97, WANG00]. It is defined as the average number of events that occur (or are
processed) per unit time. In this thesis, we choose event parallelism for two reasons.
First, the underlying theory of our framework is event ordering. Second, in discrete-
event simulation, events are atomic and are the lowest level of parallelism. This means
that the code within an event is executed sequentially. Equation 3.1 defines event
parallelism:
D
E
=Π (3.1)
Chapter 3. Performance Characterization 75
where E is the set of events, ||E|| is the number of events in E, and D denotes the
measurement duration.
For the same physical system, the number of (real) events in the physical system, in the
simulation model and in the simulator is the same. In a physical system, events may
occur every minute, hour, and so on. In the simulation, these events can be executed at a
different rate, depending on the characteristics of the execution platform (processor's
speed, communication delay, etc.). We introduce the simulation model layer to allow
analysis that is independent of the characteristics of the execution platform. Assuming
that the time to execute an event is one timestep at the simulation model layer, the event
parallelism can be expressed as the number of events executed per timestep. We refer to
the event parallelism at the physical system, simulation model and simulator layers as
Π
prob
, Π
ord
and Π
sync
, respectively.
3.3.1 Physical System
A physical system has a certain degree of inherent event parallelism (Π
prob
). The parallel
simulation of a physical system may fail to deliver the desired improvement in
performance if the physical system itself contains a low degree of inherent event
parallelism [BAGR96]. The analysis at this layer can be used to compare the inherent
event parallelism of different physical systems and to determine whether the problem is
suitable for parallel simulation. The definition of Π
prob
is given in Equation 3.2:
prob
prob
D
E
=Π (3.2)
where E is the set of events, ||E|| is the number of events in E, and D
prob
denotes the
observation period (in physical time unit).
Chapter 3. Performance Characterization 76
3.3.2 Simulation Model
At the simulation model layer, a less strict event order promotes more flexibility in
executing events. An event order R selects a number of events that can be executed from
a set of events E. The selected events are removed from E for execution. An event
execution may schedule new events that will be added to E. This process repeats until a
certain stopping condition is met. A less strict event order can potentially execute events
at a faster rate since it has higher flexibility in executing events. Therefore, a less strict
event order can potentially exploit more event parallelism (Π
ord
) than a stricter event
order. The analysis at this layer reveals the degree of event parallelism exploited by
different event orders from the same physical system. This analysis can also be used to
compare the time performance of two simulators, provided we know the event order that
is implemented by each simulator. By comparing the event parallelism of the two event
orders, we can evaluate the performance of the two protocols, independent of any
implementation factors. The definition of Π
ord
(model parallelism) is given in Equation
3.3:
ord
ord
D
E
=Π (3.3)
where E is the set of events, ||E|| is the number of events in E, and D
ord
denotes the
simulation duration (in timesteps).
3.3.3 Simulator
A simulator can be implemented as a sequential program or a parallel program. In a
parallel simulator, a synchronization algorithm (or simulation protocol) is necessary for
Chapter 3. Performance Characterization 77
maintaining a correct event ordering across processors. Enforcing event ordering at
runtime incurs implementation overhead (such as null messages in the CMB protocol
and rollback in the Time Warp protocol) that results in performance loss. The effective
parallelism (Π
sync
) is defined in Equation 3.4:
sync
sync
D
E
=Π (3.4)
where E is the set of real events (it does not include the overhead events such as null
messages), ||E|| is the number of events in E, and D
sync
denotes the simulation execution
time (in wall-clock time units).
Analysis at the simulator layer can be used to study the effect of different
implementation factors on the performance of a simulator, i.e., the efficiency of
implementations. Examples include execution platform [BARR95] and partitioning
strategy [KIM96]. Since the same event order can be implemented differently, the
analysis at this layer can also be used to compare the performance of two different
implementations of the same event order. For examples, the performance comparison
between the CMB protocol and the carrier null message protocol [CAI90], and the
comparison of different state saving mechanisms in the Time Warp protocol [SOLI99].
3.3.4 Normalization of Event Parallelism
In the previous three subsections, we have analyzed event parallelism at each layer
independent of the other layers. It is also useful to compare event parallelism across
layers. For example, we can see how inherent event parallelism in a physical system is
exploited by a particular event order at the simulation model layer, or we can analyze
performance loss (the difference in event parallelism between the simulation model layer
Chapter 3. Performance Characterization 78
and the simulator layer) due to overheads at the simulator layer. Since the time units used
at different layers are different, the event parallelism across layers cannot be compared
directly as shown in the following example.
We want to study the performance of simulating a physical system. During an
observation period of 10,000 minutes, 200,000 events occur in the physical system.
Hence, the inherent event parallelism (Π
prob
) is 200,000/10,000 = 20 events per minute
(from Equation 3.2). At the simulation model layer, we can execute these events using a
different event order. The measurement shows that the same set of events is executed in
3,500 timesteps using the CMB event order. Hence, the model parallelism (Π
ord
) is
200,000/3,500 = 57 events per timestep (from Equation 3.3). At the simulator layer, a
CMB protocol uses null messages to maintain the event order at runtime. The
measurement shows that the simulation completion time is 1,650 seconds on four
processors. Therefore, the effective event parallelism (Π
sync
) is 200,000/1,650 = 121
events per second.
We cannot compare Π
prob
(20 events / minute), Π
ord
(57 events / timestep), and Π
sync
(121 events / second) directly. From the definition, event parallelism depends on the
dependency among events and time. Therefore, to allow comparison across layers, we
can either convert all time units to a common unit, or normalize event parallelism so that
it becomes time-independent.
In the first approach, we convert all time units to a common unit; in this case, we choose
second. At the physical system layer, the conversion from minute to second is
straightforward. At the simulation model layer, one timestep is defined as the time to
Chapter 3. Performance Characterization 79
execute one event at the simulation model layer. To convert the timestep into second, we
need the real event execution time at the simulator layer. Let us assume that from
measurement, the average time to execute an event at the simulator layer is 18ms. Hence,
one timestep at the simulation model layer is equal to 18ms at the simulator layer. By
converting the timestep into a wall-clock time unit, analysis at the simulation model
layer can be viewed as an analysis at an ideal execution platform where communication
delay is zero and the number of PPs is unlimited so that each LP can be mapped onto a
PP. Now, we can compare event parallelism at the three layers.
Π
prob
= 20 events / minute = 0.33 events / second
Π
ord
= 57 events / timestep = 3,167 events / second
Π
sync
= 121 events / second
The results can be interpreted as follows. The simulator executes events in a faster rate
than in the physical system (it is called faster than real-time simulation in [MART03]).
It shows that the simulator can compress the time in the physical system. Theoretically,
if the communication delay is zero and each LP is mapped onto a unique PP, the
simulator should be able to achieve a parallelism of 3,167 events per second. Due to the
overheads at the simulator layer and the limitation in the number of PPs, the simulator
can only exploit a parallelism of 121 events per second.
In the second approach, we derive the normalized event parallelism from the dependency
among events only. The dependency among events is governed by the event ordering
used. In event ordering, events can be executed in parallel if they are not comparable
(concurrent). Therefore, the normalized event parallelism (
prob
norm
Π ) is defined as the
Chapter 3. Performance Characterization 80
average number of concurrent events. For example, the two physical systems shown in
Figure 3.2 produce different Π
prob
(1.5 events / minute and 1.5 events / hour,
respectively). However, their normalized event parallelism is the same as shown in
Figure 3.3. The links in Figure 3.2 and 3.3 are defined based on Definition 2.11 (event
order at the physical system layer).
Figure 3.2: Two Cases of Event Execution at the Physical System Layer
Figure 3.3: Normalized Event Parallelism at the Physical System Layer
prob
norm
Π
= (2+2+2+4+2+1+2) / 7 = 2.14
Service Center 1
Service Center 2
Service Center 3
Service Center 4
D
prob
= 10 minutes
D
prob
= 10 hours
a)
Physical Time
b)
Physical Time
Chapter 3. Performance Characterization 81
The same normalization procedure is also applied to event orders at the simulation model
layer. Figure 3.4 shows the event parallelism exploited by the partial event order at the
simulation model layer (Definition 2.12).
Figure 3.4: Event Execution at the Simulation Model Layer
At the simulator layer, the number of PPs is limited which affects the event ordering. For
example, events x and y at the simulation model layer (Figure 3.4) are concurrent. At the
simulator layer, LP
1
and LP
2
are mapped onto the same PP (Figure 3.5), hence only one
of the two events can be executed at a time which means events x and y are comparable
(decision on which event is executed first, depends on the scheduling policy used).
Therefore, it is possible that two concurrent events at the simulation model layer are
comparable at the simulator layer, due to the limitation in the number of processors.
After normalization, we can compare the normalized event parallelism at the three layers
( 14.2=Π
prob
norm
, 5.2=Π
ord
, and 67.1=Π
sync
norm
). It shows that event parallelism at the
physical system can be exploited by the partial event order at the simulation model layer.
Due to the limited number of processors, event parallelism at the simulator layer is less
than the one at the simulation model layer.
x
y
ord
norm
Π = (4+2+4+3+1+1) / 6 = 2.5
LP
1
LP
2
LP
3
LP
4
Chapter 3. Performance Characterization 82
Figure 3.5: Normalized Event Parallelism at the Simulator Layer
3.3.5 Related Works
In this section, we show that a number of time performance analyses done by various
researchers have been conducted at the three layers. Wagner and Lazowska noted that
the presence of parallelism in the system being modeled does not imply the presence of
the same degree of parallelism in the simulation of that system [WAGN89]. They clearly
separated the parallelism at the physical system layer from the parallelism at the
simulation model layer. They showed that the parallelism in the physical system (i.e.,
network of service center) is not the same as the parallelism in the simulation model
(network of LPs) even if each service center is mapped onto a unique LP. One of the
reasons is that the service time of an LP (i.e., the time required to execute an event) is
different from the service time of a service center modeled by the LP (i.e., the time
required to complete a service). Hence, the throughput of an LP at the simulation model
layer and that of the service center modeled by the LP are different, which results in
different upper bounds on parallelism.
x
y
sync
norm
Π = (2+2+2+2+2+2+1+1+1) / 9 = 1.67
LP
1
LP
2
LP
3
LP
4
PP
1
PP
2
Chapter 3. Performance Characterization 83
Later, Shorey et al. built a comprehensive model for the upper bound on parallelism at
the simulation model layer [SHOR97]. Further, Wang et al. showed that the causality
constraint imposed at the simulation model layer also affects the parallelism of the
simulation model [WANG00]. These works [WAGN89, SHOR97, WANG00]
concentrate on the parallelism at the simulation model layer. The works may be
extended to analyze parallelism at the other two layers by changing the unit of time.
Critical path analysis (CPA), introduced by Berry and Jefferson, is another widely
known time performance analysis technique [BERR85]. Critical path time gives the
lower bound on the completion time. Later, Jefferson showed that this is true only for
conservative protocols [JEFF91]. Most researchers measure critical path time either at
the simulation model layer where the event execution time is assumed to be constant
[BERR85, LIN92] or at the simulator layer where the event execution time is measured
directly from the simulator [JEFF91]. CPA may also be measured at the physical system
layer where the event execution time in an LP reflects the service time at the service
center that is modeled by the LP. Other time performance analyses measure speed-up
[JHA96, BAJA99, BAGR99, SONG00, XU01, KIDD04], execution time [SOKO91,
BAJA99, BAGR99, HUSS04], efficiency [JHA96], blocking time [SONG01], and wall-
clock time per simulation time unit [DICK96, LIU99]. These metrics are commonly
measured at the simulator layer.
3.4 Space Performance Analysis
Space performance refers to the amount of memory that is required to support a
simulation. Memory is required when a simulation model is run on an execution
Chapter 3. Performance Characterization 84
platform. Hence, the concept of memory requirement originates from the simulator
layer. In this section, we attempt to extend the concept of memory requirement to the
other two layers so that memory requirement at each layer can be analyzed
independently. Further, time and space performance trade-off at each layer can also be
studied.
We view a physical system as a queuing network of service centers. Therefore, we define
the memory requirement at a physical system layer (
M
prob
) as the sum of the maximum
queue size of each service center as shown in Equation 3.5:
∑
=
<<
=
m
i
i
Dt
prob
tQM
prob
1
0
)(max (3.5)
where m is the number of service centers, Q
i
(t) is the queue size of service center i at
physical time t; and D
prob
is the observation period (in physical time units).
At the simulation model layer, based on the virtual time paradigm, we view a simulation
model as a network of LPs and events are exchanged among LPs. Therefore, the
memory requirement at this layer is defined as the sum of the maximum event list size of
each LP as shown in Equation 3.6:
∑
=
<<
=
m
i
i
Dt
ord
tLM
ord
1
0
)(max (3.6)
where m is the number of LPs, L
i
(t) is the event list size of LP i at timestep t; and D
ord
is
the simulation duration (in timesteps).
At the simulator layer, we focus on the memory requirement that is used for
synchronization purposes (M
sync
). Since a sequential simulator does not need any global
synchronization, its M
sync
is zero. In a parallel simulator, LPs are mapped onto a number
Chapter 3. Performance Characterization 85
of PPs. The types of memory overhead depend on the synchronization algorithm used.
For examples, in the CMB protocol, M
sync
is measured from the maximum size of the
data structure used for storing null messages, and in the Time Warp protocol, M
sync
is
measured from the maximum size of the data structure used for storing past states, past
messages, and anti-messages. The definition of M
sync
is shown in Equation 3.7.
∑
=
<<
=
n
i
i
Dt
sync
tBM
sync
1
0
)(max (3.7)
where n is the number of PPs, B
i
(t) is the size of the data structure used for storing
memory overhead at PP i at wall-clock time t; and D
sync
is the total execution time (in
wall-clock time units).
3.4.1 Total Memory Requirement
In the previous section, we have looked at the memory requirement at three different
layers independently. In this section, we study the total memory required to run a
simulation.
In a physical system, when a job arrives at a busy service center, the job will join the
queue at that service center. Similarly, in the simulation run, events will be stored in a
data structure (such as a linked-list) to emulate the jobs waiting for resources in the
physical system. The size of the data structure reflects the queue size of a service center
in the physical system. Hence, the maximum queue size measured at the physical system
layer and simulator layer is the same. Conclusively, M
prob
is the same whether it is
measured at the physical system layer or at the simulator layer.
Chapter 3. Performance Characterization 86
In a simulator, future events are generated in advance to emulate the event occurrences in
a physical system. These future events are stored and sorted in a data structure that is
termed the future event list (FEL) in simulation. A parallel simulator may employ a set
of event lists (ELs) instead of a global future event list. The event list size of an LP
depends on the event incoming rate to the LP and the event execution rate of the LP
[SHOR97]. Due to overheads at the simulator layer, the rates at the simulator layer are
different from the simulation model layer. Therefore, M
ord
may give a different value
when it is measured at the simulation model layer and at the simulator layer.
Let
ord
norm
M be the M
ord
that is measured at the simulator layer. The total memory
requirement (
M
tot
) can be defined as:
syncord
norm
probtot
MMMM ++≈ (3.8)
Equation 3.8 is simple but less accurate. A more accurate model should include the
memory architecture used to run a simulator because it affects the total memory
requirement of the simulator. As Fujimoto noted, research in parallel simulation has
focused on
shared memory architecture and distributed memory architecture [FUJI00].
Preiss et al. [PREI95] and Fujimoto [FUJI00] noted that storage optimality is much more
difficult to achieve on distributed memory architecture. In other words, the same
simulator that is run on a distributed memory system requires significantly more memory
than when it is run on a shared memory system.
Figure 3.6 shows the memory requirement for the shared memory architecture and the
distributed memory architecture. In simulation, every service center is mapped onto a
Chapter 3. Performance Characterization 87
unique LP and every k LPs are mapped onto one PP. Further, we assume that there are m
service centers (hence
m LPs) and n PPs, where m = k × n.
Let:
•
Q
i
be the queue at service center i, and ||Q
i
(t)|| be the size of Q
i
at wall-clock time t
•
L
i
be the event list at LP i, and ||L
i
(t)|| be the number of events in L
i
at wall-clock time
t
•
B
i
be the extra memory overhead at LP i, and ||B
i
(t)|| be the size of B
i
at wall-clock
time
t.
The total memory required by a simulator running on a shared memory architecture
(
M
shr
) and by one running on a distributed memory architecture (M
dst
) are defined in
Equations 3.9 and 3.10, respectively.
D is the total execution time.
}||))(||||)(||||)((||{max
1
0
∑
=
<≤
++=
m
i
iii
Dt
shr
tBtLtQM
(3.9)
||)})(||||)(||||)((||{max
)1()1(
1
)1(
1
0
tBtLtQM
jkijki
k
j
jki
n
i
Dt
dst
+−+−
=
+−
=
<≤
++=
∑∑
(3.10)
Figure 3.6: Shared Memory and Distributed Memory Architecture
a) Shared Memory
b) Distributed Memory
Memory:
Q
1
, Q
2
, …, Q
m
L
1
, L
2
, …, L
m
B
1
, B
2
, …, B
m
PP
1
PP
2
PP
n
Interconnection networ
k
Memory:
Q
1
… Q
k
L
1
… L
k
B
1
… B
k
PP
1
PP
2
PP
n
Interconnection networ
k
Memory:
Q
k+1
… Q
2k
L
k+1
… L
2k
B
k+1
… B
2k
Memory:
Q
m-k+1
… Q
m
L
m-k+1
… L
m
B
m-k+1
… B
m
Chapter 3. Performance Characterization 88
As noted by Young et al., the average memory consumption shows how memory is
utilized across processors in a simulation run [YOUN99]. A high average number of
events in a system increases the probability of events that can be executed in parallel.
The maximum value only shows the peak memory requirement. It captures the number
of events at one point of time only; it does not tell about the expected number of events
at any point of time. Hence, the average memory requirement can explain event
parallelism better than the maximum memory requirement. However, if we want to know
how much memory should be provided for the simulation, we should refer to the
maximum memory requirement.
3.4.2 Related Works
We have shown in Section 3.1 that most works on space performance analysis
concentrate on a specific protocol or memory architecture (at the simulator layer). They
focus mainly on the memory management of various protocols.
The first comprehensive work on memory requirement comparison among different
simulators was done by Lin and Preiss [LIN91]. They provided a thorough model for the
memory requirement of a simulator running on shared memory architecture [LIN91].
The model covers the memory requirement of the sequential simulator, the CMB
protocol and the Time Warp protocol. They focused more on the total memory
requirement (for the shared memory architecture, i.e., M
shr
). The memory for a sequential
simulator consists of memory for state variables and an event list. The CMB protocol
requires memory for state variables and event lists (they did not consider any memory