The determinants of the dutch demand for military spending
Bạn đang xem bản rút gọn của tài liệu. Xem và tải ngay bản đầy đủ của tài liệu tại đây (726.02 KB, 32 trang )
1
Title: The determinants of the Dutch demand for military spending
Erasmus University Rotterdam
Erasmus School of Economics
Department of Economics
Supervisor: Dr. B.S.Y. Crutzen
Name: N.J. Huijg BSc, LLB
Exam number: 344 872
E-mail address:
2
To be prepared for war is one of the
most effective means of preserving
peace, George Washington (1732-1799)
3
Table of content
Introduction page 04
Related literature page 05
The peace dividend page 06
Data and methodology page 08
Regression results page 11
Economic constraints page 12
Population page 14
Social welfare state page 15
Color of the government page 17
Arms race between East and West page 18
NATO commitment page 20
Robustness page 22
Summary page 24
Bibliography page 26
Appendix page 29
4
Introduction
At this point in time the world is considered to be literally on fire. Thousands of members of
the Yazidi sect in Iraq face slaughtering of radical jihadists of the Islamic State (IS). As a
response they have fled to a mountain in the northwest of the country, where they are
threatened by dehydration and fatigue. Human tragedy strikes the Promised Land as well
since the longstanding armed conflict recently intensified and claimed new casualties.
Since the Krim crisis defense politics regained importance as a political issue in the
Netherlands. President Obama stated during the Nuclear Security Summit 2014 in The Hague
that "Europe should increase its defense spending". Other influential people like former
generals and independent analysts come to the same conclusion. Remarkable, since an era of
unprecedented peace was experienced after the end of World War II. Finally, the European
Union was awarded the Nobel Peace Prize in 2012.
Fierce debates in the political arena succeeded these allegations. The most powerful statement
was made by the leader of the Dutch liberal party VVD: "the Americans paid for our security,
while we were building up our welfare state". Or just to put it in other words, have the
Netherlands indeed been free riding with the US department of defense? Other interesting
questions are if Dutch defense politics are largely economically orientated and whether
political assessments and safety motivations play minor roles.
The main goal of this thesis is to use a multivariate OLS regression to explain the military
expenditure to GDP ratio in the Netherlands and to unravel the determinants of the Dutch
demand for military spending.
The next section outlines the literature related to the determinants of military expenditures.
Afterwards the data and the constructed variables will be described. Subsequently, the
econometric results are interpreted and linked with theory. The last section concludes.
5
Related literature
Several studies have attempted to identify the determinants of military spending in developing
countries. Two groups of empirical studies can be distinguished in the literature. The first
kind of model presents arms increase in times of conflict in an action-reaction framework
(Richardson, 1960). Although this model has been developed in a number of ways, it proved
only successful in analysing the military spending of pairs of countries that are engaged in an
enduring rivalry (Deger et al, 1990).
The second kind of model focuses on economic, political and strategic determinants of
military spending (ratio). Some studies have developed from the neoclassical approach, which
considers the state as maximizing a social welfare function, where security is an integral
component produced by military expenditures (Smith, 1980). There are also case studies
which are less formal in approach but which nevertheless make important contributions
(Dunne et al, 2001).
The studies also vary from cross-country studies to case studies of individual countries. The
cross-section model explains the differences across countries but the conclusions reached may
not carry forward to differences within countries over time (Dunne et al, 2003). The panel
data method allows the cross-sectional and the time-series dynamics both to be taken into
account. Until now, such an analysis is only performed for developing countries.
Industrialized countries that are member of stable alliance systems are excluded due to
different dynamics because of possible free riding behavior (Dunne et al, 2001).
Any empirical analysis across countries is likely to encounter problems in operationalizing the
wide range of factors that can influence the demand for military spending. In contrast to
general features in those studies, individual case studies can pick up specific country factors
(Batchelor et al, 1998).
The empirical demand functions have found mixed results and clear differences across types
of countries. Some determinants of the military demand function are country specific and not
amendable to generalization (Deger et al, 1990).
6
The peace dividend
In political science a significant distinction is made between high and low politics. The former
concept covers all matters that are vital to the survival of the state and military expenditures
are regarded as one of the most important priorities of the states since it enhances security.
The latter concept is about the welfare of the state and the primary focus is on economics and
social affairs (Ripsman, 2000).
High and low politics are interrelated with respect to the devotion of scarce economic
resources. In the academic literature there is no conclusive answer to the question whether
military spending cuts stimulate economic growth. On the one hand claims are made that the
enforcement of property rights due to military expenditures encourages private investment
and growth. Extensive transport networks originally constructed for military purposes are
productive as well and military training improves the level of education (Thompson, 1974).
However, on the other hand several theories exist to reject beneficial effects from large
military expenditures since it negatively affects capital formation and resource allocation. The
empirical ambiguity in econometric findings is a result of the difficulty of disentangling short
and long run effect from military expenditures. A Keynesian government can in the short run
increase aggregate demand while in the long run military expenditures are likely to exert a
negative effect on capacity output (Hewitt, 1993).
Once peace is secured and no imminent threats exits, the political focus shifts from high to
low politics. In this case military expenditures cuts maximize the peace dividend: the
percentage difference between the level of real capacity output per capita that would result
from a given sustained reduction in the military spending ratio as compared to the baseline
path of the capacity output in the absence of such reduction (Knight et al, 1996).
In their seminal work Knight et al estimate an extension of the standard growth model that
includes an investment and a growth equation, both of which are functions of the military
spending ratio as well as other factors. They segregated developed and developing countries
since conventional wisdom suggests economic benefits from military expenditures in
developing countries are different as compared to developed countries (Hewitt, 1993). In
contrast to the ambiguous standard cross section estimates Knight et al find a significant
peace dividend in their panel estimates. Even modest deviations in growth rates have
substantial effects on the level of capacity output per worker if persisted for quite a long time.
7
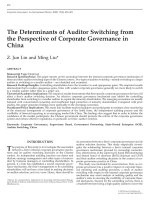
Policy makers evidently put these lessons into practice. After the end of the Cold War the
military spending ratio's for West Europe were lowest in the world, reflecting the low
incidence of major armed conflicts in this region. A penny saved on defense was a penny
earned for other political programs. These developments can perfectly be shown for the
Netherlands in the figures below.
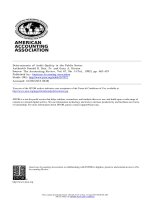
As seen in the second figure, the Netherlands have maintained a military spending to GDP
ratio of around two percent for a long period of time. It is plausible to assume this percentage
can be taken as a simple approximation of the minimum level that could be attained if lasting
world peace is achieved (Knight et al, 1996). However, the "stress zones" in the world have
recently extended and instability in other geographical regions is likely to affect Europe
(Patomäki, 2008). During the last NATO summit in Wales these concerns were addressed by
the member states and the Netherlands agreed to increase their military expenditures. This is
regarded as the end of a downward trend of military expenditures (Rutte, 2014).
Figure 1: Dutch real military spending since 1960 in € millions (Source: CBS).
Figure 2: Dutch military spending to GDP ratio since 1960 (Source: CBS).
0
200
400
600
800
1.000
1.200
1.400
1960
1962
1964
1966
1968
1970
1972
1974
1976
1978
1980
1982
1984
1986
1988
1990
1992
1994
1996
1998
2000
2002
2004
2006
2008
2010
2012
0,00%
0,50%
1,00%
1,50%
2,00%
2,50%
3,00%
3,50%
4,00%
4,50%
5,00%
1960
1962
1964
1966
1968
1970
1972
1974
1976
1978
1980
1982
1984
1986
1988
1990
1992
1994
1996
1998
2000
2002
2004
2006
2008
2010
2012
8
Data and methodology
Sample period
The time span of my analysis is from the sixties until present day. The end of World War II
practically marks a new era and during the first half of the fifties the Netherlands strengthened
their defense system after the devastations of Nazi Germany. However, during the second half
of the fifties the defense budget decreased dramatically. Since previous budgets were not
completely spent and other funds were made available, these budgetary cuts are only relevant
in accountancy terms. Because of the largely unique characteristics of the fifties when it
comes to defense spending, this decade is excluded from my analysis.
Dependent variable
The variable of interest is military expenditure to GDP ratio as measured by the Dutch
Agency for Statistics (CBS). In line with the NATO definition all costs incurred as a result of
current military activities are included.
The merit of military expenditures as measurement is debated in the academic literature.
Some dispute whether measures of input are superior to measures of output (Looney et al,
1990). Others point to the arbitrariness since retirement pensions of military personnel and
social services for personnel are included while veterans' benefits are not. Civil defense and
current expenditures for past military activities like demobilization, conversion and weapon
destruction are excluded as well (SIPRI, 2014). Therefore the variable of interest is subject to
some element of noise. However, the OLS estimators are unbiased and consistent since the
possible measurement error of the dependent variable is uncorrelated with the independent
variables (Wooldridge, 2009).
9
Independent variables
There are three categories of variables in my OLS regression: economic, political and
strategic. Regarding the list of potential economic determinants of military spending, the data
of GDP, national debt, government deficit, government spending and trade (exports +
imports) is provided by CBS. GDP data is corrected for inflation (i.e. real terms) and
converted into logarithms. The ratios of national debt, government deficit, government
spending and trade are relative to GDP since these variables are a function of national income.
The data for the political variables is derived from CBS as well. The budget of the department
of Education, Culture & Science (OCW) and the budget of the department of Social Affairs
and Employment (SZW) are expressed relative to GDP. Life expectancy indicates the number
of years a newborn infant would live if prevailing patterns of mortality at the time of its birth
were to stay the same throughout its life. The color of the government is related to the number
of seats left wing parties have in the coalition divided by the total amount of seats of the
coalition. In years of government change the coalition that is longest in office determines the
ideological color of that year.
The external war dummy is constructed as a proxy for safety. It takes on value one if the
Dutch military force is engaged in a conflict where the use of armed force between two
parties, of which at least one is the government of the state, results in at least 25 battle related
deaths (UCDP, 2013). The data is from the Department of Peace and Conflict Research of the
Uppsala University.
US military expenditures are included to test whether the Netherlands have been free riding
with the US department of defense. Data is reported by the Office of Management and
Budget, the largest office within the Executive Office of the President of the United States.
The Security Web defines neighbors and other countries that can affect a nation's security.
Since Belgium, France, Germany and the United Kingdom are NATO members only the
military expenditures of superpower Russia are relevant.
The military expenditures of the Soviet Union are a riddle wrapped in a mystery inside an
enigma (Churchill, 1939). Data is not revealed but according to the former authorities it is not
concealed because all mankind knows of the peaceable character of the Soviet government
(Sosnovy, 1964). Instead, Soviet military spending is represented by the CIA estimates of
what it would cost to replicate Soviet military forces in the US (Baumgartner et al, 2002).
10
Multivariate OLS regression
In order to discover the determinants of the Dutch demand for military spending a
multivariate OLS regression is adopted. Numerous studies have estimated the demand for
military expenditure in terms of economic, political and strategic variables (Dunne et al,
2001). My case study of the Netherlands as an individual country is less formal than the
neoclassical approach.
Most of the independent variables expressed in levels contain a unit root and are I(1).
Autoregressive terms are naturally added to the regression to correct for these time series
properties (Swank et al, 1996). The number of autoregressive is based on the Q-statistics.
1
The econometric model in my thesis represents an attempt to estimate the following equation:
MILITARY EXPENDITURE TO GDP RATIO = C + α LOG GDP + β DEBT/GDP +
ξ DEFICIT/GDP + δ GOVERNMENT EXPENDITURES/GDP + φ TRADE/GDP + γ LOG
POPULATION + η OCW/GDP + ς SZW/GDP + λ SEATS LEFT WING PARTIES + μ LIFE
EXPECTANCY + π EXTERNAL WAR + θ LOG US MILITARY EXPENDITURES +
ρ LOG SU MILITARY EXPENDITURES + ω MILITARY EXPENDITURE TO GDP
RATIO (-1) + ε
The last section contains a summary table of the coefficients and significance levels of all
variables. Conclusions regarding significance are based on the 90%, 95% and 99% confidence
interval. The correlation matrix is included in the appendix and the excel file with the
constructed variables is available upon request from the author.
1
See figure 2 Appendix
11
Regression results
The following table provides descriptive statistics for the key variables of interest. In the next
sections the econometric results are interpreted and linked with theory.
The determinants of the Dutch demand for military spending
Dependent Variable: MILITARY EXPENDITURE RATIO
Method: Least Squares
Sample: 1964 2013
Included observations: 50
Variable
Coefficient
Std. Error
t-Statistic
Prob.
C
0.761945
0.509760
1.494713
0.1440
LOG GDP
-0.014576
0.006296
-2.315110
0.0266
DEBT / GDP
-0.002174
0.003525
-0.616609
0.5415
DEFICIT / GDP
0.006472
0.012183
0.531190
0.5986
GOV SPEN / GDP
0.012255
0.006262
1.957234
0.0583
TRADE / GDP
-0.005461
0.002637
-2.070845
0.0458
LOG POPULATION
-0.044243
0.035983
-1.229562
0.2271
OCW / GDP
0.007314
0.086176
0.084869
0.9328
SZW / GDP
0.059701
0.024698
2.417232
0.0210
SEATS LEFT WING
-0.002031
0.001011
-2.009565
0.0522
LIFE EXPECTANCY
0.002021
0.000716
2.820679
0.0078
EXTERNAL WAR
0.000617
0.000759
0.813159
0.4216
LOG MIL EXP US
-0.002087
0.001741
-1.198238
0.2389
LOG MIL EXP SU
0.000547
0.000383
1.429831
0.1616
AR TERM
0.181776
0.139084
1.306950
0.1998
R-squared
0.989909
Mean dependent var
0.024382
Adjusted R-squared
0.985873
S.D. dependent var
0.008722
S.E. of regression
0.001037
Akaike info criterion
-10.66235
Sum squared resid
3.76E-05
Schwarz criterion
-10.08874
Log likelihood
281.5588
Hannan-Quinn criter.
-10.44392
F-statistic
245.2490
Durbin-Watson stat
1.709423
Prob(F-statistic)
0.000000
12
Economic constraints
During the last recession the Dutch department of defense faced enormous budgetary cuts.
Ideally, foreign policy objectives are established first and then a military strategy and force
structure is designed to meet those objectives. The cost of this force structure determines the
defense budget, at which point the economic variables and budget priorities enter the picture
(Olvey et al, 1984). However, in reality this ideal sequence is often completely reversed:
economic constraints and budgetary ceilings dictate the acceptable force structure options
(Looney et al, 1990).
The findings for the Netherlands do implicate that they live a second best world. Although the
coefficient of GDP is significant at the 95% confidence interval, the negative sign is not in
line with existing literature since military power reflects in some measure economic power
(US Commission on Integrated Long-Term Strategy, 1988).
Government deficit is a flow quantity and is essentially different from national debt which is a
stock quantity. This distinguished character of government deficit could have its own affect
on military expenditures. The influence of national debt is insignificant but the negative sign
indicates an economic constraint. On the other hand, a budgetary ceiling is not suggested by
the (insignificant) positive sign of government deficit since it is unlikely that defense
spending would increase with this variable. Furthermore, this positive relationship is
conflicting with the share of total government spending in GDP.
This variable is used to account for the fact that the military will likely benefit from
government expenditure per se (McKinlay, 1989). This claim is valid in my model because
the total government spending in GDP is significant at the 90% confidence interval. The
Dutch defense budget is therefore at least partially economically driven since government
expenditures are financed by taxes which depend on the state of the economy. The department
of defense does suffer from tighter economic constraints in times of crisis. This relationship
will be further explored in the social welfare state chapter.
13
Trade as economic characteristic of military expenditures is included in my model as well.
The hypothesis is that countries that are highly integrated in the global economy would find it
easier to access finance for arms purchases, leading to higher military expenditures (Dunne et
al, 2003). Moreover, a positive effect is expected because commercial interests need
sometimes military protection as is the case in Somalia (Department of Defense, 2014). The
established effect in my model is significant at the 95% confidence level but the negative sign
is not in line with the existing literature (Albalate et al, 2012).
14
Population
In terms of absolute military expenditures the Netherlands rank among the top twenty of
countries in the world. However, relatively they belong to the lowest forty states globally
(SIPRI, 2014). In this light the impact of population on military expenditures is questioned
since military expenditures per capita continuously declined after the end of World War II.
Population is included to pick up possible public good effects. Theory would suggest that a
high population makes military spending more effective, as the total military expenditures
benefits a larger number of people (Dunne et al, 2001). Due to scarce economic resources
there is an optimal amount of money per capita to be spent on defense.
However, previous studies have established a negative relationship and their explanation is
that a large population is considered to offer some autonomous security in itself. Invading a
country with many residents is harder than invading a country with less, all else held constant.
Small countries have to spend more on high tech weaponry as they cannot rely on a large
army. Another reason would be that a higher population generates greater additional demand
for civil consumption than it does for security requirements (Dunne et al, 2003).
In my analysis the effect of population is negative but not significant. Membership of NATO
embodies size effects as well since an attack against one ally is considered an attack against
all allies (NATO, 1949). However, public good effects of NATO membership are probably
intervening in the optimal allocation of scarce economic resources on defense. This
complicates the interpretation of the population variable.
15
Social welfare state
The scope of government expenditures related to building up the welfare state contains the
annual budget relative to GDP of the department of Education, Culture & Science (OCW) and
the annual budget relative to GDP of the department of Social Affairs & Employment
(SZ&W). With respect to economic theory the distinction of these expenditures is interesting.
The sign of the coefficients of these variables disclose whether these expenditures can be
characterized as a complementary or substitute good.
The coefficient of SZ&W is significant at the 95% confidence level and the positive signs of
both variables indicate a complementary good. Education, culture, science, social affairs and
employment are politically equivalently prioritized. The budgets of these departments reveal
common "cyclical spending properties" with the defense budget. If military expenditures
decrease, the department of OCW and the department of SZ&W will decrease as well.
This finding is in accordance with claims about powerful lobbies acting in the political arena
of The Hague. Culture and defense particularly lack such influential movements in contrast to
health care costs. Data of health care costs is only available since 1972 and inclusion will be a
disproportional concession to the sample period. Because cash flows for the department of
defense are fixed, politicians easily "grab" in the defense budget to comply with the powerful
lobby for health care expenditures. Since the start of cabinet Rutte I health care expenditures
increased with two times the annual defense budget (Hillen, 2014).
Life expectancy is included as a proxy for the demand for health care and the related
spending. Although health care costs are regarded as a substitute good, this variable is slightly
positive and significant at the 99% confidence interval. There are no statistical indicators in
my econometric framework that health expenditures are at the expense of military spending.
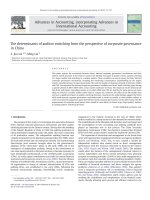
As stated in the economic constraints chapter, the relationship between government
expenditures and military spending will be further explored. Since military expenditures are
part of government spending, the positive correlation between the two variables seems
naturally. For almost thirty years the health care costs ratio to GDP was between 10% and
12%. After 2001 this bandwidth no longer applies and the percentage of health care costs
increased to almost 16% of GDP.
16
In order to test whether the positive correlation between government expenditures and
military spending is valid through the sample period an additional variable is included in my
model: government spending interacted with a dummy that takes on value one after 2001.
This additional variable has no explanatory power since this variable is not significant.
2
The sign of this interacted variable should have been negative if the defense budget was a
casualty of financing the increased health care costs due to the aging society and higher health
care costs in all stages of life (CPB, 2011). Policy makers are as a result forced to make hard
choices but the claim that military expenditures are the victim of building up the social
welfare state is not supported.
Figure 3: Dutch government expenditures relative to GDP (Source: CBS)
2
See figure 3 Appendix
0,00%
2,00%
4,00%
6,00%
8,00%
10,00%
12,00%
14,00%
16,00%
1972
1974
1976
1978
1980
1982
1984
1986
1988
1990
1992
1994
1996
1998
2000
2002
2004
2006
2008
2010
2012
Health care
SZ&W
OCW
Defense
17
Color of the government
It is widely found in the panel data analyses that democratic countries spend less on the
military than non-democracies. Autocratic states are more likely to rely on the military to
retain their grip on power and unjustifiable and inefficient levels of military expenditures are
maintained in pursuance of the interests of an elite rather than the country as a whole (Maizels
et al, 1986).
During the sample period there is no variation in the political system of the Netherlands but
coalitions change at least every four year. The influence of left wing parties is tested on
military expenditures because of the association with conscientious objectors and pacifist
movements like War Resisters International. There is no support for an electoral defense
spending cycle in the US post war era implicating military expenditures is probably not used
on a systematic basis by the president or congress as a differentiated macroeconomic policy
instrument for the purpose of winning elections (Zuk et al, 1986).
Two different variables measuring the influence of left wing parties are proposed. The first
variable is a number related to the color of the government. The average score of the coalition
parties reflects the position on the political spectrum (left wing -1, center 0 and right wing
+1). However, the average score does not reflect representation of each party within the
coalition. The second criterion is for this reason more sophisticated: the number of seats of
left wing parties in the coalition divided by the total amount of seats of the coalition.
3
Statistical theory prescribes that if a relationship shows itself strongly it should be even more
apparent using a finer classification (De Long et al, 1993). This variable will be preferred in
my analysis. The effect of the color of the government on military expenditures is negative
and significant at the 90% confidence interval.
The negative effect of left wing parties on military expenditures could be translated into a
Niskanen type bureau supply model where decision makers act to maximize budget size.
What they consider the optimal level of defense capability reflects circumstances in time
(Niskanen, 1971). The mutable political power of left wing parties is one of these
determinants. Perception of internal and external threats and defining economic constraints
are both linked to the political parties in power.
3
See table 1 Appendix
18
Arms race between East and West
"We make war so that we may live in peace", Aristotle (384 – 322 B.C.). One would therefore
expect the demand for military spending to be influenced by the strategic environment and
foreign policy objectives. The importance of strategic variables like security and threat
perceptions are investigated, just as the authority of the US as leader of the free world.
The EU was awarded the Nobel Peace Prize in 2012 because of its contribution for over six
decades to the advancement of peace and reconciliation, democracy and human rights in
Europe. This act induced great controversy since the Nobel Committee did not distinguish
between external and internal conflicts. In the academic literature is noted that the end of the
Cold War effectively terminated superpower proxy wars in the developing world (Batchelor
et al, 1998).
Civil war is since then far more common than international conflict. The outbreak of internal
conflicts is determined by opportunities and objective grievances (Collier et al, 2004). Three
sources for financing rebellion are considered: extortion of natural resources, donations from
diasporas and subventions from hostile governments. Another dimension of opportunity is
weak government capability. There are four objective measures of grievance: ethnic or
religious hatred, political repression, political exclusion and economic inequality. In the
Netherlands opportunities and grievances are absent (SIPRI, 2014). Because no internal
threats are faced this aspect is excluded from the analysis.
With respect to external threats the Security Web is an important concept. This defines
neighbors and other countries that can affect a nation's security. Rosh (1988) uses the average
military burden of the Security Web. Nevertheless, in case of two unequal rivals the absolute
level of military expenditures is a better measure. India for example spends about twice as
much on defense as Pakistan in absolute terms but the mirror image occurs for Pakistan in
relative terms. To counter the higher absolute level of threat, Pakistan devotes a higher
proportion of its resources (Dunne et al, 2001). This applies to my thesis since the comparison
between Russia and the Netherland is unequal as well.
In the conceptual framework of the Security Web three nested variables are constructed. The
military expenditures of neighbors are extended to regional powers and finally super powers
are included. Since Belgium, France, Germany and the United Kingdom are NATO members
only Russia as super power is relevant.
19
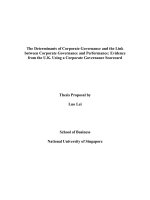
The Soviets undertook in the beginning of the early sixties a rapid expansion of military
capabilities. This situation continued through the seventies, so that by the end of that decade
the gravity of the military threat posed by the Soviet Union began to impress the American
people and their leaders (Looney et al, 1990). The arms race with the US could not be
sustained due to poor economic development. As noted before, military power reflects in
some measure economic power.
The counterpart of NATO was the Warschaupact with the Soviet Union as most important
member. The unremitting arms race between East and West seems strikingly not to affect
Dutch military expenditures since Russian military expenditures are insignificant. This is an
indication for free riding behavior of the Netherlands with the NATO alliance.
The end of the Cold War has been a clear change in the strategic environment (Dunne et al,
2003). The fall of the Berlin Wall symbolized the failure of the Soviet Union because the
Marxism-Leninism ideology has not prevailed (Bowker, 1997). The presence of a structural
break is tested with a dummy that takes the value of zero before 1989 and one afterwards. The
collapse of the Soviet Union did not mark a structural break in my analysis.
4
Figure 4: The arms race between East and West in $ millions (Source: The Office
of the Under Secretary of Defense for Policy).
4
See figure 4 Appendix
0
100.000
200.000
300.000
400.000
500.000
600.000
NATO
Warschaupact
20
NATO commitment
The conflict with Indonesia about the territory of New Guinea in 1962 is bilateral but most
foreign missions with respect to the external war dummy are multilateral. Sacrifices in the
Korean War, Operation Desert Storm, the Kosovo War and the War on Terror are all
performed under NATO or UN command. Safety motivations seem to play a minor role in the
determination of the Dutch military expenditures because the external war is not significant.
These missions point directly to the importance of the North Atlantic Treaty Organization
(NATO). The organization constitutes a system of collective defense whereby its member
states agree to mutual defense in response to an attack by any external party, initially
communist countries in Eastern Europe. The Dutch government confirmed in the cabinet
meeting in 1951 the rapidly deteriorating relation between East and West. However, due to
American NATO membership a direct attack by the Soviet Union seemed unlikely to the
Dutch government. According to former Prime Minister Drees the political importance
outweighed the military effectiveness of the alliance, which was in his view insufficiently
equipped. The preservation of freedom was served best by economic and social policy.
Military expenditures only negatively affected economic and social conditions (Brouwer et al,
1992).
This raises the question whether the Netherlands have been free riding with the US
department of defense, a claim recently made by the leader of the Dutch liberal party VVD,
who stated that "the Americans paid for our security, while we were building up our welfare
state".
Either by formal treaty, presidential declaration or executive agreement the US is committed
to provide military support to several nations throughout the world. Probably no other
barometer of US capabilities in fulfilling those commitments is so closely watched as the
level of its spending on defense (Looney et al, 1990). Unquestionably, the US has been the
most formidable military power the last decades. Hence, US military expenditures are
included in my analysis. Although the coefficient is negative, the claim of the VVD leader is
not supported since the US military expenditures variable is not significant.
21
A possible explanation is that the interests of the Netherlands are only perfectly aligned with
the interests of the US in the intergovernmental military alliance NATO. By foundation the
member states agreed to spend two percent of their GDP on defense but most nations except
the US fail to fulfill this quota (Schramade, 2013).
Besides this commitment countries contribute to the military budget, the civil budget and the
security investment program (NSIP). NATO operations are directly funded by these three
common accounts. However, financial reporting of NATO is inscrutable (International Board
of Auditors for NATO, 2013). The military budget is largest of the three accounts and
individual member states contributions are based on a cost sharing formula, which remain
unchanged for a certain period of time (Ek, 2012).
The undisputed leader of the alliance is the US and much of the costs are born by this power.
The US share of the NATO burden is a notable complaint and concerns about the future of the
transatlantic defense cooperation have become more pronounced (O'Donnell, 2012). In the
NATO alliance the pure public good attribute of national defense and differences in member
size combine to create free riding behavior by smaller alliance members. This result holds
even when the level of GDP per capita is held constant and when is corrected for more
influence on alliance policy in return of a greater share of alliance costs. Only in times of all
out war or exceptional insecurity when defense is an absolutely superior good, disproportional
burden sharing will decrease (Olson et al, 1966).
The cost sharing formula of the common NATO accounts is renegotiated from time to time.
However, the US is deprived of their strongest bargaining weapon: not helping to defend the
smaller powers became after the treaty ratification an incredible threat. The tendency toward
sub optimality and disproportionally is stronger the more complete the unity of purpose
among the allies; divergence of interests within the organization will increase the private
(national) benefits from the national contributions to the alliance (Olson et al, 1966).
Political and moral statements by president Obama that every NATO member has to do its
fair share will not provoke any change (Hallams et al, 2012). Only institutional reforms to the
Pareto optimal point of disagreement can alleviate the sub optimality since there is obviously
a point beyond which differences of purpose will destroy an alliance. This remains a
challenge for the future (Santen et al, 2008).
22
Robustness
The multivariate OLS regression has tried to unravel the determinants of the Dutch military
expenditure ratio. However, most academic articles in the scope of defense economics have
published about the effect of explanatory variables on the level of military expenditures.
These papers have converted the (real) military expenditures into logarithms but have not
addressed the issue of stationarity.
The data of the Dutch defense spending as well as the independent variables expressed in
levels contain a unit root and are I(1). Autoregressive terms are naturally added to the
regression to correct for these time series properties. A sensitivity check is performed with
LOG MILITARY EXPENDITURES as alternative dependent variable to verify the
robustness of my results.
Sensitivity check of the determinants of the Dutch demand for military spending
Dependent Variable: LOG MILITARY EXPENDITURES
Method: Least Squares
Sample: 1964 2013
Included observations: 50
Variable
Coefficient
Std. Error
t-Statistic
Prob.
C
34.60775
18.61760
1.858873
0.0715
LOG GDP
0.814041
0.229944
3.540173
0.0012
DEBT / GDP
0.103443
0.128757
0.803397
0.4272
DEFICIT / GDP
0.182407
0.444959
0.409941
0.6843
GOV SPEN / GDP
0.752312
0.228689
3.289670
0.0023
TRADE / GDP
-0.424496
0.096304
-4.407870
0.0001
LOG POPULATION
-2.416914
1.314182
-1.839101
0.0744
OCW / GDP
0.236007
3.147355
0.074986
0.9407
SZW / GDP
3.412758
0.902031
3.783413
0.0006
SEATS LEFT WING
-0.050724
0.036916
-1.374058
0.1782
LIFE EXPECTANCY
0.047119
0.026164
1.800909
0.0803
EXTERNAL WAR
-0.007772
0.027708
-0.280488
0.7808
LOG MIL EXP US
-0.087118
0.063601
-1.369752
0.1795
LOG MIL EXP SU
0.045800
0.013977
3.276714
0.0024
AR TERM
5.579336
5.079679
1.098364
0.2795
R-squared
0.945479
Mean dependent var
6.931253
Adjusted R-squared
0.923670
S.D. dependent var
0.137037
S.E. of regression
0.037860
Akaike info criterion
-3.466505
Sum squared resid
0.050169
Schwarz criterion
-2.892898
Log likelihood
101.6626
Hannan-Quinn criter.
-3.248073
F-statistic
43.35382
Durbin-Watson stat
2.069049
Prob(F-statistic)
0.000000
23
The modification of GDP as explanatory variable is straightforward since the dependent
variable military expenditure ratio already corrected for national income. The positive and
significant effect of GDP in this model implicates that military power reflects in some
measure economic power (US Commission on Integrated Long-Term Strategy, 1988).
Although all coefficients of the independent variables are (slightly) altered, the results of
deficit, government spending, trade, OCW, SZW, life expectancy and US military
expenditures are quite robust. The variables debt and external war establish a negative instead
of a positive relationship but they remain insignificant. The impact of population is
strengthened and becomes significant. The interpretation in terms of significance of the
explanatory variables seats of left wing parties and SU military expenditures has changed as
well.
The analysis about the determinants of military expenditures is never performed for
industrialized countries that are member of stable alliance systems. My thesis has tried to
clarify the different dynamics because of possible free riding behavior. Ideally, this is the start
of further research.
24
Summary
Economic, political and strategic variables are considered in an OLS regression to unravel the
determinants of the Dutch demand for military spending. Economic constraints and budgetary
ceilings do not directly dictate these annual expenditures but there is some evidence that the
department of defense does suffer from tighter economic constraints in times of crisis.
Once developing and developed countries were separated in the analysis of Knight et al it
turned out there is indeed a significant peace dividend. The military spending ratio of the
Netherlands is globally among the lowest forty and can be regarded as the minimum level
once peace is secured.
The peace dividend was maximized because of the low incidence of major armed conflicts.
Safety motivations seem not to affect military expenditures. The collapse of the Soviet Union
did not mark a structural break and this is an indication for free riding behavior of the
Netherlands with the NATO alliance.
Foreign policy objectives of the Netherlands are perfectly aligned with the interests of the US
in NATO. The pure public good attribute of national defense and differences in member size
combine to create free riding behavior and the tendency toward sub optimality and
disproportionally is stronger the more complete the unity of purpose among the allies. Former
Prime Minister anticipated the political importance of US membership already by foundation
of the intergovernmental military alliance.
As a result, the Netherlands shifted the political focus after World War II from high to low
politics. The welfare state is a social democratic concept and left wing parties in the coalition
have a negative effect on military expenditures. Political parties in power define the strategic
environment and indirectly determine economic constraints.
Due to the Krim crisis and the brutal Jihad by IS defense regained emphasis in the political
arena and as a reaction the Netherlands agreed to increase their military expenditures. Or to
conclude with the words of Machiavelli, the ruler should never divert his thought from
defense; in times of peace he must become even more proficient.
25
Summary statistics: the coefficients and the significance levels of all variables
MIL EXP RATIO
(BASIC MODEL)
MIL EXP RATIO
(FIG II APP.)
MIL EXP RATIO
(FIG III APP.)
LOG MIL EXP
(ROBUSTNESS)
C
0.761945
(0.509760)
0.938602
(0.562598)
0.755421
(0.505510)
34.60775
(18.61760)*
LOG GDP
-0.014576
(0.006296)**
-0.012200
(0.007057)*
-0.015884
(0.006329)**
0.814041
(0.229944)***
DEBT / GDP
-0.002174
(0.003525)
6.62E-06
(0.004553)
-0.003676
(0.003693)
0.103443
(0.128757)
DEFICIT / GDP
0.006472
(0.012183)
0.007985
(0.012416)
0.008778
(0.012218)
0.182407
(0.444959)
GOV SPEN / GDP
0.012255
(0.006262)*
0.013787
(0.006611)**
0.017349
(0.007404)**
0.752312
(0.228689)***
GOV SPEN / GDP *
HEALTH
0.003132
(0.004102)
TRADE / GDP
-0.005461
(0.002637)**
-0.005702
(0.002671)**
-0.004725
(0.002679)*
-0.424496
(0.096304)***
LOG POPULATION
-0.044243
(0.035983)
-0.055834
(0.039253)
-0.042393
(0.035711)
-2.416914
(1.314182)*
OCW / GDP
0.007314
(0.086176)
-0.003465
(0.087836)
0.023238
(0.086379)
0.236007
(3.147355)
SZW / GDP
0.059701
(0.024698)**
0.063954
(0.025463)**
0.054444
(0.024842)**
3.412758
(0.902031)***
SEATS LEFT WING
-0.002031
(0.001011)*
-0.002095
(0.001020)**
-0.002616
(0.001104)**
-0.050724
(0.036916)
LIFE
EXPECTANCY
0.002021
(0.000716)***
0.002017
(0.000721)***
0.001872
(0.000720)**
0.047119
(0.026164)*
EXTERNAL WAR
0.000617
(0.000759)
0.000211
(0.000930)
0.000356
(0.000780)
-0.007772
(0.027708)
LOG MIL EXP US
-0.002087
(0.001741)
-0.003168
(0.002253)
-0.002252
(0.001732)
-0.087118
(0.063601)
LOG MIL EXP SU
0.000547
(0.000383)
0.000575
(0.000387)
0.000697
(0.000398)*
0.045800
(0.013977)***
COLD WAR
0.001553
(0.001230)
AR TERM
0.181776
(0.139084)
0.167127
(0.141230)
0.152555
(0.139846)
5.579336
(5.079679)
Note: standard errors in parentheses; * significant at 10%, ** significant at 5%, *** significant at 1%.