The function of anxiety fear related genes in animal models 3
Bạn đang xem bản rút gọn của tài liệu. Xem và tải ngay bản đầy đủ của tài liệu tại đây (974.81 KB, 41 trang )
List of tables/figures
161
LIST OF TABLES/FIGURES
Table 1-1. Some animal (behavior) models of anxiety/fear
Table 2-1. The primer sequence, expected length of PCR product and corresponding
GenBank accession number of β-actin, CCK2 and 5-HT receptors
Table 3-1. Freezing behavior and locomotor activity of PVG hooded and SD rats on
cat exposure test
Table 4-1. The primer sequence, expected length of PCR product and
corresponding GenBank accession number of Arc, NGFI-A, 5-HT3R and β-actin
Table 4-2. The 16 up-regulated genes in PVG hooded rats compared to SD rats
Table 4-3. The 38 up-regulated genes in SD rats compared to PVG hooded rats
Table 4-4. Receptors of some neurotransmitters which were differentially expressed
and their abundance ratios between PVG hooded and SD rats
Figure 1-1. Predicted structure of human preprocholecystokinin
Figure 1-2. Schematic representation of the rat CCK1 receptor
Figure 1-3. Schematic representation of the rat CCK2 receptor
Figure 1-4. Alignment of members of the corticotropin-releasing factor (CRF)
peptide family
Figure 1-5. Dendrogram showing the relatedness of corticotropin-releasing factor
receptors (CRF-Rs) from different species
Figure 1-6. Interactions between mammalian corticotropin releasing factor (CRF)like peptides, their receptors and the CRF binding protein (CRF-BP)
Figure 2-1. The illustration of the elevated plus maze for SD rats
List of tables/figures
162
Figure 2-2. Variations in anxious level in SD rats on the elevated plus-maze
Figure 2-3. Gene expression of CCK2 receptor between the high and low anxiety
rats screened by the elevated-plus maze
Figure 2-4. Gene expression of 5-HT1A receptor between the high and low anxiety
rats screened by the elevated-plus maze
Figure 2-5. Gene expression of 5-HT1B receptor between the high and low anxiety
rats screened by the elevated-plus maze
Figure 2-6. Gene expression of 5-HT2A receptor between the high and low anxiety
rats screened by the elevated-plus maze
Figure 2-7. Gene expression of 5-HT3 receptor between the high and low anxiety
rats screened by the elevated-plus maze
Figure 3-1. CCK2 receptor gene expression in six brain regions of PVG hooded and
SD rats after cat exposure
Figure 4-1. Representative images of cDNA microarray results comparing PVG
hooded and SD rats
Figure 4-2. The expression of mRNA for Arc, NGFI-A, 5-HT3 receptor (5HT3R)
and β-actin in PVG hooded and SD rats by reverse transcription-polymerase chain
reaction (RT-PCR)
Figure 5-1. Effects of intraperitoneal administration (0.1 mg/kg) of LY225910 and
CCK-4 in PVG hooded and SD rats on freezing behavior and locomotor activity
Figure 5-2. CCK2 receptor gene expression in cortex and hippocampus of PVG
hooded and SD rats among the control, CCK-4 and LY225910 groups.
Figure 6-1. Genetic variants in the coding region of the CCK2 receptor gene
Figure 7-1. The stereotaxic apparatus
List of tables/figures
163
Figure 7-2. Anatomical localization of the injection sites of i.c.v., i.h. and i.s..
Figure 7-3. The elevated plus maze apparatus
Figure 7-4. Fear conditioning apparatus
Figure 7-5. Dose-dependent anxiogenic action of CCK4 in C57BL/6J mice in the
elevated plus-maze
Figure 7-6. The anxiogenic effect of CCK4 in the elevated plus-maze was blocked
by CCK2 receptor antagonist CR2945
Figure 7-7. The anxiogenic effect of CCK4 in the elevated plus-maze was blocked
by h/rCRF receptor antagonist acetic astressin
Figure 7-8. The effect of CCK4 on context- and tone-dependent fear conditioning
Figure 7-9. h/rCRF receptor antagonist acetic astressin blocked the effect of CCK4
on context- and tone-dependent fear conditioning.
Figure 7-10. The anxiogenic effect of CCK4 after i.h. injection in the elevated plusmaze was blocked by h/rCRF receptor antagonist acetic astressin
Figure 7-11. The effect of CCK4 on context- and tone-dependent fear conditioning
after i.h. injection
Figure 7-12. The i.s. injection of CCK4 did not produce anxiogenic effect in
C57BL/6J mice in the elevated plus-maze
164
Tables
Table 1-1. Some animal (behavior) models of anxiety/fear
Conditioned responses
Unconditioned responses
Geller-Seifter conflict
Elevated plus-maze (and zero-maze)
Vogel conflict
Open field
Conflict tests: pigeons, primates
Light/dark exploration
Four-plate test
Free exploration
Conditioned emotional response (CER)
Holeboard
Conditioned taste aversion (CTA)
Staircase test
Fear potentiated startle
Social interaction
Defensive burying
Social competition
Active/passive avoidance
Ultrasonic vocalization (pain or separation)
Learned helplessness
Human threat (primates)
Electrical brain stimulation (dPAG)
Fear/anxiety-defence test batteries
*Procedures may be different on the basis of whether or not they involve conditioning
(adapted from Rodgers and Dalvi, 1997). dPAG: dorsal periaqueductal grey matter
165
Tables
Table 2-1. The primer sequence, expected length of PCR product and corresponding
GenBank accession number of β-actin, CCK2 and 5-HT receptors.
Gene
Primer
Expected
length (bp)
GenBank
accession
number
β-actin se
β-actin as
CCK2 se
CCK2 as
5-HT1A se
5-HT1A as
5-HT1B se
5-HT1B as
5-HT2A se
5-HT2A as
5-HT3 se
5-HT3 as
5’-ATCTGGCACCACACCTTCTACAATGAGCTGCG-3’
5’-CGTCATACTCCTGCTTGCTGATCCACATCTGC-3’
5’-CGCCTAAGAACGGTCACCAACG-3’
5’-AACAATCACTAGCAGCATTCGCACC-3’
5’-AGCATCTCCGACGTGACCTTCAGCTACCA-3’
5’-GCTCCCTTCTTTTCCACCTTCCTGACAGT-3’
5’-GCCGACGACTACATTTACCAGGACTCCAT-3’
5’-TGCCGGTCTTGTTGGGTGTCTGTTTCA-3’
5’-CATGCCTCTCCATTCTTCATCTCCAGGAA-3’
5’-CAAGGTGGCTTCTTTCTGAAGTGACTTGA-3’
5’-GAGACCATCTTCATTGTGCAGCTGGTGCA-3’
5’-ACAGCAGCGTGTCCAGCACATATCCCACC-3’
838
BC014401
783
M99418.1
635
NM_012585.1
643
NM_022225.1
611
NM_017254.1
956
U59672
* se: sense primer. as: antisense primer. bp: basepair.
166
Tables
Table 3-1. Freezing behavior and locomotor activity of PVG hooded and SD rats on
cat exposure test
Rat strain
Freezing behavior on cat
Locomotor activity
exposure (% session time)
Control
Cat-exposed
PVG hooded
87±3
811±132
170±9
Sprague-Dawley
9±3
1007±153
548±51
* Freezing behavior was expressed as the percentage of session time (20 min).
Controls were exposed to only an empty cat compartment. Locomotor activity was
expressed as total number of beam interruptions during the test period. Freezing was
significantly different between the two strains, t = 25.449, p< 0.001. One-way
ANOVA for locomotor activity: F(3,12) = 11.996, p< 0.001. Post hoc Tukey:
significantly different between control and cat-exposed for both PVG (p< 0.005) and
SD (p < 0.05) rats.
167
Tables
Table 4-1. The primer sequence, expected length of PCR product and
corresponding GenBank accession number of Arc, NGFI-A, 5-HT3R and β-actin
Gene
Primer
Expected
length (bp)
GenBank
accession
number
Arc se
Arc as
NGFI-A se
NGFI-A as
5HT3R se
5HT3R as
β-actin se
β-actin as
5’-ATACCAGTCTTGGGTGCCAG-3’
5’-AGTGTCTGGTACAGGTCCCG-3’
5’-GCAACAATTTGTGGCCTGAA-3’
5’-GAGTTGGGACTGGTAGGTGT-3’
5’- TTATGTGTATGTGCACCATCAAGGTGAA-3’
5’-ACAGCAGCGTGTCCAGCACATATCCCACC-3’
5’-ATCTGGCACCACACCTTCTACAATGAGCTGCG-3’
5’-CGTCATACTCCTGCTTGCTGATCCACATCTGC-3’
357
U19866
512
M18416
956
U59672
838
BC014401
* se: sense primer. as: antisense primer. bp: basepair.
Tables
168
Table 4-2. The 16 up-regulated genes in PVG hooded rats compared to SD rats
ratio
2.1
2.0
1.8
1.7
1.6
1.6
1.6
1.5
1.5
1.5
1.5
1.5
1.5
1.5
1.5
1.5
gene name
Rat fibroblast growth factor putative isoform 2 (FGF) mRNA, complete cds, alternatively spliced.
Mouse FK506 binding protein 51 mRNA, complete cds.
Messenger RNA for rat preproalbumin.
Rat gastric intrinsic factor mRNA, complete cds.
Rat MHC class I antigen (RT1.EC3) gene, complete cds.
Mouse S3-12 mRNA, complete cds.
Rat caveolin-3 mRNA, complete cds.
Rat mRNA for pre-alpha-inhibitor, heavy chain 3.
Rat synaptotagmin VI mRNA, complete cds.
Mouse ERCC2 gene, genomic sequence.
Mouse major histocompatibility locus class II region.
Rat mRNA (rls2var1) for leuserpin-2.
Rat Wistar transforming growth factor beta-3 mRNA, complete cds.
Rat mRNA for fibronectin.
Mouse mRNA for type II 57 kd keratin.
Mouse protein phosphatase 1 binding protein PTG mRNA, complete cds.
* Ratio is the balanced differential expression between two samples. If the ratio is
positive, the gene in PVG channel is up regulated; the negative ratio means the gene
in SD channel is up regulated. (cds: coding DNA sequence)
Tables
169
Table 4-3. The 38 up-regulated genes in SD rats compared to PVG hooded rats
ratio
-2.0
-1.9
-1.8
-1.8
-1.7
-1.7
-1.7
-1.7
-1.7
-1.6
-1.6
-1.6
-1.6
-1.6
-1.6
-1.6
-1.6
-1.6
-1.6
-1.6
-1.6
-1.6
-1.5
-1.5
-1.5
-1.5
-1.5
-1.5
-1.5
-1.5
-1.5
-1.5
-1.5
-1.5
-1.5
-1.5
-1.5
-1.5
gene name
Rat activity-regulated cytoskeleton-associated gene (Arc) mRNA, complete cds.
Rat carbonic anhydrase III (CA3) mRNA, complete cds.
Mouse (Mus musculus domesticus) transcription factor IID (Tbp) mRNA, complete cds.
Rat partial mRNA for MHC class Ia A2h antigen (RT1-A2h gene).
Mouse myelin proteolipid protein mRNA, complete cds.
Rat SC1 protein mRNA, complete cds.
Rat prealbumin (transthyretin) mRNA, complete cds.
Rat nerve growth factor-induced (NGFI-A) gene, complete cds.
Rat prostaglandin F2a receptor mRNA, complete cds.
rat myelin basic protein (mbp) gene mrna.
Rat mRNA for neurodegeneration associated protein 1, complete cds.
Rat (clone pCNPII) 2',3'-cyclic nucleotide 3'-phosphodiesterase (CNPII) mRNA, complete cds.
Rat microtubule-associated protein 1A MAP1A (Mtap-1) mRNA, complete cds.
Rat mRNA for microtubule associated protein IB.
Rat partial GR gene for glucocorticoid receptor, promoter region.
63 kDa calmodulin-stimulated phosphodiesterase
Rat mRNA for cytoplasmic dynein 74 kD intermediate chain.
Rat neural membrane protein 35 mRNA, complete cds.
Rat non-processed neurexin I-beta mRNA, complete cds.
microtubule-associated protein, MAP-115
Rat rab GDI alpha mRNA.
Rat Ca2+-dependent activator protein (CAPS) mRNA, complete cds.
Mouse epidermal keratin type I intermediate filament gene, exon 1.
Rat mRNA for calcineurin A.
Rat Myo5a mRNA for myosin-Va, complete cds.
Mouse mRNA for neuroserpin.
Mouse GABA-A receptor gamma-2 subunit mRNA, complete cds.
Rat kinesin-like protein KIF1B (KIF1B) mRNA, partial cds.
Mouse zinc finger protein (Peg3) mRNA, complete cds.
Mouse mRNA for SmN protein.
Rat GABA-A receptor alpha-1 subunit gene, complete cds.
Mouse ubiquitinating enzyme E2-20K mRNA, complete cds.
Rat mRNA for SNERG-1 protein.
Rat mRNA for cathepsin L (EC 3.4.22.15).
Rat GluT and GluT-R glutamate transporter mRNA, complete cds.
Rat gamma-adducin mRNA, complete cds.
Rat D-binding protein mRNA, complete cds.
Rat metabotropic glutamate receptor 2 mRNA, primary transcript.
* Ratio is the balanced differential expression between two samples. If the ratio is
positive, the gene in PVG channel is up regulated; the negative ratio means the gene
in SD channel is up regulated. (cds: coding DNA sequence)
170
Tables
Table 4-4. Receptors of some neurotransmitters which were differentially expressed
and their abundance ratios between PVG hooded and SD rats
ratio gene type
gene name
-1.5 GABA receptor Rat GABA-A receptor alpha-1 subunit gene, complete cds.
-1.3
Rat mRNA for GABA-BR1b receptor.
-1.3
Rat GABAB1 receptor (GABABR1) gene, exons 1 through 9.
-1.3
Rat GABA-A receptor alpha-6 subunit gene, complete cds.
-1.2
Rat GABA-A receptor alpha-4 subunit gene, complete cds.
-1.2
Rat GABA-A receptor delta-subunit gene, complete cds.
1.2
Rat mRNA for GABA(A) receptor gamma-1 subunit.
-1.2
Rat GABA-A receptor alpha-5 subunit gene, complete cds.
-1.2
Rat GABA-A receptor alpha-6 subunit cDNA.
1.3 CCK receptor
Rat brain cholecystokinin receptor mRNA, complete cds.
-1.2
Rat gene for cholecystokinin type-A receptor (CCKAR), complete cds.
1.2 5-HT3 receptor Rat 5HT3 receptor mRNA, complete cds.
* Ratio is the balanced differential expression between two samples. If the ratio is
positive, the gene in PVG channel is up regulated; the negative ratio means the gene in
SD channel is up regulated. (cds: coding DNA sequence)
Figures
171
Figure 1-1. Predicted structure of human preprocholecystokinin. The signal peptide
consists of residues 20 to 1. The amino terminal flanking peptide consists of
residues 1 to 25. The largest characterized form from brain and intestine, CCK-58,
consists of residues 26 to 83. Other active molecular forms are derived from this
precursor, such as CCK-39, CCK-33, CCK-22, CCK-7, and CCK-5 (Nobel et al.,
1999).
Figures
172
Figure 1-2. Schematic representation of the rat CCK1 receptor showing the
postulated transmembrane topology, sites for putative NH2-linked glycosylation
(tridents), serine and threonine phosphorylation by PKC and protein kinase A (PO3),
and conserved cysteines in the first and second ECLs, possibly forming a disulfide
bridge, and a possible palmitoylated conserved cysteine in the cytoplasmic tail
(Nobel et al., 1999). NH2---, N terminus; COOH---, C terminus.
Figures
173
Figure 1-3. Schematic representation of the rat CCK2 receptor showing the
postulated transmembrane topology, sites for putative NH2-linked glycosylation
(tridents), serine and threonine phosphorylation by PKC and protein kinase A (PO3),
and conserved cysteines in the first and second ECLs, possibly forming a disulfide
bridge, and a possible palmitoylated conserved cysteine in the cytoplasmic tail
(Nobel et al., 1999). NH2---, N terminus; COOH---, C terminus.
Figures
174
Figure 1-4. Alignment of members of the corticotropin-releasing factor (CRF)
peptide family. The amino acids that are homologous between the CRF peptides are
boxed. Human stresscopin-related peptide (SRP) and human urocortin II (UCNII)
are identical. Human stresscopin (SCP) and human UCNIII also have identical
amino acid sequences (Dautzenberg and Hauger, 2002). Abbreviations: h, human; m,
mouse; o, ovine; SVG, sauvagine; URO, urotensin I.
Figures
175
Figure 1-5. Dendrogram showing the relatedness of corticotropin-releasing factor
receptors (CRF-Rs) from different species (Spiess et al., 1998). cCRF-R1, chicken
CRF-R1; hCRF-R, human CRF-R; mCRF-R, mouse CRF-R; rCRF-R, rat CRF-R;
xCRF-R, Xenopus CRF-R.
Figures
176
Figure 1-6. Interactions between mammalian corticotropin releasing factor (CRF)like peptides, their receptors and the CRF binding protein (CRF-BP). Binding to the
CRF-BP or activation of CRF1 or CRF2 receptors stimulates or decreases a wide
range of physiological responses (Dautzenberg and Hauger, 2002). Abbreviations:
SCP, stresscopin; UCN, urocortin.
Figures
177
Figure 2-1. The illustration of the elevated plus maze for SD rats. The plus-maze
was elevated by 50 cm above floor level and comprised of 2 (opposite) closed and 2
open arms, each 50 cm by 10 cm. The closed arms had 40 cm high side and end
walls. This apparatus was set up in a test room with a video camera mounted to the
maze. Each rat was tested on the elevated plus-maze apparatus for a stipulated period
of 300 seconds.
178
Figures
Figure 2-2. Variations in anxious level in SD rats on the elevated plus-maze. The
time spent on the open arms was expressed as percentage of the total session time
(300 s). Five rats with the longest open arm times were used as the low anxiety
group and 5 rats with the shortest open arm times were used as the high anxiety
group.
% Time spent in open arms
100
80
60
40
20
0
1
5
9 13 17 21 25 29 33 37 41 45 49 53 57 61 65 69 73 77 81 85
ANIMAL NUMBER
179
Figures
Figure 2-3. Gene expression of CCK2 receptor between the high (solid bars) and low
(open bars) anxiety rats screened by the elevated-plus maze. PCR products were
quantified based on the electrophoresis of the 1% agarose gel using NIH imageprocessing software. Ratios of the corresponding density (CCK2 /β-actin) were
calculated for each sample and used for quantitative calculations and comparisons.
The PCR bands that were statistically significant were shown above the
corresponding bars. The top band in each group was β-actin and the bottom was the
target product. * p<0.05
2
*
*
1
0.5
m
ce
re
be
llu
n
m
id
br
ai
us
am
po
th
al
hy
m
oc
a
pp
hi
st
ria
tu
pu
s
m
0
co
rt
ex
arbitrary units
1.5
180
Figures
Figure 2-4. Gene expression of 5-HT1A receptor between the high (solid bars) and
low (open bars) anxiety rats screened by the elevated-plus maze. PCR products were
quantified based on the electrophoresis of the 1% agarose gel using NIH imageprocessing software. Ratios of the corresponding density (5-HT1A /β-actin) were
calculated for each sample and used for quantitative calculations and comparisons.
The PCR bands that were statistically significant were shown above the
corresponding bars. The top band in each group was β-actin and the bottom was the
target product. * p<0.05
1.5
*
1
0.5
m
ce
re
be
llu
n
m
id
br
ai
us
am
po
th
al
hy
m
oc
a
pp
hi
st
ria
tu
pu
s
m
0
co
rt
ex
arbitrary units
*
181
Figures
Figure 2-5. Gene expression of 5-HT1B receptor between the high (solid bars) and
low (open bars) anxiety rats screened by the elevated-plus maze. PCR products were
quantified based on the electrophoresis of the 1% agarose gel using NIH imageprocessing software. Ratios of the corresponding density (5-HT1B /β-actin) were
calculated for each sample and used for quantitative calculations and comparisons.
1
0.5
m
ce
re
be
llu
n
m
id
br
ai
us
am
po
th
al
hy
m
oc
a
pp
hi
st
ria
tu
pu
s
m
0
co
rt
ex
arbitrary units
1.5
182
Figures
Figure 2-6. Gene expression of 5-HT2A receptor between the high (solid bars) and
low (open bars) anxiety rats screened by the elevated-plus maze. PCR products were
quantified based on the electrophoresis of the 1% agarose gel using NIH imageprocessing software. Ratios of the corresponding density (5-HT2A /β-actin) were
calculated for each sample and used for quantitative calculations and comparisons.
The PCR bands that were statistically significant were shown above the
corresponding bars. The top band in each group was β-actin and the bottom was the
target product. * p<0.05
2
*
1
0.5
m
ce
re
be
llu
n
m
id
br
ai
us
am
po
th
al
hy
m
oc
a
pp
hi
st
ria
tu
pu
s
m
0
co
rt
ex
arbitrary units
1.5
183
Figures
Figure 2-7. Gene expression of 5-HT3 receptor between the high (solid bars) and
low (open bars) anxiety rats screened by the elevated-plus maze. PCR products were
quantified based on the electrophoresis of the 1% agarose gel using NIH imageprocessing software. Ratios of the corresponding density (5-HT3 /β-actin) were
calculated for each sample and used for quantitative calculations and comparisons.
The PCR bands that were statistically significant were shown above the
corresponding bars. The top band in each group was β-actin and the bottom was the
target product. * p<0.05
2
*
*
1
0.5
m
ce
re
be
llu
n
m
id
br
ai
us
am
po
th
al
hy
m
oc
a
pp
hi
st
ria
tu
pu
s
m
0
co
rt
ex
arbitrary units
1.5
184
Figures
Figure 3-1. CCK2 receptor gene expression in six brain regions of PVG hooded
(open bars) and SD (solid bars) rats after cat exposure. a: The gel image of
electrophoresis of CCK2 and β-actin. PCR products were separated by 1% TAE
agarose gel which was stained with ethidium bromide (1µg/ml) and then
photographed under UV light. The lengths of CCK2 and β-actin PCR products are
783bp and 836bp. 1: cortex; 2: striatum; 3: hypothalamus; 4: hippocampus; 5:
midbrain; 6: cerebellum. b: The level of CCK2 was expressed as a ratio of the PCR
product density CCK2/β-actin. The integrated density of the bands corresponding to
different mRNAs was measured by NIH image-processing software. *Significantly
different from SD rats, p<0.05.
2
*
1
m
n
ce
re
be
llu
ai
br
id
m
tu
m
hy
po
th
al
am
us
hi
pp
oc
am
pu
s
ria
st
rt
ex
0
co
arbitrary units
*
185
Figures
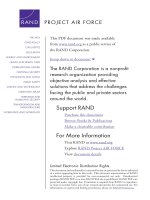
Figure 4-1. Representative images of cDNA microarray results comparing PVG
hooded and SD rats. This IncyteGenomics cDNA microarray was hybridized with
fluorescent-labeled target cDNA prepared from the cortex of two rat strains. (a) Well
C7 in plate 021M6966 contains the probe for rat fibroblast growth factor putative
isoform 2. The signal ratio between PVG and SD is 2.1. (b) Well A12 in plate
021S6980 contains probe of rat activity-regulated cytoskeleton-associated gene
(Arc) mRNA. The ratio of SD rats over PVG hooded is 2.
(a)
PVG
SD
PVG
SD
(b)