Reconnaissance of pharmaceuticals and other groundwater
Bạn đang xem bản rút gọn của tài liệu. Xem và tải ngay bản đầy đủ của tài liệu tại đây (537.28 KB, 9 trang )
A national reconnaissance of pharmaceuticals and other
organic wastewater contaminants in the
United States — I) Groundwater
Kimberlee K. Barnes
a,
⁎
, Dana W. Kolpin
a
, Edward T. Furlong
b
, Steven D. Zaugg
b
,
Michael T. Meyer
c
, Larry B. Barber
d
a
U.S. Geological Survey, 400 South Clinton Street, Room 269, Iowa City, Iowa 52244, United States
b
U.S. Geological Survey, National Water Quality Laboratory, P.O. Box 25046, MS 407, Denver Federal Center, Lakewood,
Colorado 80225, United States
c
U.S. Geological Survey, 4821 Quail Crest Place, Lawrence, Kansas 66049, United States
d
U.S. Geological Survey, 3215 Marine Street, Boulder, Colorado 80303, United States
ARTICLE INFO ABSTRACT
Article history:
Received 2 November 2007
Received in revised form
17 April 2008
Accepted 22 April 2008
As part of the continuing effort to collect baseline information on the environmental
occurrence of pharmaceuticals, and other organic wastewater contaminants (OWCs) in the
Nation's water resources, water samples were collected from a network of 47 groundwater
sites across 18 states in 2000. All samples collected were analyzed for 65 OWCs representing
a wide variety of uses and origins. Site selection focused on areas suspected to be susceptible
to contamination from either animal or human wastewaters (i.e. down gradient of a landfill,
unsewered residential development, or animal feedlot). Thus, sites sampled were not
necessarily used as a source of drinking water but provide a variety of geohydrologic
environments with potential sources of OWCs. OWCs were detected in 81% of the sites
sampled, with 35 of the 65 OWCs being found at least once. The most frequently detected
compounds include N,N-diethyl toluamide (35%, insect repellant), bisphenol A (30%,
plasticizer), tri(2-chloroethyl) phosphate (30%, fire retardant), sulfamethoxazole (23%,
veterinary and human antibiotic), and 4-octylphenol monoethoxylate (19%, detergent
metabolite). Although sampling procedures were intended to ensure that all groundwater
samples analyzed were indicative of aquifer conditions it is possible that detections of some
OWCs could have resulted from leaching of well-construction materials and/or other site-
specific conditions related to well construction and materials. Future research will be
needed to identify those factors that are most important in determining the occurrence and
concentrations of OWCs in groundwater.
Published by Elsevier B.V.
Keywords:
Groundwater
Pharmaceuticals
Contaminants
1. Introduction
Increasing standards of living and the continual growth of the
human population has led to a growing demand for fresh-
water. Thus, the protection of this natural resource is an
important environmental issue. In the United States in 1995,
groundwater withdrawals were estimated at more than 291
million liters per day (Solley et al., 1998). Groundwater not only
provides about 40% of the Nation's public water supply, but it
also is used by more than 40 million people, including most of
SCIENCE OF THE TOTAL ENVIRONMENT 402 (2008) 192– 200
⁎ Corresponding author. Tel.: +1 319 358 3618; fax: +1 319 358 3606.
E-mail address: (K.K. Barnes).
0048-9697/$ – see front matter. Published by Elsevier B.V.
doi:10.1016/j.scitotenv.2008.04.028
available at www.sciencedirect.com
www.elsevier.com/locate/scitotenv
the rural population who supply their own drinking water via
domestic wells. Groundwater is also the major source of water
used for irrigation (Alley et al., 1999) and is the Nation's
principal reserve of freshwater representing much of the
potential future water supply. Groundwater is a major contri-
butor to flow in many streams and rivers and thus, has a strong
influence on river and wetland habitats for plants and animals.
Tens of thousands of manmade chemicals are used in
today's soci ety with all havin g the potential to enter our
water resources. There are a variety of pathways by which
these organic contaminants can make their way into the
aquatic environment (Heber er, 200 2a, b). Such pathways
include direct discharge via wastewater treatment plants,
landfills, and land application of human and animal waste to
farmland. Pharmaceuticals and other organic wastewater
contaminants (OWCs) are a set of compounds that are re-
ceiving an increasing amount of public and scientific at-
tention. OWCs have been documented in water resources
around the world (Ternes, 1998; Stumpf et al., 1999; Heberer
et al., 2001; Kolpi n et al., 2002; Metcalf et al., 2003;
Hohenblum et al., 2004; Moldovan, 2006; Kim et al., 2007).
Althoug h some research on OWCs has been conducted in
groundwater (Ahel, 1991; Seiler et al., 1999; Sacher et al., 2001;
Heberer, 2002a,b; Barnes et al., 2004; Cordy et al., 2004; Scheytt
et al., 2004; Hari et al., 2005; Batt et al ., 2006; Rabiet et al., 2006),
the vast majority of such efforts have been in surface waters.
Currently our understanding of the chronic, long-term effects
to OWCs is li mited. Research is just beginning to untangle this
difficult question (Pascoe et al., 2003; Thorpe et al., 2003;
Brooks et al., 2005; Flaherty and Dodson, 2005; Johnson et al.,
2005; Mills and Chichester, 2005; Oetken et al., 2005; Pomati
et al., 2006; Correa-Reyes et al ., 2007; Kidd et al., 2007;
Nentwig, 2007).
This study represents the first national-scale examination
of OWC occurrence in groundwater and provides a baseline
from which to proceed with future groundwater investigations
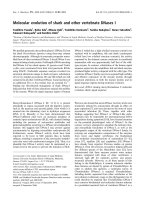
and monitoring strategies. This paper summarizes the analy-
tical results from a network of 47 groundwater sites sampled
in 2000 (Fig. 1).
2. Experimental design
2.1. Site selection and sampling
Because little information exists on the occurrence of OWCs
in groundwater, the 47 groundwater sites sampled in 2000
were selected in areas thought to be susceptible to contam-
ination from either animal or human wastewaters. While
this reconnaissance sampling network does represent a
variety of land use, climate and hydrogeology, it is not
necessarily re presenta tive of all groundwaters in the United
Sta tes. The sampling network consisted of 42 wells, 3 springs,
and 2 sumps across 18 states (Fig. 1). The wells sampled in
this stu dy were not the same wells sampled in Focazio et al.
(2008-this issue). Additional information on the groundwater
sites sampled will be available in a forthco ming publication
accessible at />samples were collected d uring 2000 and no attempt was
made to determine temporal patterns in OWC concentra-
tions (e.g. samples onl y collected once fro m this network).
The wells have varied uses with almost half of the wells used
for observation purposes. Less than one-third of the wells
were used for drinking water supp ly and the remainder of
wells sampled were p rimarily used for agri cultural purposes.
Well depths were generally shallow with such depths
ranging from 2.4 to 310.9 m with a median depth of 19.2 m.
Thetypeofwellcasingmaterialwasknownfor36ofthe42
wells with 18 wells having a steel casing and 18 wells having
a casing made from poly vinyl chloride (PVC). The sumps
sampled were part of a seepage monitoring system in
earthen basins used to store livestock waste (Ruhl, 1999).
All samples were collected by U.S. Geological Survey (USGS)
personnel using consistent protocols (Koterba et al., 1995; U.S.
Geological Survey, variously dated). A composite water sample
was collected at each site and split into the appropriate
containers for shipment to the various laboratories. For those
bottles requiring filtration, water was passed through a 0.7 μm,
baked (450 °C for 8 h), glass-fiber filter in the field where
Fig. 1– Location of groundwater sampling sites.
193SCIENCE OF THE TOTAL ENVIRONMENT 402 (2008) 192– 200
Table 1 – Summary of analytical results of groundwater sites sampled for 83 organic wastewater contaminants
Chemical (method) CASRN RL(μg/L) n Percent detected Maximum concentration
a
(μg/L)
Typical use
b
Drinking water standards
and health advisories (μg/L)
Veterinary and human antibiotics
carbodox (ANT LC/MS) 6804-07-5 0.1 37 0 ND Antibiotic –
chlortetracycline (ANT LC/MS) 57-62-5 0.05 47 0 ND Antibiotic –
ciprofloxacin (ANT LC/MS) 85721-33-1 0.02 47 0 ND Antibiotic –
doxycycline (ANT LC/MS) 564-25-0 0.1 47 0 ND Antibiotic –
enrofloxacin (ANT LC/MS) 93106-60-6 0.02 47 0 ND Antibiotic –
erythromycin–H
2
O (ANT LC/MS) 114-07-8 0.05 37 0 ND Erythromycin metabolite –
lincomycin (ANT LC/MS) 154-21-2 0.05 37 5.4 0.32 Antibiotic –
norfloxacin (ANT LC/MS) 70458-96-7 0.02 47 0 ND Antibiotic –
oxytetracycline (ANT LC/MS) 79-57-2 0.1 47 0 ND Antibiotic –
roxithromycin (ANT LC/MS) 80214-83-1 0.03 37 0 ND Antibiotic –
sarafloxacin (ANT LC/MS) 98105-99-8 0.02 47 0 ND Antibiotic –
sulfadimethoxine (ANT LC/MS) 122-11-2 0.05 37 0 ND Antibiotic –
sulfamerazine (ANT LC/MS) 127-79-7 0.05 37 0 ND Antibiotic –
sulfamethazine (ANT LC/MS) 57-68-1 0.05 37 2.7 0.36 Antibiotic –
sulfamethizole (ANT LC/MS) 144-82-1 0.05 37 0 ND Antibiotic –
sulfamethoxazole (PHARM HPLC) 723-46-6 0.023 47 23.4 1.11 Antibiotic –
sulfathiazole (ANT LC/MS) 72-14-0 0.1 37 0 ND Antibiotic –
tetracycline (ANT LC/MS) 60-54-8 0.05 47 0 ND Antibiotic –
trimethoprim (PHARM HPLC) 738-70-5 0.014 47 0 ND Antibiotic –
tylosin (ANT LC/MS) 1401-69-0 0.05 37 0 ND Antibiotic –
virginiamycin (ANT LC/MS) 21411-53-0 0.1 37 0 ND Antibiotic –
Prescription drugs
albuterol (salbutamol) (PHARM HPLC) 18559-94-9 0.029 47 0 ND Antiasthmatic –
cimetidine (PHARM HPLC) 51481-61-9 0.007 47 0 ND Antacid –
codeine (PHARM HPLC) 76-57-3 0.24 46 0 ND Analgesic –
dehydronifedipine (PHARM HPLC) 67035-22-7 0.01 47 4.3 0.022 Antianginal –
diltiazem (PHARM HPLC) 42399-41-7 0.012 47 2.1 0.028 Antihypertensive –
fluoxetine (PHARM HPLC) 54910-89-3 0.018 47 4.3 0.056 Antidepressant –
gemfibrozil (PHARM HPLC) 25812-30-0 0.015 47 0 ND Antihyperlipidemic –
ranitidine (PHARM HPLC) 66357-35-5 0.01 47 0 ND Antacid –
warfarin (PHARM HPLC) 81-81-2 0.001 47 0 ND Anticoagulant –
Nonprescription drugs
1,7-dimethylxanthine (PHARM HPLC) 611-59-6 0.018 47 4.3 0.057 Caffeine metabolite –
acetaminophen (PHARM HPLC) 103-90-2 0.009 47 6.4 0.38 Antipyretic –
caffeine (PHARM HPLC) 58-08-2 0.014 47 12.8 0.13 Stimulant –
cotinine (PHARM HPLC) 486-56-6 0.023 47 2.1 bRL Nicotine metabolite –
ibuprofen (PHARM HPLC) 15687-27-1 0.018 47 2.1 3.11 Antiinflammatory –
Other wastewater-related compounds
1,4-dichlorobenzene (CLLE SIM GC/MS) 106-46-7 0.5 47 6.4 1.17 Fragrance
1
75;
2
75;
3
0.1;
4
4000
3-tert-butyl-4-hydroxy anisole
(CLLE SIM GC/MS)
25013-16-5 5 47 0 ND Antioxidant –
194 SCIENCE OF THE TOTAL ENVIRONMENT 402 (2008) 192– 200
4-nonylphenol diethoxylate
(CLLE SIM GC/MS)
a
26027-38-3 5 47 2.1 UC Nonionic detergent metabolite, surfactant –
4-octylphenol monoethoxylate
(CLLE SIM GC/MS)
a
– 1 47 19.1 UC Nonionic detergent metabolite, surfactant –
4-octylphenol diethoxylate
(CLLE SIM GC/MS)
a
26636-32-8 1 47 4.3 bRL Nonionic detergent metabolite, surfactant –
5-methyl-1H-benzotriazole
(CLLE SIM GC/MS)
136-85-6 2 46 8.7 2.08 Manufacturing additive, anticorrosive –
acetophenone (CLLE SIM GC/MS) 98-86-2 2 47 4.3 2.67 Solvent –
anthracene (CLLE SIM GC/MS) 120-12-7 0.5 47 2.1 bRL PAH, combustion product, used in dyes
3
0.3;
4
10,000
benzo[a]pyrene (CLLE SIM GC/MS) 50-32-8 0.5 47 0 ND PAH, combustion product
1
0.2
bisphenol A (CLLE SIM GC/MS) 80-05-7 1 47 29.8 2.55 Manufacturing additive, used in plastics –
carbaryl (CLLE SIM GC/MS) 63-25-2 1 47 2.1 bRL Insecticide
2
700;
3
0.1;
4
4000
chlorpyrifos (CLLE SIM GC/MS) 2921-88-2 0.5 47 0 ND Insecticide
2
20;
3
0.003;
4
100
diazinon (CLLE SIM GC/MS) 333-41-5 0.5 47 0 ND Insecticide 0.6
2
ethanol,2-butoxy-phosphate
(CLLE SIM GC/MS)
78-51-3 0.5 47 14.9 1.34 Manufacturing additive, plasticizer –
fluoranthene (CLLE SIM GC/MS) 206-44-0 0.5 47 4.3 bRL PAH, combustion product –
N,N-diethyltoluamide
(CLLE SIM GC/MS)
134-62-3 0.6 46 34.8 13.5 Insect repellant –
naphthalene (CLLE SIM GC/MS) 91-20-3 0.5 47 8.5 1.51 PAH, combustion product, moth repellant
2
100;
3
0.02;
4
700
para-cresol (CLLE SIM GC/MS) 106-44-5 1 47 12.8 bRL Solvent –
para-nonylphenol (CLLE SIM GC/MS) 84852-15-3 5 47 0 ND Nonionic detergent metabolite
phenanthrene (CLLE SIM GC/MS) 85-01-8 0.5 47 2.1 bRL PAH, combustion product –
phenol (CLLE SIM GC/MS) 108-95-2 2 47 0 ND Disinfectant 400
pyrene (CLLE SIM GC/MS) 129-00-0 0.5 47 2.1 bRL PAH, combustion product –
tetrachloroethylene
(CLLE SIM GC/MS)
127-18-4 0.5 47 8.5 bRL Solvent, degreaser
1
5;
2
10;
3
0.01;
4
500
tri(2-chloroethyl) phosphate
(CLLE SIM GC/MS)
115-96-8 0.5 47 29.8 0.737 Manufacturing additive, fire retardant –
tri(dichlorisopropyl) phosphate
(CLLE SIM GC/MS)
13674-87-8 0.5 47 2.1 bRL Manufacturing additive, fire retardant –
triphenyl phosphate (CLLE SIM GC/MS) 115-86-6 0.5 47 4.3 bRL Manufacturing additive, plasticizer –
triclosan (CLLE SIM GC/MS) 3380-34-5 1 47 14.9 bRL Antimicrobial disinfectant –
Sterols
cholesterol (CLLE SIM GC/MS) 57-88-5 0.01 41 2.1 1.73 Plant/animal steroid –
coprostanol (CLLE SIM GC/MS) 360-68-9 0.01 41 4.3 1.29 Fecal steroid –
stigmastanol (CLLE SIM GC/MS) 19466-47-8 2 47 2.1 UC Plant steroid –
[RL, reporting level; n, number of analyses; ND, not detected; UC, unquantified concentration estimated to exceed the reporting level; ANT LC/MS, solid-phase extraction with liquid chromatography and
mass spectroscopy; PHARM HPLC, solid-phase extraction with high-performance liquid chromatography; CLLE SIM GC/MS, continuous liquid–liquid extraction with gas chromatography and mass
spectroscopy using selected selected-ion monitoring].
Drinking Water Standards and Health Advisories:
1
U.S. EPA MCL (μg/L).
2
U.S. EPA Lifetime Health Advisory (μg/L).
3
U.S. EPA RfD (mg/kg/day).
4
U.S. EPA Drinking Water Equivalent Level (DWEL) (μg/L).
a
Maximum concentrations that are listed bRL represent non-quantitative detections. Maximum concentrations listed as UC are unquantified concentrations but estimated to exceed the reporting level.
b
A more complete description of compound-use categories can be found in the forthcoming data report ( />195SCIENCE OF THE TOTAL ENVIRONMENT 402 (2008) 192– 200
possible, or else filtration was conducted in the laboratory.
Water samples for each chemical analysis were stored in
precleaned-amber, glass bottles. Following collection, samples
were immediately chilled and shipped via overnight express
to the appropriate laboratory. To minimize contamination,
use of personal care items (perfumes, colognes, insect repel-
lents), caffeinated products, and tobacco were discouraged
during sample collection and processing (U.S. Geological
Survey, variously dated).
2. Analytical methods
Target compounds within each analytical method were se-
lected from the large number of chemical possibilities based
upon known or suspected usage, toxicity, potential hormonal
activity, persistence in the environment, as well as results
from previous studies (Kolpin et al., 2002). The analytical
results for each groundwater sample will be available in a
forthcoming publication available at />regional/emc/. Three separate analytical methods were used
to determine the environmental extent of 65 different OWCs
in groundwater samples (Table 1). Descriptions of the analy-
tical methods and method performance characteristics are
provided elsewhere (Brown et al., 1999; Cahill et al., 2004;
Meyer et al., 2007). Nineteen antibiotic compounds were
extracted and analyzed by tandem solid-phase extraction
(SPE) and single quadrapole, liquid chromatography/mass
spectrometry with electro-spray ionization set in positive
mode and selected-ion monitoring (SIM) (Meyer et al., 2007;
hereafter referred to as ANT LC/MS). Sixteen human prescrip-
tion and non-prescription drugs and their select metabolites
were extracted by SPE and analyzed by high high-performance
liquid chromatography (HP/LC) using a polar reverse-phase
octylsilane (C8) HPLC column (Cahill et al., 2004; hereafter
referred to as PHARM LC/MS). Thirty OWC-related compounds
wer e extracted using continuous liquid–liqu id extraction
(CLLE) and analyzed by capillary-column gas chromatogra-
phy/mass spectrometry with SIM (Brown et al., 1999; hereafter
referred to as CLLE SIM GC/MS). A GC/MS/MS derivitization
method for a broad suite of biogenic and synthetic hormones
was being developed at this time but was unavailable for this
study. Compounds measured by more than one analytical
method were compared and evaluated to determine the most
reliable method on a compound-by-compound specific basis.
This evaluati on yielded “primacy” methods for caffeine,
codeine, cotinine, sulfamethoxazole, and trimethoprim.
2.3. Reporting levels and identification criteria
The analytical methods used in this study share a common
rationale for compound identification and quantitation , de-
spite differences in specific analytical details. All rely on the
application of mass spectrometric techniques, which provide
compound-specific fragments, and when coupled with chro-
matographic retention characteristics produce unambiguous
identification of each compou nd. In addit ion, the specific
criteri a for the identification of each compound are based on
analysis of authentic standards for all compounds (unless
otherwise noted). More details on the development of
reporting levels are provided elsewhere (Focazio et al., 2008-
this issue). For the PHARM LC/MS and CLLE SIM GC/MS
methods, analytes detected below the MDL that met the full
retention time and mass spectral criteria required for
confirmation were reported as detects for frequency of
detection calculations and were assigned unquantified con-
centration indicators of “bRL. ” For graphical purposes max-
imum concentrations were estimated below the reporting
levels in a limited number of instances. All data were blank
censored to ensure that the reported compounds were in the
sample at the time of colle ction and not art ifacts of sample
processing and analysis. The concentration of compounds
with b 60% recovery, routinely detected in laboratory blanks,
or prepare d with technical grade mixtures, was also con-
sidered estimated (Table 1). For the ANT LC/MS method, the
RL was established for each analyte wi th signal-to-noise
ratios of 5 to 10 times above backgrou nd using a series of 0.02,
0.05, and 0.10 μg/L reagent water spikes (Meyer et al., 2007).
Only concentrations e qual to or above the RL were repo rted
for t he ANT LC/MS method.
2.4. Quality assurance and quality control
The USGS collects and analyzes field and laboratory quality
assurance and quality control data for all methods on a con-
tinuous basis as p art of ongoing research throughout the
agency that transcends the groundwater reconnaissance dis-
cussed here. Therefore, larger datasets of field and laboratory
blanks than were available to this effort were also considered
when making decisions on how to report data. As a result of
that larger consideration, some compounds (i.e. phenol and
acetophenone) which exhibited chronic an d systema tic
detections in fi eld and laboratory blanks are not reported in
this paper below their respective reporting levels (as foot-
noted in Table 1). In addition, a limi ted number of other
compounds (i.e. bis phenol A, N,N-diethyltoluamide, nony-
phenol, and 4-nony lphenol diethoxylate, CLLE SIM GC/MS)
were detected in field and laboratory blanks randomly and
infrequently.
Additional information on method performance is provided
by laboratory quality assurance and quality control. At least
one fortified laboratory spike and one laboratory blank was
analyzed with each set of 10–16 environmental samples. Most
methods had surrogate compounds added to samples prior to
extraction to monitor method performance. The laboratory
blanks were used to assess potential sample contamination.
Blank contamination was not subtracted from environmental
results. However, environmental concentrations within 10
times the value observed in the set blank were reported as less
than the reporting level.
In addition to the laboratory and field blank data collected
by USGS personnel during various projects and time periods, a
field quality assurance protocol was used for the groundwater
reconnaissance study to assist in determining the effect, if
any, of field equipment and procedures on the concentrations
of OWCs in water samples. Field blanks, made from labora-
tory-grade organic free water, were submitted for 6% of the
sites and analyzed for all of the OWCs. Field blanks were
subject to the same sample processing, handling, and equip-
ment as the groundwater samples. Of the three field blanks
submitted, two did not have any measurable detection of any
196 SCIENCE OF THE TOTAL ENVIRONMENT 402 (2008) 192– 200
target OWCs. The third field blank had a detection of phenol,
1,4-dichlo ro ben zen e, aceto phe no ne, napht hal ene, and 4-
octyl phenol monoethox ylate. Contamina tion of this field
blank is possibly due to the fact that the water sample was
collected within 3 m of a running, gas-powered generator, or
improper cleaning of the equipment prior to sampling. The
corresponding regular sample showed only a small detection
of para-nonylphenol. One duplicate sample was also collected
and analyzed. The results from this sample were identical to
those from the regular sample and showed no variations in
OWC detections.
2.5. Interlaboratory and method comparisons
Five compounds (caffeine, codeine, cotinine, sulfamethoxa-
zole, and trimethoprim) were measured by more than one
analytical method and were used to compare and evaluate the
most reliable method on a compound compound-by by-
compound specific basis. This evaluation yielded “primacy”
methods for each compound. For example, cotinine and
caffeine were measured by the PHARM LC/MS and the CLLE
SIM GC/MS method; however, the detection capabilities were
more sensitive for the PHARM LC/MS method and therefore it
was used to report environmental data. In 426 overlapping
results, the presence or absence was confirmed in 97.2% of the
determinations. More specifically, the overlapping results
confirmed the results for 100% of the determinations for
caffeine and codeine; 97.3% for sulfamethoxazole and tri-
methoprim, and 91.3% for cotinine.
2.6. Statistical tests
Nonparametric statistical techniques were used for this study.
These methods are appropriate because the data did not
exhibit normal distributions and because of the large number
of censored data (concentrations less than the RL). Nonpara-
metric statistical techniques have the advantage of not being
overly affected by outliers and censored data because the
ranks of the data are used in the statistics rather than the
actual concentrations. A Spearman's rank correlation was
used to measure the monotonic relation between two
continuous variables (Helsel, 2005). A significance level of 0.5
was used for all statistical tests in this study.
3. Results and discussion
At least one OWC was found in 81% of the groundwater sites
sampled. The frequent occurrence of OWCs in groundwater is
likely due to the design of this study focusing on areas
suspected to be susceptible to animal or human wastewater
contamination (e.g. sites down gradient of animal feedlots,
landfills or unsewered residential developments). As noted
previously, not all the groundwater sites sampled were used
for drinking water purposes. More than half of the OWCs (35
out of 65) were detected at least once during this study
(Table 1). The OWCs detected represent a variety of uses and
origins including industrial, residential, and agricultural
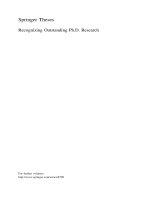
sources. The five most frequently detected compounds
include N,N-d iethyltoluamide (insect repellant, 35%),
Fig. 2 – Frequency of detection of all compounds analyzed in
groundwater samples.
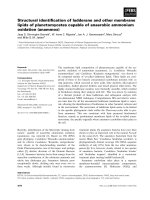
Fig. 3 – Maximum concentrations of all compounds detected at greater than 0.5 μg/L.
197SCIENCE OF THE TOTAL ENVIRONMENT 402 (2008) 192– 200
bisphenol A (plasticizer, 30%), tri(2-chloroethyl) phosphate
(fire retardant, 30%), sulfamethoxazole (veterinary and human
antibiotic, 23%), and 4-octylphenol monoethoxylate (detergent
metabolite, 19%). Although N,N-diethyltoluamide was the
most frequently detected compound for this study, 14 of the
16 detections were estimated concentrations below the RL.
Bisphenol A and tri(2-chloroethyl) phosphate were among the
most frequently detected compounds in this study and ground
water sites from Focazio et al. Eighteen human and veterinary
antibiotics, five prescription drugs, and five industrial and
wastewater products were not detected in any of 47 samples
collected. Nine sites had no OWCs detected in the water
samples collected. Of these nine sites, one was a spring
located in a mixed agricultural and residential area and the
remaining sites were wells located in various land use areas
with well depths ranging from almost 8 m to 223 m. It is
important to note th at many of the target OWCs likely
transform or degrade as they are transported into and through
the environment as a result of metabolic and other natural
attenuation processes (Boxall et al., 2004) and many of the
possible transformation compounds were not assessed in this
reconnaissance due to lack of analytical methods at this time.
Therefore it is possible that the parent compounds, though
not detected, could have degraded into other compounds that
were not analyzed. Thus, the absence of detectable concen-
trations of OWCs may be due to absence of the source,
complete attenuation of the compound or attenuation to
levels below analytical detection capabilities.
Measured concentrations were generally low, with 87% of
137 measured detections being b 1 μg/L. None of the com-
pounds exceeded drinking water guidelines, health advisories,
or aquatic-life criteria. Only 9 of 65 compounds analyzed,
however, have established criteria or guidelines (Table 1).
Mixtures were common with more than one compound being
detected at 25 of 47 sites and 10 or more compounds detected
at three sites. The maximum number of compounds at any
particular site was 14 with a median of two (Fig. 2). Little is
known about the potential toxicological effe cts of these
compounds either alone or as part of a mixture.
The OWCs with the highest concentrations measured
(greater than or equal to 0.5 μg/L) are not necessarily among
the most frequently detected compounds (Fig. 3). For example,
although several compounds such as ibuprofen and aceto-
phenone were detected infrequently, they had maximum
concentrations which exceeded 0.5 μg/L (Table 1; Fig. 3).
Previous research (Kolpin et al., 2002) has also shown that
compounds found with the highest frequency are not always
those found in the highest concentration. The maximum
concentrations of 11 OWCs exceeded 1 μg/L (Table 1). As
previously mentioned, drinking water standards do not exist
for most compounds analyzed, and therefore, it is difficult to
put these results in a human-health context at this time.
3.1. Organic wastewater compound groups
The 65 compounds can be divided into 14 contaminant groups
based on type of compound or generaluse category (Fig. 4A and
4B). It should be noted that the uses can vary widely for any
given compound. Consequently, the tabulated use categories
are presented for illustrative purposes and may not be all
inclusive. The plasticizer group, consisting of 3 compounds,
had the greatest frequency of detection. Although these
groupings are composed of unequal numbers of compounds,
it is clear that the detection frequency of any given compound
group is not controlled by the number of compounds in the
group (i.e. more compounds in a group do not necessarily
increase the detection frequency of the group as a whole). Five
groups had a detection frequency exceeding 20% and five
groups had a detection frequency of less than 10% (Fig. 4 A).
Three groups (plasticizers, insect repellant, and detergent
metabolites) contributed about 66% of the total measured
concentration (Fig. 4B). As shown in previous research (Kolpin
Fig. 4– Frequency of detection of organic wastewater
contaminants by general use category (A), and percent of
total measured concentration of organic wastewater
contaminants by general use category (B). Number of
compounds in each category shown above bar.
Fig. 5– Total number of compounds detected by well depth
group (b10 meters, 22 sites; 11–50 meters, 13 sites; N50 m, 11
sites).
198 SCIENCE OF THE TOTAL ENVIRONMENT 402 (2008) 192– 200
et al., 2002), compounds found with the highest frequency are
not always those found in the highest concentration.
3.2. Relations to well depth
To obtain a better understanding of OWC occurrence in
groundwater, a Spearman rank correlation test was calculated
to determine potential significant relations between well
depth and the number of OWCs detected at each site. For
this exercise, the 3 springs and 2 sumps were all given a well
depth value=0. Depth information was not available for one
well sampled. Well depths have been shown previously to
provide a general indication of the age of groundwater when
direct measures of groundwater age are not available (Plum-
mer and Friedman, 1999; Christenson et al., 2006). The total
number of compounds detected significantly decreased
(p= 0.007, rho =− 0.391; Spearman rank correlation test) as
well depths increased. To visually display the inverse relation
between number of OWCs detected and well depth, sampling
sites were divided into 3 groups based on well depth (b 10 m, 22
sites; 11–50 m, 13 sites; and N 50 m, 11 sites) with the number of
wells in each group selected to be as equal as possible given
the variance in well depth (Fig. 5). Other studies have indicated
that the sources of organic contaminants are commonly near
the wellhead, indicating that the shallow seals and gravel
packs may provide pathways for contaminants to enter the
wells (Christenson, 1998). A similar inverse relation between
pesticide detections and well depth has been reported
previously in groundwater (Kolpin et al., 1995).
3.3. Comparison to national stream reconnaissance
Data collected for the groundwater reconnaissance can be
qualitatively compared to data collected for the national
reconnaissance of OWCs in U.S. streams (Kolpin et al., 2002).
This comparison is valid because the three analytical methods
used for this study of groundwater were also used for the
previous study of streams. Although fewer groundwater sites
were sampled (47 groundwater sites compared to 139 surface
water sites), the design for both studies were similar in that
selected sites were known or suspected to be susceptible to
contamination from human, industrial, or agricultural waste-
water. Overall, fewer numbers of OWCs were detected at
groundwater sites, only 35 of 65 as compared to 82 of 95 for
surface water sites, with every compound detected at these
groundwater sites also being detected in the streams sampled.
Although similar compounds were detected in the ground-
water reconnaissance, the frequency of detection of OWCs was
lower for the groundwater sites compared to the stream sites.
The greatest frequency of detection of any compound at
groundwater sites was 35% compared to 86% at stream sites.
In addition, 12 other compounds had detection frequencies
greater than 35% at surface water sites. Measured concentra-
tions of OWCs were generally low for both the groundwater
and surface water reconnaissance; however, total concentra-
tions of the OWCs at groundwater sites rarely exceeded 1 μg/L.
Only 10 of 38 groundwater sites with detectable concentrations
of OWCs had total concentration greater than 1 μg/L, with half
of those having a total OWC concentration between 1 and 2 μg/
L. The surface water reconnaissance had 111 sites with
detectable concentration of OWCs, and of those 111 sites,
60% (67 sites) had a total OWC concentration N 1 μg/L, with 23
sites having a total OWC concentration N 10 μg/L. Although
mixtures were common for both studies (53% in groundwater
compared to 75% in streams), the median number of com-
pounds detected was more than 3 times greater in streams
compared to groundwater (7 versus 2 compounds). Similar
findings between groundwatersitesandsurface water sites are
described in the national reconnaissance of untreated drinking
water sources (Focazio et al., 2008-this issue).
This is the first nationwide groundwater reconnaissance
study to provide baseline information on the occurrence of
OWCs in groundwaters across a variety of land uses, climate,
and hydrogeology in the United States. These data will help to
provide a better understanding of the environmental occur-
rence of OWCs across a range of hydrogeological settings. The
results of this study will assist in determining the direction
and priority of future studies on occurrence, fate and
transport, and health-effects research.
Acknowledgments
The authors wish to acknowledge the many USGS scientists
and field technicians providing assistance in site selection,
collection and processing of groundwater samples. This
project was supported by the U.S. Geological survey, Toxic
Substances Hydrology Program. The use of trade, firm, or
brand names in this paper is for identification purposes only
and does not constitute endorsement by the U.S. Government.
REFERENCES
Ahel M. Infiltration of organic pollutants into ground water: field
studies in the alluvial aquifer of the Sava River. Bull Environ
Contam Toxicol 1991;47:586–93.
Alley WM, Reilly TE, Franke OL. Sustainability of ground-water
resources. U.S. Geological Survey Circular 1186; 1999. 79 pp.
Barnes KK, C hristenson SC, K olpin DW, Focazio MJ, Furlong ET, Zaugg
SD, et al. Pharmaceuticals and other organic waste water
contaminants within a l each ate plume downgradient of a
municipal landfill. Gr ound Water Monit Remediat 2004;24:119–26.
Batt AL, Snow DD, Aga DS. Occurrence of sulfonamide antim icrobials
in private water wells in Washington County, Idaho, USA.
Chemosphere 2 006;64:1963–71.
Boxall ABA, Sinclair CJ, Fenner K, Kolpin DW, Maund SJ. When
synthetic chemicals degrade in the environment—what are
the absolute fate, effects, and potential risks to humans and
the ecosystem? Environ Sci Technol 2004;38:368A–75A.
Brooks BW, Chambliss CK, Stanley JK, Ramirez A, Banks KE,
Johnson RD, et al. Determination of select antidepressants in
fish from an effluent-dominated stream. Environ Toxicol
Chem 2005;24:464–9.
Brown GK, Zaugg SD, Barber LB. Wastewater analysis by gas
chromatography/mass spectrometry. In: Morganwalp DW, Bux-
ton HT, editors. Proceedings of the U.S. Geological Survey Toxic
Substances Hydrology Program Technical Meeting, Contamina-
tion of Hydrologic Systems and Related Ecosystems, March 8–12,
Charleston, South Carolina, vol. 2. . U.S. Geological Survey Water
Resources Investigations Report 99-4018B; 1999. p . 431–5.
Cahill JD, Furlong ET, Burkhardt MR, Kolpin DW, Anderson LG.
Determination of pharmaceutical compounds in surface- and
199SCIENCE OF THE TOTAL ENVIRONMENT 402 (2008) 192– 200
ground-water samples by solid-phase extraction and
high-performance liquid chromatography–electrospray ionization
mass spectrometry. J Ch romatogr A 2004;1041:171–80.
Christenson S. Ground-water quality assessment of the Central
Oklahoma aquifer: summary of investigations. In: Christenson
JS, Scott, Havens, editors. Ground-water quality assessment of
the Central Oklahoma aquifer, Oklahoma: Results of
investigations: U.S. Geological Survey Water Supply Paper
2357-A; 1998. 179 pp.
Christenson S, Parkhurst D, Hunt AG, Athay D. Age-dating ground
water beneath Tinker Air Force Base, Midwest City, Oklahoma,
2003–04. U.S. Geological Survey Fact Sheet 2005–3099; 2006. 4 pp.
Cordy GE, Duran NL, Bouwer H, Rice RC, Furlong ET, Zaugg SD, et
al. Do pharmaceuticals, pathogens, and other organic waste
water compounds persist when water is used for recharge?
Ground Water Monit Remediat 2004;24:58–69.
Correa-Reyes G, Viana MT, Marquez-Rocha FJ, Licea AF, Ponce E,
Vazquez-Duhalt R. Nonylphenol algal bioaccumulation and its
effect through the trophic chain. Chemosphere 2007;68:662–70.
Flaherty CM, Dodson SI. Effects of pharmaceuticals on Daphnia
survival, growth, and reproduction. Chemosphere
2005;61:200–2007.
Focazio MJ, Kolpin DW, Barnes KK, Furlong ET, Meyer MT, Zaugg SD,
et al. A national reconnaissance for pharmaceuticals and other
organic wastewater contaminants the United States — II)
untreated drinking water sources. Sci Total Environ
2008;402:201–16 (this issue), doi:10.1016/j.scitotenv.2008.02.021.
Hari AC, Paruchuri RA, Sabatini DA, Kibbey TCG. Effects of pH and
cationic and nonionic surfactants on the adsorption of
pharmaceuticals to a natural aquifer material. Environ Sci
Technol 2005;39:2592–8.
Heberer T, Furhmann B, Schmidt-Baumler K, Tsipi D, Koutsouba V,
Hiskia A. Occurrence of pharmaceutical residues in sewage,
river, ground, and drinking water in Greece and Berlin
(Germany). In: Daughton CG, Jones-Lepp TL, editors. American
Chemical Society Symposium Series 791. Pharmaceuticals and
personal care products in the environment. Scientific and
regulatory issues; 2001. 396 pp.
Heberer T. Tracking persistent pharmaceutical residues from
municipal sewage to drinking water. J Hydrol 2002a;266:175–89.
Heberer T. Occurrence, fate, and removal of pharmaceutical
residues in the aquatic environment: a review of the recent
research data. Toxicol Lett 2002b;131:5–17.
Helsel DR. Nondetects and data analysis — statistics for censored
environmental data. Hoboken, NJ: John Wiley & Sons, Inc; 2005.
Hohenblum P, Gans O, Moche W, Scharf S, Lorbeer G. Monitoring of
selected estrogenic hormones and industrial chemicals in
groundwaters and surface waters in Austria. Sci Total Environ
2004;333:185–93.
Johnson DJ, Sanderson H, Brain RA, Wilson CJ, Bestari KT, Solomon
KR. Exposure assessment and microcosm fate of selected
selective serotonin reuptake inhibitors. Regul Toxicol Phar-
macol 2005;42:313–23.
Kidd KA, Blanchfield PJ, Mill KH, Palace VP, Evans RE, Lazorchak
JM, et al. Collapse of a fish population after exposure to a
synthetic estrogen. PNAS 2007;104:8897–901.
Kim SD, Cho J, Kim IS, Vanderford BJ, Snyder SA. Occurrence and
removal of pharmaceutical and endocrine disruptors in South
Korean surface, drinking, and waste waters. Water Res.
2007;41:1013–21.
Kolpin DW, Furlong ET, Meyer MT, Thurman EM, Zaugg SD, Barber
LB, et al. Pharmaceuticals, hormones, and other organic
wastewater contaminants in U.S. Streams, 1999–2000: a
national reconnaissance. Environ Sci Technol 2002;36:1202–11.
Kolpin DW, Goolsby DA, Thurman EM. Pesticides in near-surface
aquifers: an assessment using highly sensitive analytical
methods and tritium. J Environ Qual 1995;24:1125–32.
Koterba MT, Wilde FD, Lapham WW. Ground-water data collection
protocols and procedures for the National Water-Quality
Assessment Program: collection and documentation of water-
quality samples and relate d data. U.S. Geological Survey. Open
-File Report 95–339; 1995. 113 pp.
Metcalf CD, Miao XS, Koenig BG, Struger J. Distribution of acidic
and neutral drugs in surface waters near sewage treatment
plants in the lower Great Lakes, Canada. Environ Toxicol Chem
2003;22:2281–889.
Meyer MT, Lee EA, Ferrell GF, Bumgarner JE, Varns J. Evaluation of
offline tandem and online solid-phase extraction with liquid
chromatography/mass spectometry for the
analysis of antibiotics in ambient water and comparison to
an independent method. U.S. Geological Survey Scientific
Investigations Report 2007–5021; 2007. 28 pp.
Mills LJ, Chichester C. Review of evidence: are endocrine-disrupting
chemicals in the aquatic environment impacting fish
populations? Sci Tot Environ 2005;343:1–34.
Moldovan Z. Occurrences of pharmaceutical and personal care
products as micropollutants in rivers from Romania.
Chemosphere 2006;64:1808–17.
Nentwig G. Effects of pharmaceuticals on aquatic invertebrates.
Part II: the antidepressant drug fluoxetine. Arch Environ
Contam Toxicol 2007;52:163–7.
Oetken M, Nentwig G, Loffler D, Ternes T, Oehlmann J. Effects of
pharmaceuticals on aquatic invertebrates. Part I. The
antiepileptic drug carbamazepine. Arch Environ Contam
Toxicol 2005;49:353–61.
Pascoe D, Karntanut W, Muller CT. Do pharmaceuticals affect
freshwater invertebrates? A study with the cnidarian Hydra
vularis. Chemosphere 2003;51:521–8.
Plummer LN, Friedman LC. Tracing and dating young ground
water. U.S. Geological Survey Fact Sheet 134–99; 1999. 4 pp.
Pomati F, Castiglioni S, Zuccato E,Fanelli R, Vigetti D,Rossetti C,et al.
Effects of a complex mixture of therapeutic drugs at environ-
mental levels on human embryonic cells. Environ Sci Technol
2006;40:2442–7.
Rabiet M, Togola A, Brissaud F, Seidel JL, Budzinski H, Elbaz-
Poulichet F. Consequences of treated water recycling as
regards pharmaceuticals and drugs in surface and ground
waters of a medium-sized Mediterranean catchement. Environ
Sci Technol 2006;40:5282–8.
Ruhl JF. Quantity and quality of seepage from two earthen basins
used to store livestock waste in southern Minnesota during the
first year of operation, 1997–98. U.S. Geological Survey Water
Resources Investigations Report 99–4206; 1999. 35 pp.
Seiler RL, Zaugg SD, Thomas JM, Howcroft DL. Caffeine and
pharmaceuticals as indicators of waste water contamination in
wells. Ground Water 1999;37:405–10.
Sacher F, Lange FT, Brauch HJ, Blankehorn I. Pharmaceuticals in
groundwaters — analytical methods and results of a monitoring
program in Baden Wurttemberg, Germany. J Chromatogr A
2001;938:199–210.
Scheytt T, Mersmann P, Leidig M, Pekdeger A, Heberer T. Transport
of pharmaceutically active compounds in saturated laboratory
columns. Ground Water 2004;42:767–73.
Solley WB, Pierce RR, Perlman HA. Estimated use of water in the
United States in 1995. U.S. Geological Survey Circular 1200;
1998. 71 pp.
Stumpf M, Ternes TA, Wilken RD, Rodrigues SV, Baumann W. Polar
drug residues in sewage and natural waters in the state of Rio
de Janeiro, Brazil. Sci Total Environ 1999;225:135–41.
Ternes TA. Occurrence of drugs in German sewage treatment
plants and rivers. Water Res 1998;32:3245–60.
Thorpe KL, Cummings RI, Hutchinson TH, Scholze M, Brighty G,
Sumpter JP, et al. Relative potencies and combination effects of
steroidal estrogens in fish. Environ Sci Technol 2003;37:1142–9.
U.S. Geological Survey variously dated. National field manual for
the collection of water-quality data: U.S. Geological Survey
Techniques of Water-Resources Investigations, book 9, Chaps.
A1–A9, available online at />200 SCIENCE OF THE TOTAL ENVIRONMENT 402 (2008) 192– 200