Energy yield and visual impact studies of the berlin wind project
Bạn đang xem bản rút gọn của tài liệu. Xem và tải ngay bản đầy đủ của tài liệu tại đây (8.47 MB, 209 trang )
Samuel
M.
Arons
A
thesis submitted in partial fulfillment
of the requirements for the
Degree of Bachelor of Arts with Honors
in Physics
WILLIAMS COLLEGE
Williamstown, Massachusetts
12
May
2004 I would like to acknowledge the many people without whose guidance, patience, and
company I would not have been able to successfully complete this work. First, I would
like to thank my 'official' advisor Prof. Sarah Bolton (Physics) and my 'second'-but
equally important-advisor Prof. David Dethier (Geosciences) for their incredible sup-
port and advice throughout these past eleven months. I am also indebted to Prof.
Dwight Whitaker, my 'third' advisor, who helped me greatly in understanding and
thinking about fluid mechanics and air flow; to Prof. Jeff Strait for taking the time to
read and comment on a draft; and to the other members of the physics department for
their support over the course of the year. I would like to thank Prof. Karen Kwitter
and Dr. Steven Souza of the Astronomy department for their help in the initial stages
of the visual impact study, as well as Prof. Enrique Peacock-Lopez (Chemistry), the
resident
Mathematica expert, for spending an afternoon with me puzzling over some
incomprehensible error messages.
I
would not have had the opportunity to work on this project without all those who
came before me.
I
owe gratitude to Reed Zars '77 for having the crazy idea of a Williams
College wind farm in the first place, to Thomas Black
'81
for his perseverance in making
WWERP a reality, and to Nicholas Hiza '02, Fred Hines '02, and Chris Warshaw '02 for
rediscovering the project, dusting it off, and handing part of it to me for safekeeping for
a few months.
I
also thank the Center for Environmental Studies and the Thomas Black
fund for supporting my work during the summer of 2003. I am indebted to Dr. Paul
Bieringer of
MIT's Lincoln Laboratory for providing me with wind data and coaching
me along in the initial stages of analysis.
I could not have accomplished the mundane-but crucial-details of day-to-day work
without the help of the following people: Larry Mattison, George Walther, Emile
Ouelette, Bryce Babcock, Sharron Macklin, Heather Main, Joe Moran, other
behind-the-
scenes members of B&G, Jody Psoter, Carol Marks, Barb Swanson, Sandy Brown, Sarah
Gardner, Hank Art, Sandy Zepka, Walt Congdon, Martha Staskus, Andrew Gillette,
Hayley Horowitz '04, Zach Yeskel '04, Emily Gustafson '04, and any others that I may
have inadvertently left out.
Finally, I would like to thank
Ellie Frazier '05 for putting up with and comforting a
sometimes overworked and cranky person. I owe deepest thanks to my parents, without
whom none of this would have been possible.
The Berlin Wind Project is a Williams College-sponsored study of the potential for
electricity generation by a 7-9-turbine wind farm at Berlin Pass (Berlin, NY). Two
questions that must be addressed in assessing the project's viability are:
(1)
How much
energy could the proposed wind farm produce in a year? and
(2)
What would be the
turbines' visual impact? In this thesis, I present both the answers to these questions
and the techniques necessary to obtain them.
I
first conclude that AWS Truewind's wind resource maps predict energy yield with
an accuracy of approximately 16
f
14% in the northern Berkshire/Taconic region, and
that the maps also predict directional distributions quite reasonably.
I
next conclude
that a ?-turbine wind farm at Berlin Pass could produce 35
f
8 million kW-hr per year,
or 163
+
21% of Williams College's 2002-2003 energy use on average. Because of natural
fluctuations in wind speed, this value could vary by as much as an additional
f
10% from
year to year. Furthermore, since the prevailing winds at the Pass blow from the WNW
and the ridgeline runs NNE-SSW, turbine shading should not cause substantial energy
losses-though there would likely be some losses from a moderate SSW wind component.
Assuming a net turbine cost (sale price
+
installation) of $1.24 million ($8.65 million
for 7 turbines) and an average wholesale electricity price of $38/MW-hr, the farm could
pay for itself in, very roughly, 6.5
f
1.6 years.
In addition, based on the results of the visual impact study-some 59 potential views
of the wind farm from various locations within a 20
km
radius of the Pass-I conclude
that the turbines are likely to be visible from quite a few locations throughout the region.
However, from a number of these locations the turbines may appear to be quite small
and could remain unnoticed by all but the most careful observers.
In light of these results, my recommendation to the College is to continue researching
the Project while maintaining an open dialog with the local communities.
Advisor:
Professor
Sarah
R.
Bolton, Physics
Copyright
@
2004
Samuel
Max
Arons
Acknowledgments
1
Abstract ii
List of Figures vii
List
of Tables xii
1
Introduction
1
1.1
Format of the Thesis 2
1.2 Site Location 3
1.3 Project History 3
2
Fluid Flow in Simple Geometries
6
2.1 The Navier-Stokes Equation 6
2.2 Flow Between Parallel Planes 7
2.3 Flow Through a Tube 9
2.4 The Need for Wind Data 10
3
Turbines and Prediction Methodology
11
3.1 Modern Wind Turbines
11
3.1.1 Turbine Properties
11
3.1.2 Power Curves and Mechanical Efficiency 13
3.2 Energy Production 16
3.2.1 Speed Distributions 16
3.2.2 Truewind 19
3.2.3 Speed Extrapolation 20
3.2.4 Air Density 21
3.2.5 Error Analysis 23
4
Brodie Data Analysis
24
4.1 Energy Production Estimates 24
4.1.1 Log Law 26
4.1.2 Power Law,
a
=
117 32
4.1.3 Power Law, Variable
a
34
4.1.4 Weibull Distribution 37
CONTENTS
v
4.1.5 Rayleigh Distribution 42
4.1.6 The Local Wind Resource 44
4.2 Comparison of the Six Energy Estimation
Methods 45
4.2.1 Truewind Accuracy 48
4.3
Comparison of 1997 to 1998 Log Law
Predictions 49
4.4 Wind Direction at Brodie Mountain 51
4.5 Summary of Results 53
5
Lincoln Labs Data Analysis
5 5
5.1 Energy Production Estimates 55
5.1.1 Log Law: MTR 57
5.1.2 Weibull Distribution:
MTR
59
5.1.3 Truewind Accuracy 61
5.1.4 Taconic Ridge (TCN)
&
Notch Road (NCH) 63
5.2 Wind Direction at Mt . Raimer 64
5.3 Summary of Results 66
6
Black Data Analysis
6
9
6.1 Black's Instruments and the In Situ Divisor 69
6.2 Energy Production Estimates 71
6.2.1 Log Law 72
6.2.2 Weibull Distribution 74
6.2.3 Truewind Accuracy 76
6.3 Wind Direction at Berlin Pass 77
6.4 Summary of Results 81
7
Energy Yield at Berlin Pass
8
2
7.1 Truewind's Accuracy and the
y
Factor 82
7.2 Energy Yield at Berlin Pass 84
7.2.1 Monthly and Annual Figures 84
7.2.2 Error Analysis 86
7.2.3 Comparison with Black's Thesis Data Prediction 87
7.3 Wind Direction at Berlin Pass 88
7.4 Summary of Results 89
8
A Met Tower on the Roof
90
8.1 Equipment List
&
Initial Testing 90
8.2 The MSL Roof Met Tower 92
8.2.1 Installation 92
8.2.2 Preliminary Results 93
9
Visual Impact
97
9.1 Viewshed
&
Image Collection 97
CONTENTS
vi
9.2 The Digital Camera 100
9.2.1 Angular Pixel Size: Theoretical 100
9.2.2 Angular Pixel Size: Experimental 102
9.3 Creating the Images 103
9.4 Conclusions 104
10 Conclusions
&
Further Research
106
10.1 Conclusions 106
10.2 Future Research 107
A
The Betz Limit and Power Curves 109
A.l Available Wind Power 109
A.2 Betz Limit 110
A.3 Power Curves 112
B
WindDat a
.
gs
Program Code and Sample Output 113
B.l
WindData.gs
Code 113
B.2 Sample Command-Line Output 118
B.3 Sample Output File 120
C The Global Wind Resource 121
C.1 Solar Radiation
&
Terrestrial Absorption 121
C.2
A
Giant Heat Engine in the Sky 121
C.3 Extracting Aeolian Energy 122
C.4 United States Energy Consumption 122
C.5 World Energy Consumption 123
C.6 Conclusions 124
D Met Tower Diagrams 126
E
Visual Impact Images 131
Bibliography 193
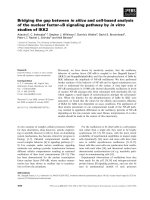
The proposed site of the Berlin Wind Project at Berlin Pass
Flow between two parallel planes
The solution to the Navier-Stokes equation for the 'jet stream' between
two parallel planes
Flow through a circular cylinder
Four General Electric 1.5 MW turbines in Gatun. Spain
Rime ice shedding from a turbine
Theoretical maximum power curve compared to a real GE 1.5 MW power
curve
A
close-up view of the
GE
1.5 MW power curve
The efficiency of GE's 1.5 MW turbine
The distribution of wind speeds at Brodie Mountain in January 1998
Two Weibull distributions with different
k
values
Two Rayleigh distributions with different
V
values
Comparison of log and power laws
The location of Brodie Mountain with respect to Berlin Pass
Monthly log law production estimates for Brodie Mountain. 1998
Monthly energy demand in New England. March 2003-February 2004
Monthly energy demand at Williams College. July 2002-June 2003
Monthly fixed-a power law production estimates for Brodie Mountain.
1998
Monthly variable-a power law production estimates for Brodie Mountain.
1998
Monthly Weibull distribution production estimates for Brodie Mountain.
1998
Close-up of the monthly Weibull distribution estimates
Monthly Rayleigh distribution production estimates for Brodie Mountain.
1998
The monthly wind resource at Brodie Mountain. 1998
Predicted energy yield vs
.
production method. by month
.
Brodie Moun-
tain. 1998
LIST
OF
FIGURES
viii
4.12 Predicted energy yield vs
.
production method. by method
.
Brodie Moun-
tain. 1998
47
4.13 Predicted annual energy yield vs
.
production method
.
Brodie Mountain.
1998
47
4.14 Comparison of 1997 and 1998 log-law energy predictions for Brodie Moun-
tain
50
4.15 Empirical wind rose diagram for Brodie Mountain, 1998
51
4.16 Truewind-predicted wind rose diagram for Brodie Mountain 52
Map of the Berkshire Mesonet
56
Monthly log law production estimates at Mt
.
Raimer. 2001
58
Monthly Weibull distribution production estimates at Mt
.
Raimer. 2001
.
60
Comparison of annual energy production estimates for Mt
.
Raimer. 2001
.
62
Comparison of annual energy production estimates for the Taconic Ridge.
2001
64
Empirical wind rose diagram for Mt
.
Raimer. June-November 2001
65
Truewind-predicted wind rose diagram for Mt
.
Raimer
67
The approximate locations of Black's met towers
70
Monthly log law production estimates for Berlin Pass. 1980-81
73
Monthly Weibull distribution production estimates for Berlin Pass. 1980-81
.
75
Comparison of annual energy production estimates for Berlin Pass
77
Empirical wind rose diagram for Berlin Pass, 1980-81
.
These data are
likely inaccurate
79
Truewind-predicted wind rose diagram for Berlin Pass, 1980-81
80
Comparison of energy yield at Berlin Pass predicted by Black's thesis data
and by Truewind's maps
87
Truewind-predicted wind rose diagram for Berlin Pass
88
The approximate location of the MSL met tower on the campus of Williams
College
91
Installation of the met tower on the MSL roof
93
Wind speed distribution at the roof of the Morley Science Laboratory
94
Hourly wind speed averages at the roof of the Morley Science Laboratory
.
95
Empirical wind rose diagram for the roof of the Morley Science Laboratory
.
96
The viewshed of the BWP's 7 turbines
98
The 45 viewpoints of the visual impact study
99
Schematic diagram of the angular size of
a
turbine
100
Diagram of a camera's lens
101
Experimental setup to determine angular pixel size
103
The three steps for placing the turbines in the images
105
Air of density
p
flows through a cylinder of area
A
at speed
U
109
A.2 An actuator disc and stream tube
110
LIST
OF
FIGURES
ix
D.l
A schematic diagram of the MSL roof met tower.
. . . .
. . .
. .
.
. . .
127
D.2
A technical drawing of the mast holder seen from above.
.
.
. .
.
.
. . .
128
D.3
A technical drawing of the mast holder in vertical cross section.
.
.
. . .
129
D.4
A technical drawing of the flange rings and mounting arms.
. .
.
. . .
. . 130
E.l
A map of the
45
viewpoints for which potential views of the proposed
wind farm were generated.
.
. . .
.
.
. .
. . .
. . .
.
.
.
. .
.
.
.
. .
.
.
132
E.2
The
45
viewpoints for which visual impact images were created.
.
.
.
.
.
133
E.3
{Viewpoint
#1)
View from the summit of Pine Cobble, Williamstown,
MA. Distance to site:
10.1
km.
. . . .
.
.
. .
. .
. .
.
. .
. . . . . .
.
.
134
E.4
{Viewpoint
#2)
View from Pine Cobble development, Williamstown,
MA. Distance to site:
9.1
km.
.
. . . .
.
.
. .
. . . .
.
. . .
.
. . . . . .
135
E.5
{Viewpoint
#3)
View from the intersection of Cole Avenue and North
Hoosac, Williamstown, MA. Distance to site:
8.4
km.
. .
.
.
.
.
.
.
. . .
136
E.6
{Viewpoint
#3)
View from the intersection of Cole Avenue and North
Hoosac, Williamstown, MA (zoomed in). Distance to site:
8.4
km.
. .
.
.
137
E.7
{Viewpoint
#4)
View from Whitman Road, Williamstown, MA. Distance
to site:
6.9
km. Turbines obscured by vegetation (possibly all year 'round).
138
E.8
(Vicwpoint
#5)
View from outside Thomson Chapel, Williams College
campus, Williamstown, MA. Distance to site:
7.1
km. Turbines obscured
by vegetation (in summer).
. .
.
.
. .
. .
. .
.
. .
.
.
. . .
. . . .
. .
.
. 139
E.9
{Viewpoint
#6)
View from the Taconic Golf Course, Williamstown, MA.
Distance to site:
7.0
km. Turbines obscured by vegetation (possibly all
year 'round).
. . . . . . . . .
.
. . . .
.
. . .
.
. . . . .
.
.
.
.
. . .
.
.
140
E.10
{Viewpoint
#7)
View from Stone Hill, Williamstown, MA. Distance to
site:
5.8
km. Turbines obscured by vegetation (in summer).
. . . . . . . .
141
E.ll
{Viewpoint
#8)
View from the Mt. Greylock High School football field,
Williamstown, MA. Distance to site:
5.9
km.
.
. .
.
.
.
.
. .
. .
. . .
.
. 142
E.12
{Viewpoint
#8)
View from the Mt. Greylock High School football field,
Williamstown, MA (zoomed in). Distance to site:
5.9
km.
.
.
.
.
. .
.
.
143
E.13
{Viewpoint
#9)
View of Berlin Pass from Five Corners, Williamstown,
MA. Distance to site:
6.2
km. Turbines obscured by vegetation (in summer).
144
E.14
{Viewpoint
#lo)
View from Stony Ledge, Williamstown, MA. Distance
to site:
10.6
km. Turbines obscured by vegetation (in summer).
. . .
. . 145
E.15
{Viewpoint
#ll)
View from the summit of Mt. Greylock, Adams, MA.
Distance to site:
12.8
km.
.
. .
.
. . . . .
.
.
.
. . . . . . .
.
. . . . . .
146
E.16
{Viewpoint
#11)
View from the summit of Mt. Greylock, Adams, MA
(zoomed in). Distance to site:
12.8
km.
. . .
. .
. .
.
.
.
. . . . . . . .
. 147
E.17
{Viewpoint
#12)
View from the top of the Greylock War Memorial,
Adams, MA. Distance to site:
12.8
km.
. .
. .
. . .
.
.
. . . . . .
. . . . 148
E.18
{Viewpoint
#12)
View from the top of the Greylock War Memorial,
Adams, MA (zoomed in). Distance to site:
12.8
km.
. . .
. .
. . . . .
.
.
149
E.19
{Viewpoint
#13)
View from Mt. Prospect where the AT takes a
90"
turn,
Williamstown, MA. Distance to site:
10.2
km.
.
.
. . . . . . .
.
.
.
.
. . 150
LIST OF FIGURES
x
E.20
{Viewpoint
#14)
View from Blair Road, Williamstown, MA. Distance to
site:
8.4
km.
E.21
{Viewpoint
#15)
View from Pattison Road, Williamstown, MA. Distance
to site:
9.6
km.
E.22
{Viewpoint
#15)
View from Pattison Road, Williamstown, MA (zoomed
in). Distance to site:
9.6
km.
E.23
{Viewpoint
#16)
View from Route
2
at Luce Road, Williamstown, MA.
Distance to site:
8.8
km.
E.24
{Viewpoint
#16)
View from Route
2
at Luce Road, Williamstown, MA
(zoomed in). Distance to site:
8.8
km.
E.25
{Viewpoint
#17)
View from the Stop 'n' Shop parking lot, North Adams,
MA. Distance to site:
10.2
km.
E.26
{Viewpoint
#17)
View from the Stop
'n'
Shop parking lot, North Adams,
MA (zoomed in). Distance to site:
10.2
km.
E.27
{Viewpoint
#18)
View from Massachusetts Avenue, Blackinton, MA. Dis-
tance to site:
10.7
km.
E.28
{Viewpoint
#19)
View from the Protection Avenue bridge, North Adams,
MA. Distance to site:
11.4
km.
E.29
{Viewpoint
#20)
View from Route
2,
1
km from North Adams, MA.
Distance to site:
13.4
km. Turbines obscured by vegetation (in summer).
E.30
{Viewpoint
#21)
View the MassMoCA parking lot, North Adams, MA.
Distance to site:
14.4
km. Turbines obscured by buildings.
E.31
{Viewpoint
#22)
View from the top of the hairpin turn, North Adams,
MA.
Distance to site:
18.3
km.
E.32
{Viewpoint
#23)
View from the old Williams College ski area parking
lot, Williamstown, MA (zoomed in). Distance to site:
1.1
km.
E.33
{Viewpoint
#24)
View looking south from the proposed wind farm site
at Berlin Pass, Berlin, NY. Distance to site: n/a.
E.34
{Viewpoint
#25)
View from the summit of Berlin Mountain, Berlin,
NY.
Distance to site:
1.8
km. Turbines obscured by vegetation (in summer).
.
E.35
{Viewpoint
#25)
View from the summit of Berlin Mountain, Berlin, NY
(zoomed in). Distance to site:
1.8
km. Turbines obscured by vegetation
(in summer).
E.36
{Viewpoint
#26)
View from
400
m northwest of the intersection of Green
Hollow Road and Cold Spring Road, Berlin, NY. Distance to site:
3.8
km.
E.37
{Viewpoint
#26)
View from
400
m northwest of the intersection of Green
Hollow Road and Cold Spring Road, Berlin, NY (zoomed in). Distance
to site:
3.8
km.
E.38
{Viewpoint
#27)
View from
500
m west of the intersection of Green
Hollow Road and Cold Spring Road, Berlin, NY. Distance to site:
4.2
km.
E.39
{Viewpoint
#28)
View from the intersection of Route
22
&
Elm Street
(Green Hollow Road), Berlin,
NY.
Distance to site:
7.0
km.
Turbines
obscured by vegetation (possibly all year 'round).
E.40
{Viewpoint
#29)
View from Route
22, 1.3
km south of Berlin, NY. Dis-
tance to site:
7.0
km.
LIST
OF
FIGURES
xi
E.41 {Viewpoint #29) View from Route 22, 1.3 km south of Berlin, NY
(zoomed in). Distance to site: 7.0 km.
. .
. .
. .
.
.
. . . . . .
. .
. . .
172
E.42 {Viewpoint #30) View from Route 22, 200 m north of Satterlee Hollow
Raod, Berlin, NY. Distance to site: 7.3 km.
. . . . .
. . .
. .
.
. .
.
. .
173
E.43 {Viewpoint #31) View from Route 40, 1.3 km west of Berlin, NY. Dis-
tance to site: 8.4 km.
. . .
. . . .
.
. . . .
. . .
.
.
. .
.
.
.
. . .
.
. .
. 174
E.44 {Viewpoint #31) View from Route 40, 1.3 km west of Berlin, NY (zoomed
in). Distance to site: 8.4 km.
.
.
.
. .
. .
. . .
.
.
.
.
. . . . . . . .
.
. .
175
E.45 {Viewpoint #32) View from Cherry Plain State Park, Stephentown, NY.
Distance to site: 14.1 km. Turbines obscured by topography and vegetation. 176
E.46 {Viewpoint #33) View from Miller Road, Berlin, NY. Distance to site:
12.5 km. Turbines obscured by topography and vegetation.
. .
.
. .
. . .
177
E.47 {Viewpoint #34) View from Dutch Church Road, Berlin, NY. Distance
to site: 12.0 km. Turbines obscured by topography and vegetation.
. . . 178
E.48 {Viewpoint #35) View from Grafton Lakes State Park, Grafton, NY.
Distance to site: 15.6 km. Turbines obscured by topography and vegetation. 179
E.49 {Viewpoint #36) View from 100 m north of the intersection of Routes 2
&
22, Petersburg, NY. Distance to site: 6.7 km.
. .
.
. .
.
.
.
.
.
.
. . .
180
E.50 {Viewpoint #37) View from 350 m west of the intersection of Routes 2
&
22, Petersburg, NY. Distance to site: 7.0 km. . .
.
.
. . . . .
.
. . . .
181
E.51 {Viewpoint #37) View from 350 m west of the intersection of Routes 2
&
22, Petersburg, NY (zoomed in). Distance to site: 7.0 km.
.
.
. . . . .
182
E.52 {Viewpoint #38) View from Route 2 near the border of Petersburg and
Grafton, NY. Distance to site: 9.3 km. Turbines obscured by topography
and vegetation.
.
.
. . .
.
. .
. .
. .
. .
.
.
.
.
.
.
. .
.
. .
.
. . . . .
. 183
E.53 {Viewpoint #39) View from Route 22, 2.8 km north of Petersburg, NY.
Distance to site: 8.8 km.
.
.
.
.
.
. .
.
.
.
. .
. . .
.
. . . .
. .
.
.
. . .
184
E.54 {Viewpoint #39) View from Route 22, 2.8 km north of Petersburg, NY
(zoomed in). Distance to site: 8.8 km.
. . . .
.
.
.
. .
.
.
. .
. . . . . .
185
E.55 {Viewpoint #40) View from Route 2 at East Hollow Road, Petersburg,
NY. Distance to site: 3.7 km.
.
. . . . . .
. .
.
.
.
.
. . . .
.
. .
.
. . .
186
E.56 {Viewpoint #41) View from Route 2, 800 m east of East Hollow Road,
Petersburg, NY. Distance to site: 4.2 km.
.
.
.
.
. . . .
.
.
.
. . . . . .
.
187
E.57 {Viewpoint #41) View from Route 2, 800 m east of East Hollow Road,
Petersburg, NY (zoomed in). Distance to site: 4.2 km.
. .
.
. .
.
. .
.
.
188
E.58 {Viewpoint #42) View from the Taconic Crest Trail, 3 km north of where
Route
2
crosses Petersburg Pass, just west of the New York/Vermont
border. Distance to site: 4.8 km.
. .
.
.
. . .
.
. . . . . . . . .
.
. . . .
189
E.59 {Viewpoint #43) View from Post Road, Pownal, VT. Distance to site:
7.7 km. Turbines obscured by topography.
.
.
. .
. .
. .
. . .
. .
. .
.
.
190
E.60 {Viewpoint #44) View from Route
7,
3.5 km north of the Massachusetts
border, Pownal, VT. Distance to site: 8.7 km.
Turbines obscured by
topography.
191
E.61 {Viewpoint #45) View from top of Mann Hill Road, Pownal, VT. Dis-
tance to site: 9.8 km. Turbines obscured by topography.
. . .
.
. . . .
. 192
Average monthly air temperatures. pressures. and densities for Brodie
Mountain. 1998
Log law energy estimates for Brodie Mountain. 1998
Fixed-a power law energy estimates for Brodie Mountain. 1998
Variable-a power law energy estimates for Brodie Mountain. 1998
Weibull distribution energy estimates for Brodie Mountain. 1998
Values of
c
and
k
at several possible locations of the Brodie anemometer
tower
Rayleigh distribution energy estimates for Brodie Mountain. 1998
Values of
V
at several possible locations of the Brodie anemometer tower
.
The wind resource at Brodie Mountain in 1998
4.10 Monthly percentage differences between log law and Truewind at Brodie
Mountain. 1998
49
4.11 Monthly percentage differences between 1997 and 1998 log-law predictions
for Brodie Mountain
50
4.12 Summary of predicted annual energy yields for Brodie Mountain, 1998
.
.
53
Site characteristics of the Berkshire Mesonet weather towers
56
Log law energy estimates for Mt
.
Raimer. 2001
57
Seasonal
c
and
k
values for Mt
.
Raimer
59
Weibull distribution energy estimates for Mt
.
Raimer, 2001
60
Monthly percentage differences between log law and Truewind for Mt
.
Raimer. 2001
62
Summary of predicted annual energy yields for Mt
.
Raimer. 2001
66
Sensor calibration results for Black's
PASS100
anemometer
72
Log la. w energy estimates for Berlin Pass. 1980-81
73
Seasonal
c
and
k
values for Berlin Pass
74
Weibull distribution energy estimates for Berlin Pass, 1980-81
75
Monthly percentage differences between log law and Truewind for Berlin
Pass, 1980-81
76
Summary of predicted annual energy yields for Berlin Pass, 1980-81
81
Comparison of Truewind's 'overestimate percentage' for four data sets
.
.
83
Annual
c
and
k
values for each of the 7 proposed turbines at Berlin Pass
.
85
xii
LIST
OF
TABLES
xiii
7.3
Annual Truewind predictions of energy yield for
7
turbines at Berlin Pass. 85
7.4
Comparison of energy predictions made from Black's thesis data and
Truewind's maps.
87
7.5
Predicted annual energy yield and payback time for a 7-turbine wind farm
at Berlin Pass. 89
9.1 Characteristics of the Olympus D-490 digital camera.
102
C
ter
cti
The purpose of this thesis is to address the question of wind power in the northwest
Berkshire/northern Taconic region, focusing specifically on a ridge known as Berlin Pass.
The Berlin Wind Project (BWP), a Williams College-sponsored study of the potential for
electricity generation by a 7-9-turbine wind farm at the ridge, is particularly interested
in the Pass because of the high wind speeds predicted to be prevalent there. Among the
many issues the project faces in assessing the viability of the proposed wind farm are
two of critical importance:
(1)
energy yield and (2) visual impact. The work presented
herein, carried out between June 2003 and May 2004, represents an attempt to resolve
these issues.
The question of potential energy yield is particularly acute for the BWP. Though in
general, power output at a site is estimated using wind data from a year-long anemometer
study, the project has so far been unable to obtain a permit from the town of Berlin,
NY
to erect such a tower. Furthermore, past studies of the project have included only
rough estimates of annual energy production ([25], [2], [Ill). Thus, if we seek a more
reliable estimate-before anemometer data become available-we will have to obtain it
in some other manner.
This thesis explores three distinct means of predicting energy yield in the absence of
site-specific wind data.
(1)
To begin, we consider the possibility of analytically calculat-
ing the wind regime using the equations of fluid mechanics. It soon becomes apparent,
however, that beyond the simplest models this method proves quite difficult. (2) Next,
we analyze wind data from three nearby, 'surrogate' sites in the hopes that their wind
regimes are similar enough to that at the Pass to reasonably approximate the energy
production there. (3) At the same time, we predict energy yield both at these surrogate
sites and at the Pass itself using Weibull coefficients from wind maps developed by AWS
Truewind, LLC, an energy technology and atmospheric modeling firm.
Separately, the latter two methods can give only rough estimates of production at
Berlin Pass-but
together
they conspire to predict energy yield much more accurately.
That is, if we compare the so-called 'Truewind' predictions to the actual wind-data
predictions at the surrogate sites, we can determine by what factor Truewind generally
over- or underestimates energy yield. Armed with this knowledge, we can then use
Truewind to estimate production at the Pass-and finally multiply by the empirical
'over- (or under-) estimation factor' to 're-scale' the Truewind estimate and obtain the
1.1.
FORMAT
OF
THE THESIS
2
most careful and rigorous prediction of energy yield at Berlin Pass to date.
In carrying out the comparisons between
Truewind and wind data from Brodie Moun-
tain (Lanesboro,
MA),
Mt
.
Raimer (Berlin,
NY)
,
and a small section of Berlin Pass itself,
I conclude that Truewind provides quite reasonable energy production estimates, so long
as the site in question can be accurately located on its wind maps; on average,
Truewind
overestimates energy yield by only 16.3 A 14.4%. Truewind also predicts directional dis-
tributions quite reasonably. Furthermore,
I
predict the average annual energy yield at
Berlin Pass to be 35.0
+
8.1 million kW-hr, or 163 1.21% of Williams College's energy use
during the 2002-2003 academic year. Because of natural fluctuations in wind speed, this
value could vary by as much as an additional &lo% from year to year. In addition, since
the prevailing winds at the Pass blow from the WNW and the ridgeline runs NNE-SSW,
turbine shading should not cause substantial energy losses-though there would likely
be some losses from a moderate SSW wind component. Assuming a net turbine cost
(sale price
+
installation) of $1.24 million ($8.65 million for
7
turbines) and an average
wholesale electricity price of $38/MW-hrl, a 7-turbine wind farm could pay for itself in,
very roughly, 6.5
&
1.6 years.
A
more detailed financial analysis would be necessary to
obtain a more accurate estimate of the payback time.
The visual impact of the proposed wind farm must be assessed for two reasons. First,
in order to issue a building permit, the town of Berlin requires images showing the Pass
before and after turbine installation. Second, local residents are entitled to know what
the farm would look like so that they can fairly weigh the costs and benefits of the
project. In presenting the results of the visual impact study, I hope to satisfy these
needs.
I
conclude that the turbines are likely to be visible from quite a few densely
populated and heavily used regions-but that from a number of these regions they may
in fact appear to be quite small, and could even go unnoticed by the casual observer.
These results suggest that the Berlin Wind Project is a viable way to generate sig-
nificant amounts of electricity while avoiding the emissions associated with conventional
means of energy production. At the same time, the turbines at Berlin Pass would be
visible from a number of locations throughout the northwest
Berkshire/Taconic region.
Thus, my recommendation is that the College continue researching the Project while
maintaining an open dialog with the local communities so that, together, they may de-
cide whether the BWP represents a worthwhile pursuit for the region as a whole. If so,
the next step is to erect a meteorological tower and to conduct a year-long anemometer
study at Berlin Pass in order to collect data and fully characterize the wind regime there.
1.1
Format of the
Thesis
The thesis is arranged in the following manner:
This chapter
provides a brief history of the Berlin Wind Project and describes the
proposed site at Berlin Pass.
Chapter
2
derives fluid flow in a few simple geometries from basic fluid mechanics.
'Personal communication with Nicholas Hiza,
10
May
2004.
1.2.
SITE LOCATION
3
Chapter
3
examines the modern wind turbine and derives several different method-
ologies for estimating energy yield, in addition to describing how to evaluate the
uncertainty in those estimates.
Chapter
4
offers and compares six separate estimates of energy yield and wind di-
rection at Brodie Mountain, using wind data collected by the Renewable Energy
Research Laboratory (RERL) at
UMass Amherst.
Chapter
5
presents an estimate of energy yield and wind direction at Mt. Raimer,
using data collected by researchers at MIT's Lincoln Laboratory.
Chapter
6
offers a preliminary estimate of energy yield and wind direction at Berlin
Pass, using data collected by Thomas Black '81.
Chapter
7
combines the results of Chapters 4-6 in order to rigorously predict the
expected energy yield of a 7-turbine wind farm at Berlin Pass.
Chapter
8
describes tests performed on wind instruments mounted to a meteorological
tower on the roof of Williams College's Morley Science Center and presents the
prelimina,ry results of those tests.
Chapter
9
explains how the visual impact study of the Berlin Wind Project was real-
ized. The visual impact images are presented in Appendix E.
Chapter
10
offers suggestions for future work that could follow from the results pre-
sented in the thesis.
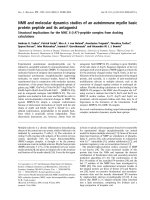
1.2
ite Location
The site of the proposed wind farm is located at Berlin Pass, a ridge in the northern
Taconic range joining Mt. Raimer to the north and Berlin Mountain to the south. The
parcel of land, which is owned by Williams College and which is the former location of
the College ski area, lies approximately 5.6 km (3.5 mi) to the west of Williamstown,
MA, 6.4 km (4 mi) east of Berlin,
NY,
and less than 1.6 km (1 mi) south of where Route
2 crosses Petersburg Pass (Figure
1.1).
The elevation of the site is approximately 670 m
(2,220 ft) above sea level. Because the Pass represents a low point between Mt. Raimer
and Berlin Mountain, the prevailing northwest winds are channeled through the site,
making it an attractive location for electricity generation (after
[ll]).
1.3
Project
What is now known as the Berlin Wind Project was first conceived in 1976 by Reed
Zars '77. During his senior year, Zars conducted an independent study to evaluate the
feasibility of installing a small-scale wind farm at Berlin Pass. In a report to the Trustees
entitled
'
The Proposed Wind Energy System for Williams College', he concluded that if
the college were to invest some $524,000 (1977 dollars) in three 200-kW machines, the
1.3.
PROJECT
HISTORY
4
Figure
1.1:
The proposed site of the Berlin Wind Project at Berlin
Pass
is outlined in
red. The translucent irregular polygon is the property owned
by
Williams College.
1.3.
PROJECT
HISTORY
5
farm would generate approximately $72,000 in electricity bill savings each year ([25],
121
1.
Zars' report, however, was admittedly preliminary, and he closed with an appeal for
further research. For several years no additional progress was made until, in June of 1980,
Thomas Black
'81 began work on his senior environmental studies thesis. Over the course
of twelve months-from August 1980 to July 1981-Black collected wind data at the Pass
as part of what he dubbed the 'Williams Wind Energy Research Project' (WWERP).
These data, though unfortunately incomplete because of a vandalism problem at the
site, allowed Black to conduct a more careful evaluation of the economic feasibility
of the project than Zars. Black's thesis,
'A
Comprehensive Technical and Economic
Feaszbility Study of Large-Scale Generation of Electricity
by
Wind Power at Berlin Pass',
concluded that a wind farm at the pass could repay its capital outlay within a period of
approximately 20 years ([2],
[ll])
.
Over the next twenty-one years the project fell by the wayside. Then, in early 2002,
a group of four Williams students-Nicholas Hiza, Frederick Hines, Chris Warshaw,
and Stefan Kaczmarek, all '02-became aware of the project in an alternative energies
course and decided to learn more about it. Over the next several months, in an effort
spearheaded by Hiza, the group completed financial, site, and permitting analyses and
found the project to warrant further investigation. A website was ~reated,~ newspaper
articles were written, and suddenly, the Berlin Wind Project came back to life
([Ill).
I
became involved in the project in June 2003 as the summer 'wind intern', during
which time
I
completed the visual impact study (Chapter 9) funded by the Center for
Environmental Studies (CES). As the school year began and my focus shifted towards
predicting energy yield, my work gradually took the shape of the thesis presented here.
2~he Berlin Wind Project:
Ideally, instead of collecting wind data to predict the energy yield at Berlin Pass, we
would analytically solve the equations of fluid mechanics to calculate the wind regime
there. In practice, however, it is quite difficult to do so-and in order to appreciate this
difficulty, we begin with a theoretical examination of fluid flow in planar and cylindrical
geometries.
The scenarios presented here represent two of the simplest models of the jet stream,
which we assume to generate the wind regime all the way from the ground, where the
wind speed is zero, to the altitude of the jet stream itself.
I
initially intended these
models as studies leading up to a fuller two-dimensional characterization of the jet
stream flowing over flat ground, with dependence not only on
s
but on
0
as well (see
Figure 2.3). Unfortunately, time constraints did not allow me to complete this more
realistic model, and so here
I
present only the results of the initial studies.
2.1
The
Navier-Stokes Equation
The Navier-Stokes equation, which is the general description of the motion of a fluid, is
where
p
is the density of the fluid,
P
is the pressure, C(Z,t) is the velocity of the
fluid parcel, and
q
and are the 'coefficients of viscosity'
(C
is often called the 'second
viscosity'). In general,
1)
and are functions of temperature and pressure, though in
most cases they do not vary significantly over the fluid, so we can assume they are
constants. In addition, the convective derivative
If we assume the fluid to be incompressible, then
V
v'
=
0
and Equation 2.1 reduces
2.2.
FLOW BETWEEN PARALLEL PLANES
7
We will use this simplified version of the Navier-Stokes equation to calculate fluid flow.
2.2
low Between Parallel
Figure 2.1: Flow between two parallel planes.
To begin, we consider the simplest motion: steady linear flow bet,ween two parallel
planes (Figure 2.1). This scenario represents a simple model of the 'jet stream' flowing
above (and below) the 'ground', where the wind speed is defined to be zero.
In
this case,
where the initial condition is v,(O)
=
v, and the boundary condition is v,(~w)
=
0.
We can now further simplify the Navier-Stokes equation. Because the flow is steady,
the derivative of velocity with respect to time is zero. In addition, since each component
vi does not depend on coordinate xi,
(v'
.
V)v'
=
0 as well.
Note that in Equation
2.3
V2v' is
not
the Laplacian because
v'
is a vector. We can,
however, expand this term using the the identity
which gives
v2v'=-vxvxc
since V .v'
=
0.
Thus,
Finally, if we assume that pressure
P
is a linear function of
x,
then
Combining these results together, the Navier-Stokes equation reduces to
2.3.
FLOW THROUGH
A
TUBE
8
if we drop the
2.
This equation can be solved by separation of variables to give
where Cl and C2 are the constants of integration. Applying our boundary and initial
conditions, we obtain
k2
2
v,(x)
=
(X
-
W
).
(2.11)
27
This solution tells us that the 'jet stream' sets up a parabolic wind speed profile
over completely flat ground. If we assume our model jet stream behaves reasonably like
the real thing, then its average speed is
41
m/s (92 mph; 300 mph in winter) and its
average altitude is 12 km (7.5 mi).2 Thus, v,
=
41 m/s,
w
=
1.2
x
lo4
m, and we can
calculate k/2q to be 2.8
x
lop7
m-Is-'. Interestingly, we do not actually have to solve
for k or 7-it suffices to calculate their ratio from the boundary conditions. However,
since q
=
1.8
x
lov5
kg/m.sec for air,3 we can determine that the pressure gradient
k
=
1.02
x
lo-''
N/m3. This particular solution is plotted in Figure 2.2.
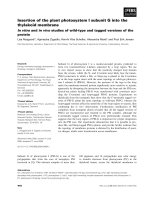
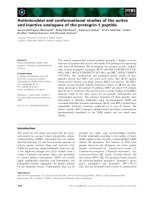
Figure 2.2: The solution to the Navier-Stokes equation for the 'jet stream' between two
parallel planes
(w
=
12,000 m and v,
=
41 m/s).
At the altitude of Berlin Pass (-670 m), the solution gives a wind speed of about
4.4
m/s, which is surprisingly reasonable considering that the average wind speed at Berlin
Pass is around 8-10 m/s. Of course, in reality the topography of Berlin Pass is anything
but flat, so we cannot rely on this model's predictions of wind speed to seriously predict
a wind farm's energy yield there.
2.3.
FLOW THROUGH
A
TUBE
9
Figure 2.3: Flow through a circular cylinder.
2.3
Flow
Through
a
Next, we consider air flow through a tube of radius
R,
where
v'(q
varies as a function
of radius
s
(Figure 2.3). We can think of this situation as the 'jet stream' flowing above
(indeed, through) the ground. Cylindrical coordinates are the most convenient here, so
we have
v'
=
vz(s)2, (2.12)
where the initial condition is v,(O)
=
v, and the boundary condition is v,(R)
=
0. To
simplify the Navier-Stokes equation (Equation 2.3)) we must derive
v'
.
V
in cylindrical
coordinates; it is not necessarily zero here as it was in the Section 2.2. The algebra is a
bit messy, but it turns out that
In our case,
v'.
V
=
0
because the only term that could possibly survive-dv,/as-gets
multiplied by v,, which is zero. Similarly,
v'(3
does not depend on time, so
ail/&
=
0
as well. Thus, Equation 2.3 becomes
The second term can be simplified according to Equation 2.5 to become, in the geometry
of this scenario,
jj=
ig
is$)
jj.
(2.15)
2Jet stream data from the National Oceanic and Atmospheric Administration (NOAA) website:
3[16],
p.
46
2.4.
THE
NEED
FOR
WIND
DATA
10
Finally, if we assume that the pressure
P
is a linear function of
x,
then
VP
=
k
and the
Navier-Stokes equation reduces to
if we drop the
2.
To solve this equation, we simply integrate twice to obtain
where C1 and
C2
are constants of integration. We immediately know that
C1
must be
0 because if not the function would blow up at the origin. Applying our boundary and
initial conditions, we obtain, surprisingly,
The cylindrical solution differs from the planar solution only by a factor of 1/2! And,
because we
fix
R
and
v,
(at 12 km and 41 m/s), the pressure gradient
k
must increase
by a factor of 2 to accommodate-so this solution is exactly the same as that in Section
2.2, except that here
k
=
2.03
x
10-l1 N/m3 (see Figure 2.2). Thus, the cylindrical
geometry predicts a wind speed of about
4.4
m/s at an altitude of
670
m as well.
2.4
The Need
for
Wind
Data
As the calculations above illustrate, to analytically determine air flow over even the
simplest geometries can be quite difficult-and as the geometry becomes more complex,
the Navier-Stokes equation quickly becomes intractable. Thus, it is not possible to
analytically solve it to predict the wind speeds at Berlin Pass; the most we could hope
for is to write a computer program to give us a numerical
s~lution.~ But such a result is
at best only an approximation-and hence, the surest way to make long-term predictions
of the wind resource at a site is to go out and measure the wind with an anemometer
or to use properly adjusted
Truewind data (Section 3.2.2).
4~his is in fact essentially how weather prediction simulations, such
as
those employed by
AWS
Truewind, work (see Section
3.2.2).