COMMUTER EXPOSURE TO AEROSOL POLLUTION ON PUBLIC TRANSPORT IN SINGAPORE 2
Bạn đang xem bản rút gọn của tài liệu. Xem và tải ngay bản đầy đủ của tài liệu tại đây (16.49 MB, 112 trang )
57
Chapter 4. Results
The results are presented in three parts. The statistical analysis of the door-to-door
journeys on each of the four modes of transport is presented first, followed by the
spatial variations observed within each transport mode and the results and analysis of
the dosage calculations.
Concentration spikes and calculation of geometric means
The 1 s and 10 s logging intervals managed to capture the numerous short-lived
concentration spikes that occurred throughout the sampling period. These short-lived
spikes resulted in distributions of exposure concentration that were skewed towards
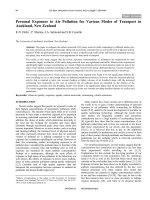
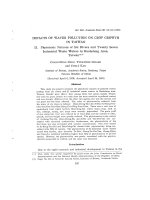
larger values. To illustrate the frequency of these spikes, time-series of the
measurements taken on 20 May 2013 are shown in Figure 4-1. Although some of
these sharp peaks may be classified as extreme outliers (defined as > 3 standard
deviations [SD] above the mean), they are a common occurrence and a real
component of the total pollutant concentration, thus they have not been removed. To
account for these values without giving them too much weight, the geometric mean
(GM) is used as the main descriptive statistic for each trip. The GM is essentially the
logarithmic mean of the data, obtained by applying a logarithmic transformation on
the data, taking the arithmetic mean, then back-transforming the mean values by
taking the antilog. Other studies have also used the GM instead of the arithmetic
mean to better describe the data (e.g. Gulliver and Briggs, 2004, de Nazelle et al.,
2012).
58
Figure 4-1: Post-processed data measured on 20 May 2013. Time-series shown include
one day of measurements on all transport modes. High variability and presence of spikes
are evident in all measured parameters.
In the rest of this thesis, the GM represents the average pollutant
concentration measured during one door-to-door trip for each mode of transport or
within a particular section of a trip. The arithmetic mean was only used to average
HR and V
E
. For MRT mode, data from both trips on each day of measurement were
combined for a total of 23 sets for analysis. However, for calculation of dosage, only
data from the first MRT mode trip of each day were used. In the following
description of results, ‘mean’ refers to the arithmetic mean of the GMs for each trip
0
50
100
150
200
PM
1
(µg m
-3
)
0
50
100
150
200
PM
2.5
(µg m
-3
)
0
100
200
300
400
PM
10
(µg m
-3
)
0
50
100
150
PN (10
3
# cm
-3
)
0
200
400
600
800
ASA (mm
2
m
-3
)
0
200
400
600
pPAHs (ngm
-3
)
0
10
20
30
40
50
16:30 17:00 17:30 18:00
Local Time
BC (µgm
-3
)
0.0
0.5
1.0
1.5
2.0
16:30 17:00 17:30 18:00
Local Time
CO (ppm)
59
or section. The boxplots presented in this chapter are also based on the GM from each
trip or section.
4.1 Commuter exposure on door-to-door trips
Mean values and SDs of all measurements are summarised in Table 4-1. More
detailed descriptive statistics including maximum and minimum values can be found
in Appendix D.1. The ratios of transport mode to background site (BG)
measurements in Table 4-2 provide a measure of the difference between
concentrations in the different transport microenvironments and at the ambient level.
Generally, all three PM size-fractions and PN concentrations are higher for the four
transport modes than at the background site, with the exception of the MRT mode.
This agrees with existing research on commuter exposure, which finds that
measurements in the transport microenvironment are elevated compared to ambient
readings (Kaur et al., 2005b; Gulliver and Briggs, 2007; de Nazelle et al., 2012). The
Walk (MRT) mode exhibits the highest (lowest) mean pollutant concentrations, while
CO values in the transport environment and at BG are similar. The results of the
individual pollutant metrics are described in more detail in the following sections.
Table 4-1: Mean (SD) of pollutant metrics from all trips for 4 transport modes and
measured at the background site. (N = 23 for Bus, Taxi, and MRT, N = 22 for Walk)
Transport mode PM
1
(µg m
-3
) PM
2.5
(µg m
-3
) PM
10
(µg m
-3
) PN (# cm
-3
)
Bus 28 (6) 29 (6) 32 (6) 28,916 (6,768)
MRT 27 (4) 27 (4) 30 (4) 14,418 (2,625)
Taxi 27 (7) 28 (7) 30 (7) 30,882 (13,799)
a
Walk 37 (9) 37 (9) 42 (9) 44,490 (6,142)
BG 25 (8) 25 (8) 27 (8) 21,893 (5,369)
ASA (mm
2
m
-3
) pPAHs (ng m
-3
)
BC (µg m
-3
) CO (ppm)
Bus 133 (25) 79 (27) 4.416 (2.318) 0.8 (0.7)
MRT 114 (16) 30 (6) 2.643 (1.345) 0.5 (0.7)
Taxi 140 (36) 86 (48) 4.368 (3.428) 1.0 (0.9)
Walk 137 (23) 99 (17) 7.590 (3.975) 0.6 (0.8)
BG - - - 0.9 (1.1)
60
Table 4-2: Transport mode to BG ratios from all trips for pollutant metrics measured in
both environments.
Transport mode PM
1
PM
2.5
PM
10
PN CO
Bus
1.15 1.16 1.20 1.32 0.88
MRT
1.07 1.08 1.10 0.66 0.53
Taxi
1.10 1.10 1.09 1.41 1.09
Walk
1.47 1.49 1.54 2.03 0.69
Statistical tests were also performed on the GM data to identify if
concentrations measured on each mode of transport were significantly different from
each other and BG. The results of the Kruskal-Wallis tests show a statistically
significant difference across all measured metrics at the 95% confidence level (p-
value < 0.05) (Table 4-3). Post-hoc multiple comparisons were carried out using the
Mann-Whitney U Test with Bonferroni correction to further discern which specific
modes contributed to the result. The results of these multiple-comparison tests are
presented in the following sections.
Table 4-3: Results from the Kruskal-Wallis test validating that concentrations measured
on each mode of transport were significantly different from each other and the
background site. H = test statistic, df = degrees of freedom.
Metric H df p-value
PM
1
25.198
4
0.00005*
PM
2.5
25.4264
4
0.00004*
PM
10
29.6262
4
<0.00001*
PN 75.3363
4
<0.00001*
ASA 14.1942
3
0.00265*
pPAHs 52.0131
3
<0.00001*
BC 28.7876
3
<0.00001*
CO 21.6463
4
0.00024*
** = p < 0.05
61
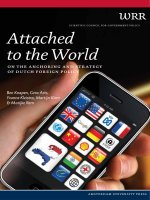
4.1.1 Particulate matter mass concentrations (PM)
The results for the three PM size-fractions measured are discussed together since the
trends between transport modes are similar (Figure 4-2). The highest mean
concentrations were observed during the Walk mode, with values above 35 µg m
-3
for
all three fractions (PM
1
: 37 µg m
-3
, PM
2.5
: 37 µg m
-3
, PM
10
:
42 µg m
-3
). Maximum
values (individual data points) for PM
1
, PM
2.5
and PM
10
were also observed during
the Walk mode. In terms of PM
10
, the maximum recorded was 677 µg m
-3
, while
PM
2.5
and PM
1
reached a maximum of 532 µg m
-3
and 529 µg m
-3
respectively (see
Appendix D.1). The mode with the second highest mean PM concentrations was the
Bus mode, with mean PM
1
, PM
2.5
and PM
10
values of 29 µg m
-3
, 29 µg m
-3
, and 32 µg
m
-3
respectively. The mean concentration levels observed for the MRT and Taxi
mode were very similar and close to the Bus mode, with a minor difference of 1 µg
m
-3
for PM
2.5
. One difference between these two transport modes is the smaller spread
of data for the MRT mode, with SDs of 4 µg m
-3
for the three PM size-fractions
compared to 7 µg m
-3
for the Taxi mode (Table 4-1).
Mean PM values were higher on the four transport modes than at the
background site (Table 4-2). However, only the Walk mode exhibited a relatively
high ratio of ~1.50. The other modes were approximately 1.1 – 1.2 times higher than
BG. As with the mean values presented above, all three size-fractions of PM exhibit
similar patterns across the different transportation modes.
62
Figure 4-2: Boxplots of PM
1
(top), PM
2.5
(middle) and PM
10
concentrations (bottom)
measured during the four transport modes and at the background site (BG) averaged
across the entire dataset. Boxes and thick horizontal line represent the 25
th
to 75
th
percentile (inter-quartile range [IQR]) and median, respectively, triangles are mean
values, vertical lines extend to the highest or lowest value within 1.5 times the IQR, and
diamonds (if present) are outliers beyond that.
0
20
40
60
PM
1
(µg m
-3
)
0
20
40
60
PM
2.5
(µg m
-3
)
0
20
40
60
BG Bus MRT Taxi Walk
Transport mode
PM
10
(µg m
-3
)
63
Comparison with other, similar studies reveals that PM
2.5
values in the
present study are the low end of values found elsewhere. The range observed on the
various transport modes are most similar to those of recent studies in Sydney (Knibbs
and de Dear, 2010) and Barcelona (de Nazelle et al., 2012), with values ranging from
20 – 35 µg m
-3
(see Table 2-2). However, the variability across transport modes
between studies is different. One possible explanation is the ventilation setting of the
vehicles, which will be explained in more detail in Chapter 5.
Ratios of PM
1
to PM
2.5
and PM
2.5
to PM
10
were calculated as a measure of the
proportion of fine to coarse-particles (Table 4-4). The ratios are very high,
demonstrating that fine particles are the dominant component of PM in the Singapore
transport microenvironment. This result is consistent with the close proximity to
vehicular exhaust which emits particles of < 0.1 µm diameter (Lighty et al., 2000).
The ratios at BG are similarly high indicating that that most of the pollution measured
at background was of local origin, since the particles have not had time to grow to
larger sizes in the atmosphere.
Table 4-4: PM
1
/PM
2.5
and PM
2.5
/PM
10
ratios for each transport mode and at the
background site averaged across the entire dataset.
Transport mode PM
1
/PM
2.5
PM
2.5
/ PM
10
Bus 0.99
0.90
MRT 0.99
0.91
Taxi 0.99
0.94
Walk 0.99
0.90
BG 0.99
0.92
T
he Kruskal-Wallis test revealed a statistically significant difference (p <
0.05) between the four modes of transport and the background site for all three size-
fractions of PM (Table 4-3). The results of the multiple-comparisons tests show that
only the Walk mode is significantly different from the other three modes and the
background site for all three size-fractions of PM (Tables 4-5 to 4-7).
64
Table 4-5: Results of multiple-comparisons tests for effect of transport mode on PM
1
concentrations.
BG Bus MRT Taxi Walk
BG
- - - - -
Bus
0.36 - - - -
MRT
1 1 - - -
Taxi
1 1 1 - -
Walk
< 0.05* < 0.05* < 0.05* < 0.05* -
* = p < 0.05
Table 4-6: Same as Table 4-5 but for PM
2.5
.
BG Bus MRT Taxi Walk
BG
- - - - -
Bus
0.38 - - - -
MRT
1 1 - - -
Taxi
1 1 1 - -
Walk
< 0.05* < 0.05* < 0.05* < 0.05* -
* = p <0.05
Table 4-7: Same as Table 4-5 but for PM
10
.
BG Bus MRT Taxi Walk
BG
- - - - -
Bus
0.18 - - - -
MRT
1 1 - - -
Taxi
1 1 1 - -
Walk
< 0.05* < 0.05* < 0.05* < 0.05* -
* = p <0.05
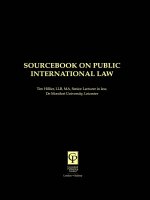
4.1.2 Particle number concentration (PN)
The PN data showed slightly different variability across transport modes compared to
PM (Figure 4-3). The Walk mode exhibited the highest mean concentration (44,490 #
cm
-3
), followed by the Taxi (30,882 # cm
-3
) and Bus modes (28,916 # cm
-3
). The
MRT mode again displays the lowest values with a mean of 14,119 # cm
-3
, which is
even lower than observed at BG (21,289 # cm
-3
). The average concentration
65
experienced for the MRT mode is also fairly consistent with a small standard
deviation (2,625 # cm
-3
). The variability observed for the Taxi mode is considerably
larger than for other transport modes, with a SD of 13,799 # cm
-3
. Both the highest
and lowest PN values recorded during the entire sampling period were also taken on
the Taxi mode (See Appendix D.1).
Figure 4-3: Boxplots of PN measured on the four modes of transport and background
site (BG). For explanation of boxplot symbols see Figure 4-2.
The PN concentrations observed in this study were lower than those reported
for other cities. Mean values ranged from 14,418 # cm
-3
on the MRT mode journeys
to 44,490 # cm
-3
on the Walk mode. In comparison, commonly reported mean PN
concentrations in the literature range from upwards of 30,000 # cm
-3
(see Table 2-2).
de Nazelle et al. (2012) even observed a geometric mean of 117,600 # cm
-3
for car
commutes in Barcelona. In comparison, the present study found a mean of 30,882 #
cm
-3
for the Taxi mode. Only Quiros et al. (2013a) found relatively lower values of
PN in a residential neighbourhood in Santa Monica, USA with concentrations inside
cars as low as 3,120 # cm
-3
with closed windows. The low PN for MRT mode trips is
20
40
60
BG Bus MRT Taxi Walk
Transport mode
PN (10
3
# cm
-3
)
66
consistent with the mean value calculated by Knibbs et al. (2011) for electric-
powered trains.
The Walk mode still displays the greatest difference to background levels,
with a ratio of 2.0 (Table 4-2). This is followed by the Taxi (1.47), Bus (1.32), and
MRT mode (0.6) modes. These results imply a strong influence of vehicular
emissions on UFP levels.
The Kruskal-Wallis test for PN revealed a statistically significant difference
amongst the four transport modes and the background site (p-value < 0.05) (Table
4-3). Unlike the results for PM, the multiple comparisons tests revealed that there was
a statistically significant difference between all transportation modes except between
the Bus and Taxi modes (Table 4-8). The Taxi mode is also the only transport mode
that does not reveal a statistically significant difference from the background site for
PN.
Table 4-8: Results of multiple-comparisons tests for effect of mode on PN concentrations.
BG Bus MRT Taxi Walk
BG
- - - - -
Bus
0.003* - - - -
MRT
<0.00001* <0.00001* - - -
Taxi
0.166 1 <0.00001* - -
Walk
<0.00001* <0.00001* <0.00001* 0.011* -
* = p <0.05
4.1.3 Active surface area (ASA), particle-bound polycyclic aromatic
hydrocarbons (pPAH), pPAH to ASA (PC/DC) ratio, and
diameter of average surface (
D
ave,S
)
The Taxi mode exhibited the highest mean concentrations of ASA at 140 mm
2
m
-3
,
followed by Walk (137 mm
2
mm
-3
), Bus (133 mm
2
m
-3
), and MRT (114 mm
2
m
-3
)
modes (Table 4-1). This differs from the pattern for PM and PN which were observed
to be highest during the Walk mode trips. There was one trip on the Taxi mode that
67
observed an extremely high GM (266 mm
2
m
-3
), which might have raised the mean
value. The Kruskal-Wallis test revealed a statistical significant difference amongst the
four modes (p-value < 0.05) (Table 4-3), and multiple-comparisons tests show that
only MRT mode trips are significantly different from the other three modes (Table
4-9), which are similar as suggested by the great degree of overlap of the inter-
quartile ranges (IQR) (Figure 4-4).
Figure 4-4: Boxplots of ASA measured on the four modes of transport. For explanation
of boxplot symbols see Figure 4-2.
Table 4-9: Results from multiple-comparisons tests for effect of mode on ASA
concentrations.
Bus MRT Taxi Walk
Bus
- - - -
MRT
0.01150* - - -
Taxi
1 0.01720* - -
Walk
1 0.00750* 1 -
* = p <0.05
The trend between transport modes for pPAHs is similar to that of PN
although the range of values for the Walk mode is not much higher than the other
modes (Figure 4-5). The mean values of the Walk, Taxi and Bus modes were fairly
100
150
200
250
Bus MRT Taxi Walk
Transport mode
ASA (mm
2
m
-3
)
68
similar ranging from 79 – 99 ng m
-3
, but the MRT mode exhibited a considerably
lower mean value of 30 ng m
-3
. This was confirmed by the multiple comparisons test
which revealed statistically significant differences between MRT and the other three
transport modes (Table 4-10). This result agrees with present understanding regarding
pPAH formation through incomplete combustion (Ravindra et al., 2008). Since the
MRT is powered by electricity, no major combustion sources were encountered on
MRT mode trips, resulting in low pPAH values. Similar to the ASA data, there was
no statistically significant difference between the Bus, Taxi and Walk modes (Table
4-10).
Figure 4-5: Boxplots of pPAHs measured on the four modes of transport. For
explanation of boxplot symbols see Figure 4-2.
Table 4-10: Results from multiple-comparisons tests for effect of mode on pPAHs
concentrations.
Bus MRT Taxi Walk
Bus
- - - -
MRT
<0.00001* - - -
Taxi
1.00000 <0.00001* - -
Walk
0.07100 <0.00001* 0.19700 -
* = p <0.05
50
100
150
200
Bus MRT Taxi Walk
Transport mode
pPAHs (ng m
-3
)
69
Only few studies have measured ASA and pPAHs in the transport
microenvironment. Velasco et al. (2004) measured pPAHs and ASA concentrations
in different outdoor, indoor, and street environments of Mexico City, Mexico, and
found mean ASA and pPAHs concentrations ranging from 122 – 702 mm
2
m
-3
and 17
– 582 ng m
-3
, respectively in the outdoor environments. The mean ASA
concentrations found in the present study are similar to those found in Mexico City
roads with traffic lights at regular intervals and a mix of vehicle types. Such road
conditions are similar to those found in the present study. The pPAHs values in the
present study are much lower than those observed by Velasco et al. (2004) (average
173 ng m
-3
). A possible explanation is the much lower proportion of diesel-fuelled
vehicles in Singapore’s vehicular fleet (Land Transport Authority, 2014c).
The relationship between pPAHs and ASA has been found to vary depending
on the presence of nuclei mode particles (Bukowiecki et al., 2002). All measured
pPAHs and ASA values were plotted against each other for each of the transport
modes (Figure 4-6). The pattern of the scatter extends along the x-axis, which
suggests the presence of nuclei mode particles, which are typically composed of non-
photoemitting material leading to low pPAHs values (Bukowiecki et al., 2002).
However, this distribution can also be explained by particles that have low surface
concentrations of PAH (Bukowiecki et al., 2002). The low r
2
values suggest a wide
range of particles sampled in terms of surface chemistry suggesting that particles
measured in the present study are a mix of freshly emitted and aged particles. Strong
relationships were not observed because complete trips encompassed both indoor and
outdoor environments which are influenced by and have varying proximity to
combustion sources. More useful is the analysis of the pPAHs and ASA relationship
in outdoor route sections which directly experience emissions from combustion
sources, which is presented in Section 4.2.
70
The mean PC/DC ratios for the three on-road transport modes are fairly low,
ranging from 0.59 – 0.74 ng mm
-2
(Table 4-11). These values are slightly higher
compared to those measured by Ott and Siegmann (2006) on an arterial highway in
California, USA, (mean: 0.42 – 0.58 ng mm
-2
) and by Velasco et al. (2004) on roads
in Mexico City (0.53 ng mm
-2
). The ratio is lowest on the underground MRT trips at
0.27 ng mm
-2
, which can be explained by the lack of combustion sources leading to
extremely low pPAHs values.
Figure 4-6: Correlation between pPAHs and ASA for the entire dataset for each
transport mode.
y 78 0.097x,r
2
=0.025 y 29 0.025x ,r
2
=0.022
y 50 0.31x,r
2
=0.129 y 101 0.14x,r
2
=0.0202
Bus MRT
Taxi Walk
0
500
1000
1500
0
500
1000
1500
0 250 500 750 0 250 500 750
ASA (mm
2
m
-3
)
pPAHs (ng m
-3
)
71
Table 4-11: Mean (SD) PC/DC ratio and D
ave,S
for four transport modes. (N = 23 for Bus,
Taxi, and MRT, N = 22 for Walk)
Transport mode
PC/DC (ng mm
-2
) D
ave,S
(nm)
Bus 0.59
38.65
MRT
a
0.27
50.54
Taxi 0.59
39.30
Walk 0.74
31.28
a
D
ave,S
values may not be representative due to the lack of
combustion sources in indoor areas.
In addition to exhibiting the highest PM, PN and pPAH concentrations, the
Walk mode also exhibits the smallest D
ave,S
of 31.28 nm. This is followed by the Bus
(38.65 nm) and Taxi modes (39.30 nm). The largest average particle diameter of
50.54 nm is observed on the MRT mode; however, this value may be an
underestimation due to the lack of combustion sources during MRT mode trips
(Bukowiecki et al., 2002). The D
ave,S
indicates the approximate age of particles. Based
on the results, the Walk (MRT) mode experiences the largest (smallest) amount of
freshly emitted particles.
Following the work by Bukowiecki et al. (2002), the PC/DC ratio and D
ave,S
were also plotted against each other (Figure 4-7). Combined with PN concentrations,
the distribution of points in these plots can indicate the presence of: (i) nuclei mode
particles (low pPAH, low or high ASA, and high PN), (ii) accumulation mode
particles (high pPAH, high ASA, and low or high PN), or (iii) accumulation mode
particles that are covered in a layer of chemicals not measured by the PAS sensor
(low pPAH, low or high ASA, and low PN) (Bukowiecki et al., 2002). Along with the
plots in Figure 4-6, the clustering of points close to the origin in Figure 4-7 indicates
the presence of a nuclei mode in the observations, suggesting the strong influence of
freshly emitted particles. Data for the MRT mode are also presented. However, as
noted above, the interpretation of these results must be done carefully since the
majority of the particles are unlikely to be emitted from combustion sources.
72
Figure 4-7: PC/DC ratio versus D
ave,S
for each transport mode.
4.1.4 Black carbon (BC)
Like for other pollutant metrics, the Walk mode exhibits the highest mean BC
concentrations while the MRT mode exhibits the lowest (Figure 4-8). The mean
values for the Bus and Taxi modes are very similar (Bus: 4.416 µg m
-3
and Taxi:
4.368 µg m
-3
). Although similar to the PM and PN data, statistical testing revealed a
significant difference between BC measured on the Walk mode and the three
vehicular transport modes (Table 4-12). The Bus and MRT modes do not appear to be
significantly different from the Taxi mode.
Bus MRT
Taxi Walk
0
50
100
150
0
50
100
150
0 50 100 150 200 0 50 100 150 200
D
av e,S
(nm)
PC/DC (ng mm
-2
)
73
Figure 4-8: Boxplots of BC measured on the four modes of transport. For explanation of
boxplot symbols see Figure 4-2.
Table 4-12: Results from multiple-comparisons tests for effect of mode on BC
concentrations.
Bus MRT Taxi Walk
Bus
- - - -
MRT
0.01720* - - -
Taxi
1.00000 0.22840 - -
Walk
0.00890* <0.00001* 0.00620* -
* = p <0.05
Concentrations of BC and the other pollutant metrics were also compared
against each other (Table 4-13). Since BC is a good indicator of vehicular activity,
the strength of the correlation can indicate if vehicle traffic is the predominant source
of the pollutants. The highest correlation was found between BC and pPAHs on the
Walk mode (Spearman correlation 0.58). Both CO and ASA were also found to be
poorly correlated with BC regardless of transport mode (CO: -0.03 – 0.02 and ASA:
0.07 – 0.14), which could point to different control processes between these
pollutants. Additionally, the low correlations suggest that CO is not a suitable tracer
for vehicle activity in Singapore. All three size-fractions of PM appear to be
0
5
10
15
20
Bus MRT Taxi Walk
Transport mode
BC (µg m
-3
)
74
moderately well correlated with BC (0.34 – 0.46) except on the MRT mode, again
likely due to the different emission sources in subways. Particle number
concentrations were fairly well correlated with BC on the Bus and Walk modes (0.43
and 0.41, respectively), but only moderately correlated for the MRT and Taxi modes
(0.29 and 0.26, respectively). The correlations in the present study are similar to those
found by de Nazelle et al. (2012) (PN: 0.30, PM
2.5
: 0.39). They suggested that the low
correlations observed are due to the presence of different vehicle types which emit
different proportions of pollutants. For example, BC is emitted primarily from diesel-
fuelled vehicles, whilst CO and UFPs may be predominantly emitted by gasoline-
fuelled vehicles (de Nazelle et al., 2012).
Table 4-13: Results of Spearman rank correlation between BC and other metrics on the
four transport modes.
Mode PM
1
PM
2.5
PM
10
PN ASA pPAHs CO
Bus 0.38
0.38
0.34
0.43
0.12
0.35
-0.03
MRT 0.18
0.17
0.15
0.29
0.07
0.28
-0.11
Taxi 0.36
0.36
0.34
0.26
0.14
0.31
-0.11
Walk 0.46
0.46
0.45
0.41
0.07
0.58
0.02
Generally, stronger correlations were found on the Walk mode (Table 4-13).
Poorer correlations were found between BC and pollutants on the MRT mode (-0.11
– 0.29) indicating that traffic emissions are not the dominant sources of particles for
MRT commutes. This is expected given the lack of fossil fuel combustion sources
throughout MRT mode trips. Correlations for Bus and Taxi modes are very similar
except in terms of PN, possibly highlighting the similar mix of emission sources
encountered on these two modes of transport.
75
4.1.5 Carbon monoxide
The mean concentration levels for CO were extremely low across all modes of
transport and at the background site, ranging from 0.5 ppm on the MRT mode to 1.0
ppm on the Taxi mode (Table 4-1). These values are comparable to those observed in
London (Kaur et al., 2005b) and Barcelona (de Nazelle et al., 2012) (see Table 2-2).
However, there is great variation in the measurements, with many outliers (Figure
4-9), and the corresponding SDs are of similar magnitude as the mean values (Table
4-1). As described in the data quality section in Chapter 3, approximately 17% of data
from the CO measurer were reported as zero values and removed from analysis under
the assumption that the concentrations fell below the sensor detection limits. This
might have introduced a stronger positive skew into the data.
Mean CO concentrations experienced on the Bus, MRT and Walk modes are
low compared to the background site (0.88, 0.53, and 0.69, respectively). Only the
Taxi mode exhibited marginally higher CO levels, with a ratio of 1.09. These low
readings across the transport modes suggest that Singapore has managed to curb CO
emissions from vehicles as recommended by the 1970 WHO report for Singapore
(See Chapter 1 for details).
The results from the multiple comparisons tests indicate a statistically
significant difference between the MRT and the three other transport modes, as well
as between the Taxi and Walk modes (Table 4-14). There was no statistically
significant difference between data measured at the background site and on the four
different modes of transport.
76
Figure 4-9: Boxplots of CO measured on the four modes of transport and at the
background site. For explanation of boxplot symbols see Figure 4-2.
Table 4-14: Results from multiple-comparisons test for effect of mode on CO
concentrations
Background Bus MRT Taxi Walk
Background
- - - - -
Bus
1 - - - -
MRT
1 0.0082* - - -
Taxi
0.5339 1 0.003* - -
Walk
1 0.0628 0.0430* 0.0314* -
* = p <0.05
4.2 Spatial variation within transport modes
As described in Chapter 3, the door-to-door routes for each transport mode were split
into several sections for a more detailed analysis of the particle pollution to which
commuters are exposed. Different amounts of time were spent within the different in-
vehicle, indoor, and outdoor spaces depending on the transport mode (Table 4-15).
Average durations for an entire journey on each mode of transport were 14.6 (Bus),
14.3 (MRT), 18 (Taxi), and 25.8 (Walk) minutes, respectively. This, combined with
variations in pollutant concentrations measured in each section, most likely
contributed to the trends in exposure described in Section 4.1.
0
1
2
3
4
BG Bus MRT Taxi Walk
Transport mode
CO (ppm)
77
The following sections describe the spatial variation of pollutant
concentrations observed on Bus, MRT, Taxi, and Walk mode journeys in greater
detail. In addition to descriptive statistics, time-series plots and maps of PM
2.5
and PN
concentrations of one trip are presented to better visualise the spatial variability. The
trips most representative across all measurements for each transport mode are used as
examples.
Table 4-15: Mean time spent in each section for all measurements presented in minutes
and percentage of overall trip.
Sections Time spent
a
(min)
Time spent
a
(%)
Bus
In-vehicle
Bus 6.6
45.6
Indoor
Mall 0.9
6.6
Underpass 2.3
16.3
Outdoor
Bus-stop 1.2
8.0
Sidewalk 3.6
23.8
MRT
In-vehicle
Train 4.1
28.9
Indoor
Mall 1.5
10.2
Platform 2.6
17.9
Station 4.6
32.3
Outdoor
Sidewalk 1.5
10.7
Taxi
In-vehicle
Taxi 7.6
43.5
Indoor
Mall 0.9
5.0
Outdoor
Sidewalk 4.2
24.3
Taxi-stand 5.3
27.3
Walk
Outdoor
Sidewalk 25.8
100.0
a
Values rounded off to nearest decimal place.
78
4.2.1 Bus
The spatial variation of PM
2.5
and PN concentrations for a door-to-door trip on the
Bus mode on 10 June 2013 is shown in Figures 4-10 and 4-11. Clear differences are
visible in different sections of the trip, although the patterns for PM
2.5
and PN are
slightly different. There is a noticeable increase in PM
2.5
concentration towards the
Underpass section, however there is no corresponding rise in PN except for a large
spike halfway through the Underpass (Figure 4-10). The effect of opening and closing
bus doors can be observed in the increases followed by a gradual decline of PN
concentrations inside the Bus. Similar jumps in PM
2.5
concentrations were less
distinct.
Figure 4-10: Time-series of PM
2.5
and PN concentrations during the Bus mode trip on 10
June 2013. Vertical dashed lines delineate the different sections of the trip. Periodic
increases in PN were observed within the Bus section when the bus opened its doors to
drop off and pick up passengers.
Sidewalk Mall Underpass
Sidewalk/
Bus-stop
Bus Sidewalk
0
40
80
120
160
PM
2.5
(µg m
-3
)
Sidewalk Mall Underpass
Sidewalk/
Bus-stop
Bus Sidewalk
0
50
100
150
18:38 18:40 18:42 18:44 18:46 18:48 18:50
Local Time
PN (10
3
# cm
-3
)
79
Figure 4-11: Spatial variation of PM
2.5
(top) and PN (bottom) concentrations during the
Bus mode trip on 10 June 2013.
80
Mean PM
1
, PM
2.5
, PM
10
, and PN concentrations measured in the five sections
of Bus mode trips were slightly higher than at the background site, with outdoor
sections (Bus-stop and Sidewalk) exhibiting much higher mean concentrations
(Figure 4-12). Except for concentrations inside the Bus, CO concentrations in the
other sections were lower than at the background site as well (Figure 4-12). This
agrees with the trip-averaged results described in Section 4.1.
Across the various sections of the Bus mode route, the Bus section exhibits
the smallest mean values for PM
1
, PM
2.5
, PM
10
, and ASA (Table 4-16). However, in-
vehicle CO concentrations, as well as the PM
2.5
/PM
10
and PC/DC ratios were elevated
compared to the other sections (Table 4-16 and Table 4-17). This might be due to the
regular introduction of freshly emitted particles into the vehicle when bus doors open
and close to pick up passengers, which is illustrated in Figure 4-10.
The indoor locations of the Mall and Underpass generally observed lower
values of PN and pPAHs, and correspondingly smaller (larger) PC/DC (D
ave,S
) (Figure
4-12 and Table 4-17). However, despite having the lowest mean PN concentrations,
the Underpass exhibited the highest mean concentrations of PM
1
, PM
2.5
, and PM
10
(40,
40, and 50 µg m
-3
, respectively) (Table 4-16). The ratio of PM
2.5
/PM
10
is also lowest
in the Underpass, with a value of 0.80. Taken together, this indicates a larger
proportion of coarse particles, and a smaller amount of UFPs than in the other
sections of Bus mode trips.
81
Figure 4-12: Boxplots of 8 pollutant metrics in different sections of the Bus mode trips.
For explanation of boxplot symbols see Figure 4-2. Mean background site concentrations,
where available, are indicated as dashed line on the respective panel.
0
20
40
60
80
PM
1
(µg m
-3
)
0
20
40
60
80
PM
2.5
(µg m
-3
)
0
20
40
60
80
PM
10
(µg m
-3
)
0
20
40
60
80
PN (10
3
# cm
-3
)
0
100
200
300
400
ASA (mm
2
m
-3
)
100
200
300
pPAHs (ng m
-3
)
0
5
10
15
20
25
B
u
s
M
a
l
l
U
n
d
e
r
p
a
s
s
B
u
s
-s
t
o
p
S
i
d
e
w
a
l
k
Sections
BC (µg m
-3
)
0
1
2
3
4
B
u
s
M
a
l
l
U
n
d
e
r
p
a
s
s
B
u
s
-s
t
o
p
S
i
d
e
w
a
l
k
Sections
CO (ppm)