A numerical study on flapping of a flexible foil
Bạn đang xem bản rút gọn của tài liệu. Xem và tải ngay bản đầy đủ của tài liệu tại đây (3.83 MB, 100 trang )
A NUMERICAL STUDY ON FLAPPING
OF A FLEXIBLE FOIL
THIBAUT FRANCIS BOURLET
(B.Sc. in Mechanical Engineering, ENSTA ParisTech)
A THESIS SUBMITTED FOR THE DEGREE OF MASTER OF
ENGINEERING
DEPARTMENT OF MECHANICAL ENGINEERING
National University of Singapore
2015
Declaration of Authorsh i p
I hereby declare that this thesis is my original work and it has been written by
me in its entirety. I have duly acknowledged all the sources of information which
have been used in the thesis. This thesis has also not been submitted for any
degree in any university previously.
Signed: Thibau t Francis Bourlet
Date: 12/05/2015
1
Acknowledgements
I wish to express my deep gratitude and appreciation to my supervisor, Pro-
fessor Jaiman for his valuable gu idance, continuous support and encouragement
throughout the tenure. He has provided me with valuable suggestions from the
development of my research to the publication of my work and writing of this
thesis.
I also wish to extend my sincere thanks to Pardha Saradhi Gurugubelli Venkata,
PhD student in the Department of Mechanical E ngineering, NUS, for his str on g
support, helpful d iscussions and friendship.
I would also like to thank my family and all my fr iends at NUS for their support.
2
Contents
Declaration of Authorship 1
Acknowledgements 2
Contents 3
Summary 5
List of Tables 6
List of Figures 7
Abbreviations 10
Symbols 11
1 Introduction 15
1.1 Background and motivation . . . . . . . . . . . . . . . . . . . . . 15
1.2 Objectives . . . . . . . . . . . . . . . . . . . . . . . . . . . . . . . 17
1.3 Organization of the thesis . . . . . . . . . . . . . . . . . . . . . . 18
2 Literature review 19
2.1 Kinematics of a flexible foil in an axial flow . . . . . . . . . . . . 19
2.2 Stability analyses . . . . . . . . . . . . . . . . . . . . . . . . . . . 21
2.3 Traveling waves . . . . . . . . . . . . . . . . . . . . . . . . . . . . 24
2.4 Drag reduction through vorticity control . . . . . . . . . . . . . . 25
3 Boundary layer development and traveling wave mechanisms 29
3.1 Problem statement . . . . . . . . . . . . . . . . . . . . . . . . . . 29
3.2 Numerical methodology . . . . . . . . . . . . . . . . . . . . . . . 31
3
3.3 Numerical verification an d convergence . . . . . . . . . . . . . . . 34
3.4 Boundary layer development during fl ap ping . . . . . . . . . . . . 38
3.4.1 Velocity profile . . . . . . . . . . . . . . . . . . . . . . . . 38
3.4.2 Boundary layer thickness . . . . . . . . . . . . . . . . . . 45
3.4.2.1 Displacement and momentum thicknesses . . . . 45
3.4.2.2 Proposition of two new quantities: the variability
thicknesses . . . . . . . . . . . . . . . . . . . . . 47
3.4.3 Skin friction and tension effects . . . . . . . . . . . . . . . 51
3.4.4 Influence of the R eynolds number on the boundary layer
thickness . . . . . . . . . . . . . . . . . . . . . . . . . . . 53
4 Traveling waves along the fla pping foil 58
4.1 Complex Empirical Orthogonal Functions . . . . . . . . . . . . . 59
4.1.1 Introduction to CEOF . . . . . . . . . . . . . . . . . . . . 59
4.1.2 Results and discussion . . . . . . . . . . . . . . . . . . . . 64
4.1.3 Influence of the Reynolds numb er on the traveling waves . 68
4.2 Method of space-time spectral analys is . . . . . . . . . . . . . . . 70
4.2.1 Introduction to space-time power spectrum analysis . . . 70
4.2.2 Analysis of traveling wave packets . . . . . . . . . . . . . 72
4.3 Comparison between CEOF and STPS analyses . . . . . . . . . . 73
5 Conclusion and recommendations for future work 76
List of publications 84
A Matlab codes 85
A.1 Analysis of traveling wave packets . . . . . . . . . . . . . . . . . 85
A.1.1 Complex E mpirical O rthogonal Functions for the pressure
field . . . . . . . . . . . . . . . . . . . . . . . . . . . . . . 85
A.1.2 Space-Time Power Spectrum for the orientation angle . . 95
4
NATIONAL UNIVERSITY OF SINGAPORE
Summary
Department of Mechanical Engineering
A NUMERICAL STUDY ON FLAPPING OF A FLEXIBLE FOIL
by THIBAUT FRANCIS BOURLET
A numerical study of the self-induced flapping motion of a flexible cantilevered
foil in a uniform axial flow is presented. A high-order fluid-structure solver based
on fully coup led Navier-Stokes and non-linear structural dynamics equations is
employed. The evolution of the unsteady laminar boundary layer is investigated
and three phases in its periodical development along the flapping foil are iden-
tified, based on the Blasiu s scale, η, namely: (i) uniformly decelerating; (ii)
accelerating upper boundary layer and (iii) mixed accelerating and deceler at-
ing. Consequently, the spatial distribution of the boundary layer is studied and
boundary layer regimes are map ped out in a phase diagram spanned by the La-
grangian abscissa s and nondimensional time
¯
t. Th e boundary layer is thus fully
characterized based on the tip displacement of the foil. Ind uced ten sion within
the foil is shown to be dominated by pr essure effects and only marginally affected
by skin f riction. The boundary layer thickness is analyzed through the temporal
and spatial evolutions of the displacement and momentum thicknesses. Finally,
the traveling mechanisms of kinematic and dynamic data along the foil are inves-
tigated using Complex Empirical Orthogon al Functions and Space-Time Power
Spectrum analyses. From the study of the flapping r egimes, the co-existence
of direct kinematic waves traveling downstream along the str ucture as well as
reverse dynamic waves traveling in the opposite direction to the axial flow are
reported.
5
List of Tables
3.1 Domain size convergence study with Re = 500, µ = 0.125 and
K
B
= 0.0001. . . . . . . . . . . . . . . . . . . . . . . . . . . . . . 35
3.2 Grid convergence study with parameters Re = 500, µ = 0.125 and
K
B
= 0.0001. . . . . . . . . . . . . . . . . . . . . . . . . . . . . . 36
3.3 Numerical comparison against Connell and Yue [1] results at Re =
1000 and K
B
= 0.0001. . . . . . . . . . . . . . . . . . . . . . . . . 37
3.4 Comparison between our numerical results and Blasius’ theoreti-
cal displacement and momentum thicknesses δ
B
and θ
B
at Re =
500 and µ = 0.125. . . . . . . . . . . . . . . . . . . . . . . . . . . 47
4.1 Angular frequencies ω, wavenumbers k and phase sp eeds c of the
orientation angle α and pressure p as a function of the Reynolds
number Re with a constant mass ratio µ = 0.1. . . . . . . . . . . 69
6
List of Figures
1.1 Conceptual sketch an d realization of the “p iezo-tree” generator,
based on Dickson [2]. . . . . . . . . . . . . . . . . . . . . . . . . . 17
2.1 Schematic of the different flapping regimes with qualitative vor-
ticity contours. . . . . . . . . . . . . . . . . . . . . . . . . . . . . 21
2.2 Reynolds number and mass ratio stability phase diagram for K
B
=
0.0001. Rendering courtesy of P. S. Gurugubelli. . . . . . . . . . 22
2.3 Flapping frequency and amplitude of the filament as a function of
its length. a, Flapping frequency; b, amplitude. Figure extracted
from Zhang et al. [3]. . . . . . . . . . . . . . . . . . . . . . . . . . 23
2.4 Comparison of the topology of th e BvK and iBvK wakes. . . . . 26
2.5 Strouhal number of observed fish and cetaceans compared with the
theoretical optimal range. Figure extracted from Triantafyllou et
al. [4]. . . . . . . . . . . . . . . . . . . . . . . . . . . . . . . . . . 28
3.1 Boundary layer and vortex shedding behind the foil with the de-
scription of the coordinate system attached to the structure. Here,
s denotes the Lagrangian coord inate and α is the orientation angle
of th e foil. . . . . . . . . . . . . . . . . . . . . . . . . . . . . . . 30
3.2 Computational domain with details of the boundary conditions. . 35
3.3 Overview of the M2 grid, a P
2
/P
1
/P
2
iso-parametric finite element
mesh, with 32,932 nod es and 16,348 elements: (a) full domain; (b)
close-up view of the mesh surrounding the foil. . . . . . . . . . . 37
3.4 Representative kinematics of the foil: (a) evolution of the foil
position between
¯
t = 0 and 0.9), where
¯
t denotes the non dimen-
sional time; (b) vibration mode of the structure, for Re = 500
and µ = 0.125. The oscillation mode exhibits three nodes at
s ≈ 0.33, 0.61 an d 0.87 which is associated with a mod e 4 vibration. 39
3.5 Temporal evolution of the vorticity contours over a period of os-
cillation for Re = 500 and µ = 0.125. The wake is formed by
pairs of alternating s ign vortices (2S vortex mode). . . . . . . . . 40
7
3.6 Velocity over a full oscillation in com parison with the Blasius clas-
sical laminar boundary layer for 0 ≤ η ≤ 10 (left) and 5 ≤ η ≤ 45
(right) at s = 0.75 for Re = 500 and µ = 0.125. Here, u
f
t
rep-
resents the local tangential velocity and η is the nondim ensional
normal distance to the foil. . . . . . . . . . . . . . . . . . . . . . 43
3.7 Nondimensional local power transfer from the structure to the
fluid P at s = 0.25, 0.5 and 0.75 for Re = 500 and µ = 0.125. . . 44
3.8 Phase difference between the velocity profi le at the considered
Lagrangian abs cissa s and the reference velocity profile at s = 0.75. 44
3.9 Phase diagram of the boundary layer regim es regions s panned by
the nondimensional time
¯
t and Lagrangian abscissa s. Points de-
note trans itions from one regime to another in our simulations.
(I) , (II) an d (III) correspond to the uniformly decelerating, ac-
celerating upp er boundary layer and mixed accelerating and decel-
erating phases of the development of the boundary layer, respec-
tively. The slope of the frontier lines is equ al to the oscillation
frequency of the foil f ≈ 0.7. . . . . . . . . . . . . . . . . . . . . 45
3.10 Displacement and momentu m thicknesses at s = 0.25, 0.5 and 0.75
over a full oscillation for Re = 500 and µ = 0.125. . . . . . . . . . 46
3.11 Velocity vector variations for Re = 500 and µ = 0.125. For clar-
ity, grid points do not reflect the actual mesh bu t are interpolated
values. . . . . . . . . . . . . . . . . . . . . . . . . . . . . . . . . . 48
3.12 Displacement variability thickness δ
+
and momentum variability
thickness θ
+
at s = 0.25, 0.5 an d 0.75 over a full oscillation for
Re = 500 and µ = 0.125. . . . . . . . . . . . . . . . . . . . . . . . 50
3.13 Variation of the friction coefficient C
f
for Re = 500 and µ = 0.125
along the top surface of the foil. The Blasius profile (solid line)
is provided for reference. For clarity, symbols represent sample
locations along the str ucture. . . . . . . . . . . . . . . . . . . . . 52
3.14 Evolution of the distribution of the nondimensional tension T
within the foil over an oscillation for Re = 500 and µ = 0.1.
The mean tension (solid line) is given as a reference. . . . . . . . 54
3.15 Dependence of the mean displacement thickness
¯
δ
∗
at a mass ratio
µ = 0.1, with (a) the Reynolds number and (b) the Lagrangian
abscissa. . . . . . . . . . . . . . . . . . . . . . . . . . . . . . . . 56
3.16 Dependence of the mean displacement variability thickness
¯
δ
+
at
µ = 0.1 with (a) the Reynolds number and (b) the Lagrangian
abscissa. . . . . . . . . . . . . . . . . . . . . . . . . . . . . . . . . 57
4.1 Pressure contours over three periods of oscillation (
¯
t on the x-axis)
and along the plate (Lagrangian abscissa s on the y-axis) for (a)
Re = 600 and (b) Re = 1000 at µ = 0.1. High pressure zones are
represented in white whereas low pressure ones are black. . . . . 60
8
4.2 CEOF phase data of the first mode of orientation α: spatial phase
θ
1
(left-hand side) and temporal phase φ
1
(right-hand side) for
Re = 1000, and µ = 0.1. The upward linear trend of the spatial
phase indicates the propagation of pressure waves along the foil. 65
4.3 Eigenvalues of the auto-correlation matrix of the pressure signal
on top of the foil for Re = 1000 and µ = 0.1. Only the three first
eigenvalues account for more than 1% of the total energy. . . . . 66
4.4 Spatial (left-hand side) and temporal (right-hand side) phases θ
and φ obtained from the CEOF decomposition of the pressu re
along the top edge of the foil: at µ = 0.1, (a) Re = 700 and (b)
Re = 1000. . . . . . . . . . . . . . . . . . . . . . . . . . . . . . . 67
4.5 Spatial (left) and temporal (right) amplitudes of the first and sec-
ond pressure modes for Re = 700 and µ = 0.1. . . . . . . . . . . . 68
4.6 Spatial phases of the three first mod es of norm al elastic forces
along the foil, at µ = 0.1, (a) Re = 700 and (b) Re = 1000. All
curves are downward slopping, indicating waves traveling upstream. 70
4.7 Contour plots of the relative space-time power spectra of the orien-
tation angle, pressure field and normal elastic forces for Re = 600
(left) and 1000 (right). Negative wavenumbers depict waves trav-
eling in the opposite direction to the flow. . . . . . . . . . . . . . 73
9
Abbreviations
FSI Fluid Structure Interactions
CFEI Coupled Field with Explicit Interface
BvK B´enard-von K´arm´an
iBvK inverted B´enard-von K´arm´an
ALE Arbitrary Lagrangian Eulerian
EOF Empirical Orthogonal Functions
CEOF Complex Empirical Orthogonal Fu nctions
STPS Space-Time Power Sp ectrum
10
Symbols
Fluid symbols
ρ
f
density of the fluid
µ
f
dynamic viscosity
Ω
f
fluid domain
Γ
f
n
fluid Neumann boundaries
σ
f
fluid stress tensor
u
f
fluid velocity
φ
f
fluid velocity test function
U
0
free-stream velocity
ν kinematic viscosity
q pressure test function
U
∞
tangential component of the free-stream velocity
f
f
volumic forces acting on the fluid
Solid symbols
ρ
s
density of the solid
s Lagrangian abscissa along the foil
L length of the foil
y
s
normal coordinate to the foil
n
s
normal to the foil at the Lagrangian abscissa s
α orientation angle
11
˙α orientation angle rate
I second moment of area
Ω
s
solid domain
Γ
s
n
solid Neumann boundaries
σ
s
solid stress tensor
u
s
structural velocity
φ
s
structural velocity test function
t
s
tangent to the foil at the Lagrangian abscissa s
x
s
tangential coordinate to the foil
h thickness of the foil
f
s
volumic forces acting on the structure
E Young’s modu lus
Kinematics and dynamics symbols
ω
n
angular frequency of the n
th
mode
K
B
bending rigidity
η Blasius boundary layer variable
δ
B
Blasius’ displacement thickness
θ
B
Blasius’ momentum thickness
¯
t dimensionless time based on the tip displacement
δ
∗
displacement thickness
C
d
drag coefficient
λ
n
eigenvalue of the n
th
mode
f frequency
C
f
friction coefficient
C
l
lift coefficient
µ mass ratio
w mesh velocity
θ momentum thickness
12
A peak-to-peak amplitude
c
n
phase speed of the n
th
mode
T period of oscillation
Re Reynolds number
S
n
spatial amplitude
θ
n
spatial phase
St Strouhal number
P structure-to-fluid power transfer
R
n
temporal amplitude
φ
n
temporal phase
T tension
t time
δ
+
variability displacement thickness
θ
+
variability momentum thickness
k
n
wavenumber of the n
th
mode
13
To my mother and grandmother
14
Chapter 1
Introduction
1.1 Background and motivation
Fluid-structure interactions (FSI) happen when a flow induces a solid to move,
which consequ ently affects the flow back, and so on. These interplays result in
a sys tem where the dy namics of the fluid and those of the solid are coupled. We
experience fluid-structure interactions in our everyday lives. For instance, we all
have observed the waving of a flag und er a soft br eeze or the chaotic motion of a
loose garden hose. T he mech an isms at play here are similar: a fluid (air or water)
and a solid (a flag or a hose) interact with each other, which results in complex
motion patter ns. This type of phenomenon is difficult to model numerically for
two reasons. First, the procedure for coupling the fluid motion and that of the
structure –such as loosely or s trongly coupled solvers – may affect the results.
Second, as the structure deforms so does the fluid and solid meshes. Thus they
need to be reevaluated at each time step to ensure conformity at the interface.
However, numerical procedures for th e study of FSI problems have seen great
improvements in the recent years.
15
Chapter 1. Introduction
In this work, we focus on a canonical and a priori simple FSI problem: the
flapping motion of a plate in a uniform axial flow. We consider the case where
the flexible foil is attached at the leading edge but left free to oscillate at the
trailing edge. For a s ufficiently high flow speed, the structure experiences self-
sustained oscillations. This problem has b een extensively studied in the last
two decades. Most studies have aimed at characterizing the resulting motion of
the plate and predicting the critical flow velocity beyond which flapping occurs.
However, little attention has been given to the boundary layer development in
the vicinity of the foil. The changing wall curvature induces varying boundary
conditions which affect the boundary layer. Since the boundary layer connects
the structural displacement to the uniform outer flow, it is of paramount impor-
tance in FSI problems. Its dynamics reflect in integrals quantities, such as the
drag coefficient or tension, that characterize the resulting influence of velocity
and pressure gradients. Therefore, a clear understanding of the boundary layer
development is key to the full comprehension of FSI problems.
Applications of this FSI problem include the implementation of new surgical
methods [5], th e increase of the speed of paper printing [6, 7], nuclear plate
assemblies [8] and flow control devices [9, 10]. It has also been proposed as a
means to harvest energy, which can be utilized to generate electric energy [11,
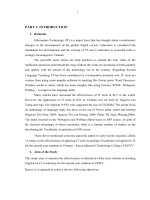
12]. For in stance, a team at Cornell University recently designed a wind energy
harvesting device ”Piezo-Leaf Generator” using flexible piezoelectric materials
[13]. This tree-looking device, see Figure 1.1, would allow to extract energy from
the wind around our buildings and other living areas with acceptably low visual
pollution. In brief, the universality of the problem studied allows for useful
applications in numerous domains.
16
Chapter 1. Introduction
Figure 1.1: Conceptual sketch and realization of the “piezo-tree” generator,
based on Dickson [2].
1.2 Objectives
The objective of this study is to investigate the infl uence of the flapping motion
of the foil on the spatial and temporal development of the boundary layer and
its related quantities.
To do so, we adopt a high-order fluid-structure interaction solver based on the
Coupled Field with Explicit Interface (CFEI) formulation, pr oposed in [14] to
perform direct numerical simulations. This solver captures the non-linearities
of the problem coming from the Navier-Stokes equation and the geometrically
nonlinear structural dynamics.
The space-time variations of the boundary layer are exhibited and analyzed.
17
Chapter 1. Introduction
Their implications on related quantities such as skin friction and tension waves
are discussed. Eventually, direct and reverse traveling features are identified.
1.3 Organization of the thesis
The content of the thesis is organized as follows: Chapter 2 is a literature review
on the problem of a flapping foil in a uniform axial flow. Chapter 3 presents
our results on boundary layer development and Chapter 4 is an analysis of the
traveling features that develop on th e foil during the flapping regime.
18
Chapter 2
Literature review
In this section, the present state of the literature on flapping dynamics of a
flexible foil is broadly pr esented.
2.1 Kinematics of a flexible foil in an axial flow
The problem of a fl exib le foil with its leading edge clamped and trailing edge
left free to oscillate has been studied extensively in the two past decades. A
fluid-elastic instability can arise and manifests itself as a self-sustained flapping
motion of th e structure when a flow stream passes over the body surface, leaves
the trailing edge and goes into the wake [1]. This phenomenon includes complex
dynamical effects such as relative fluid-structural inertial effects, vorticity gen-
eration along the foil surface, vortex shedding emanating at the trailing edge,
restoring effects due to the bending rigidity and variable flow-indu ced tens ion
along the foil. Restricting ourselves to the case of high extensional rigidity, the
main parameters of the problem are the Reynolds number, the structure-to-fluid
19
Chapter 2. Literature review
mass ratio µ an d the bending rigidity K
B
, given, respectively, by
Re =
U
0
L
ν
, µ =
ρ
s
h
ρ
f
L
, K
B
=
EI
ρ
f
U
2
0
L
3
, (2.1)
for a two-dimensional body of length L, thickness h, density ρ
s
and flexural
rigidity EI, in a flu id flow of density ρ
f
, free stream velocity U
0
and kinematic
viscosity ν. As usual, the Reynolds number measures the relative influence
of inertial effects against viscous effects. The mass ratio gauges the relative
influence of each medium, solid or fluid, in the inertial balance of the system.
The bending rigidity characterizes the flexibility of the structure: a low K
B
is
tantamount to a high flexibility of the structure. For example, a light flag waving
in a gentle breeze will have a Reynolds number of order 10
5
, a mass ratio of order
1 and a bending rigidity in the range [10
−4
, 10
−3
].
One of the first researcher to experim entally describe the various oscillatory
patterns that a flag undergoes was Taneda in 1968 [15]. He observed nodeless,
one-node and two-node oscillations of flags made of different materials such as
silk, muslin, flannel, blanked and canvas. The wide array of materials used in
this study allowed for different bending rigidities and mass ratios. Recently,
numerical simulation s of Connell et al. [1] and Lui et al. [14] exhibited three
distinct flapping regimes depending on the parameters of the problem: (i) fixed -
point stable; (ii) limit-cycle flapping; and (iii) chaotic flapping. A sch ematic of
these three regimes with vor ticity contours is given in Figure 2.1. In the fixed-
point stable regime, the foil remains straight and does not seem to be affected
by the sur rounding flow. The wake results in a steady velocity deficit, just
as in a rigid plate experiment. On the contrary, it oscillates periodically–in a
traveling wave-like manner–in the limit-cycle flapping regime. In this regime,
the wake exhibits a typical B´enard-von K´arm´an vortex street associated with
drag production and the power spectrum shows a distinct peak for the frequency
20
Chapter 2. Literature review
Limit-cycle flapping
Chaotic flapping
Fixed-point stability
Figure 2.1: Schematic of the different flapping regimes with qualitative vor-
ticity co ntours.
of oscillation. Eventually, when the flow velocity exceeds a certain thr eshold,
these oscillations become chaotic and cannot be predicted. The resulting power
spectrum exhibits multiple frequencies and the wake pattern is irregular. Strong
vortex pairs are distributed away from the wake centerline during intermittent
violent snapping events, characterized by rapid changes in tens ion and dynamic
buckling.
2.2 Stability analyses
A large attention has been given to the p roblem of predicting the on set of the
limit-cycle flappin g regime. In concrete terms, researchers have tried to derive a
critical flow velocity U
cr
or mass ratio µ
cr
beyon d which flapping occurs.
21
Chapter 2. Literature review
0 1000 2000 3000 4000 5000
0
0.05
0.1
0.15
0.2
0.25
0.3
0.35
0.4
Reynolds number, Re
mass ratio, m
*
Fixed point stable flapping
Limit cycle oscillation
Chaotic
Chaotic Flapping Zone
Limit Cycle Oscillation Zone
Fixed point Stability
Theoretical m
*
cr
2.5× m
*
cr
Figure 2.2: Reynolds number and mass ratio stability phase diagram for
K
B
= 0.0001 . Rendering courtesy of P. S. Gurugubelli.
The main parameters of the pr ob lem have different effects on the stability of the
system. As shown phase diagram in Figure 2.2, th e Reynolds number an d mass
ratio have destabilizing influences on the system. On the contrary, the bending
rigidity K
B
has a stabilizing in fluence since the less a foil is flexible, i.e. for
higher K
B
, the more it can resist transverse stresses. This phase diagram was
derived with the numerical solver that is u sed in the present work [14].
In 2000, Zhang et al. [3] observed a sub-critical bifurcation while varying the
length of the flag in a flowing soap experiment, as shown in Figure 2.3. In this
figure, arrows depict jumps from a state of the system characterized by low am-
plitudes and frequencies, to another of higher am plitude and frequency. The
authors reported that increasing its length made the flag more prone to flap,
i.e. less stable. In another study, Shelley et al. [16] performed a linear stability
22
Chapter 2. Literature review
Figure 2.3: Flapping frequency and amplitude of the filament as a function of
its length. a, Flapping frequency; b, amplitude. Fig ure extracted from Zhang
et al. [3].
analysis and an exper im entation to predict the critical velocity for the onset of
flapping. Th e results stressed the importance of bod y inertia in overcoming the
stabilizing effects of finite rigidity and tension. Similar findings were achieved
by Argentina and Mahadevan [17] who exp lained the d iscr epancy between their
theory and the data by the role of tension and three-dimensional effects. Jaiman
et al. [18] proposed a generalized added-mass expression an d a new formulation
to predict the critical velocity. More generally, linear stability theories underes-
timate the critical velocity as compared to experimental data [19]. Eloy et al.
[20] proposed that such discrepancies were due to the effect of the plate aspect
ratio. Th ey argued that the two-dimensional limit could not be achieved exper-
imentally because hysteretic behavior and three-dimensional effects ap pear for
23
Chapter 2. Literature review
plates of large aspect ratio (greater than 2). As a matter of fact, flutter is no
longer purely one-dimen sional as the plate exhibits two-dimensional deflection s.
The authors listed several reasons for such out-of-plane oscillations: the hetero-
geneous spanwise pressure distribu tion due to finite plate width, the non-trivial
stress tensor due to gravity effects and small imperfections in the controlled flow.
2.3 Traveling waves
Recently, Michelin et al. [21] used a vortex point model to exhibit traveling
phenomena along the foil. Th e authors displayed direct kinematic waves, i.e.
associated with orientation angle, velocity or position, travelin g down over the
foil in direction of the flow. I t is easy to deduce or imagine such kinematic waves
given the traveling-wave type of motion of the foil. Interestingly, the authors
also showed the presence of reverse dynamic waves traveling up the flag in the
opposite direction to the fl ow. Those waves included the local p ressure force and
the normal component of the elastic forces in the foil. The latter were found
to p ropagate at a phase speed lower than the direct kinematic waves. To our
knowledge, Michelin’s is the unique work th at reported such reverse traveling
features. As of today, there is very little understanding on the mechanisms
underlying the propagation of these waves. In particular, reverse dynamic waves
might play a significant role on stability issues. A better u nderstanding of reverse
dynamic waves is likely to shed light on the propagation of disturbances that
cause the foil to start oscillating.
24