Fiscal austerity, dollar appreciation, and maldistribution will derail the US economy
Bạn đang xem bản rút gọn của tài liệu. Xem và tải ngay bản đầy đủ của tài liệu tại đây (1.02 MB, 16 trang )
Levy Economics Institute of Bard College
Strategic Analysis
May 2015
FISCAL AUSTERITY, DOLLAR
APPRECIATION, AND
MALDISTRIBUTION WILL DERAIL
THE US ECONOMY
. , , ,
and
Introduction
The US economy is about to enter the seventh year of its recovery. The GDP growth rate, with the
exception of two quarters, has been positive since 2009Q3, and the unemployment rate has steadily
decreased, from a peak of 10 percent at the height of the crisis in mid-2009 to 5.4 percent in April
2015. This was within the range of unemployment the Federal Reserve had declared acceptable.
However, even after such a long recovery period and fall in the unemployment rate, the US
economy does not seem to have gathered enough steam. According to the advance estimates from
the Bureau of Economic Analysis (BEA), real GDP grew by only 0.2 percent in the first quarter of
this year, and was only 8.8 percent above its precrisis peak. Finally, according to the April 2015
data from the Bureau of Labor Statistics (BLS), total employment is just 2.1 percent higher than
its precrisis peak in January 2008.
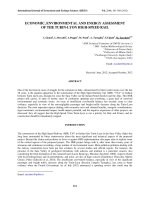
The weakness of the current recovery can also be understood within the context of previous
recoveries in the postwar period. Figure 1 depicts the path of real GDP from the trough to the
peak for each economic recovery since World War II, at quarterly frequency. The three lines shown
in color correspond to the three latest US economic recoveries, including the current one.
1
The
gray lines correspond to all postwar recoveries prior to 1991Q1.
Two things stand out. First, the last three recoveries have been visibly weaker than the previ-
ous ones. Second, the current recovery is the weakest in the postwar era. The picture would
become even worse had we included the large drop in GDP during the 2008–9 recession.
The Levy Institute’s Macro-Modeling Team consists of President Dimitri B. Papadimitriou, and Research Scholars Greg Hannsgen, Michalis
Nikiforos, and Gennaro Zezza. All questions and correspondence should be directed to Professor Papadimitriou at 845-758-7700 or
Copyright © 2015 Levy Economics Institute of Bard College.
of Bard College
Levy Economics
Institute
Moreover, if we look more closely at the labor market
we find that the unemployment rate has decreased mainly for
the wrong reasons.
2
In Figure 2 we can see that the labor force
participation rate has fallen by more than three percentage
points compared to its precrisis level, and is now hovering
around its mid-1970s level. This decrease manifests the long-
lasting effect of the crisis on the US labor market, and shows
that a significant part of the population has become discour-
aged and dropped out of the labor force. A decrease in labor
force participation tends to lower the unemployment rate
even when there is no improvement in overall employment or
the employment-to-population ratio.
Figure 3 confirms that. The large drop—more than five
percentage points—in the employment-to-population ratio
that accompanied the crisis was followed by a flat ratio over the
next four years. Only very recently has this ratio started to slowly
pick up, but it is still 4 percent lower than its precrisis level—
more on a par with its mid-1970s (and mid-1980s) levels.
Similar to the performance of real GDP, the employment-
to-population ratio during the current recovery has been the
weakest of the postwar period, as shown in Figure 4. Another
interesting feature of this figure is that the last three recoveries—
again, like real GDP—have been distinctly weaker compared to
2 Strategic Analysis, May 2015
the previous ones (an exception to this is the recovery of the
1960s—the gray line that roughly follows the trajectory of the
recovery in the 1990s—but this is most likely related to the
very high employment rates of the period).
In what follows, we discuss the reasons behind this anemic
recovery. We identify three main structural characteristics of
the US economy that stand in the way of recovery: (1) the weak
performance of net exports, (2) pervasive fiscal conservatism,
and (3) high income inequality. As will become obvious in the
next section, these three factors, together with the deleverag-
ing of the household sector, can explain the slow recovery. At
the same time, given these structural characteristics, the econ-
omy’s future recovery is once again dependent on a rise in
private borrowing and thus the debt and debt-to-income ratio
Figure 1 Index of Real GDP in US Recoveries, 1949–2015Q1
Sources: BEA; National Bureau of Economic Research (NBER); authors’
calculations
Trough=100
9
0
1
00
1
10
1
20
1
30
1
40
1
50
160
Earlier Recoveries
1991Q1–2001Q1
2001Q4–2007Q4
2009Q2–
2015100 5 25 3530
40
Quarters since End of Recession
Figure 2 Civilian Labor Force Participation Rate,
1
970–2015Q1
S
ource: BLS
Percent of Population
5
8
60
6
2
68
1970
1975
1980
1985
1990
1995
2000
2005
2010
2015
6
6
64
Figure 3 Civilian Employment–Population Ratio,
1970–2015Q1
Source: BLS
Percent of Population
54
58
62
66
1970
1974
1978
1982
1986
1990
1994
1998
2002
2006
2010
2014
of the private sector, especially the households in the bottom
90 percent of the income distribution.
In our baseline scenario, we examine what the prerequi-
sites are for the recent projections in the Congressional Budget
Office’s Budget and Economic Outlook (CBO 2015a, b) to mate-
rialize. Our simulations show that the private sector needs to
keep decreasing its financial surplus, which by the end of 2017
becomes a deficit for the first time since the crisis began.
As Wynne Godley (1999) argued in the Institute’s first
Strategic Analysis and we reemphasized in our report last year
(Papadimitriou et al. 2014), this kind of recovery, even if it
happens, is unsustainable, and is bound to end in another
serious crisis.
In the course of our discussion we identify the very sig-
nificant increase in net exports of petroleum products as a
positive development for the US economy. Without this, the
US trade deficit would most likely have returned to its very
high precrisis levels. This increase in the net export of petro-
leum and related products is mainly due to the increase in
domestic production that became possible with the new
extraction technology, and also due to the decrease in the
Levy Economics Institute of Bard College 3
price of oil. On the downside, these new extraction techniques
carry significant dangers for the environment. Moreover, the
decrease in the price of oil reflects, to a certain extent, the weak
state of demand in the United States and, most important, in
the rest of the world. A hypothetical robust recovery of the US
and the global economies would increase the price of oil.
This brings us to our last point. Besides the structural
characteristics of the US economy that undermine long-run,
sustainable recovery, two more factors threaten the current
recovery: the appreciation of the US dollar and the fragile
economies of many of the United States’ trading partners.
Using our model, we find that a further depreciation and/or
slowdown of growth in the economies of US trading partners
will have very significant consequences: an increase in the for-
eign deficit, which will lead to a decrease in the projected growth
rate and, at the same time, an increase in the need for private
(and government) borrowing, thus rendering the US econ-
omy even more fragile.
As is our usual practice in these reports, we do not attempt
to make short-term forecasts. Instead, our perspective is
medium term, and we concern ourselves with potential devel-
opments over the next few years.
Components of Economic Recovery
Some clues about the reasons for the weak recovery can be
found in detailed data from the BEA. Figures 5 through 9 each
depict the path of one component of GDP from the trough to
the peak of every postwar economic recovery, at quarterly fre-
quency. As in Figure 1, the three lines shown in color corre-
spond to the last three US economic recoveries and the gray
lines to the previous postwar recoveries. Note that the five com-
ponents shown in these figures sum to total GDP as follows:
GDP = personal consumption expenditures + gross
private investment + government consumption and
gross investment + exports – imports
The series have all been adjusted for inflation using the
BEA’s chain-weighted price-index series, with the first obser-
vation set equal to one hundred, so that the path for each
period shows recovery or decline relative to the same base.
Figure 4 Index of Employment–Population Ratios in US
Recoveries, 1948–2015Q1
Sources: BLS; NBER; authors’ calculations
Trough=100
96
1
00
102
1
04
1
06
108
1
12
Earlier Recoveries
1991Q1–2001Q1
2001Q4–2007Q4
2009Q2–
2
01510
0
5
25 3530
40
Q
uarters since End of Recession
1
10
9
8
4 Strategic Analysis, May 2015
Figure 5 shows the path of consumer spending. It is strik-
ing that the current recovery of consumption has been slower
than any other recovery in the postwar period. Given the high
share of consumption as a component of GDP, this has been
the main reason for the anemic recovery of the past five years.
In turn, as we explained in our previous Strategic Analysis
(Papadimitriou et al. 2014), the main reason for the slow
recovery in consumption is the high inequality in the distri-
bution of income—and, of course, the effort of US house-
holds to deleverage in the aftermath of the crisis. Later, we
examine the role of consumer credit growth—not an inex-
haustible propulsive force—in this latest expansion.
Figure 6 shows the path of private domestic business
investment, using a similar format. Investment has performed
better compared to the previous recovery, and its current path
is similar to the one followed during the recovery of the 1990s.
However, it is still below all other previous postwar recoveries.
Moreover, the drop in private investment in the most recent
recession was unusually severe, implying that, in the current
recovery, this component of GDP started from a very low
base. Hence, the performance of this component since the last
cyclical peak, in 2007, is weaker than in any complete peak-to-
peak period since 1949.
Figure 5 Index of Real Personal Consumption Expenditures
i
n US Recoveries, 1949–2014
Sources: BEA; NBER; authors’ calculations
Trough=100
9
0
1
00
110
1
20
1
30
1
40
1
50
1
60
E
arlier Recoveries
1991Q1–2001Q1
2001Q4–2007Q4
2009Q2–
201510
0
5 25 3530 40
Quarters since End of Recession
F
igure 6 Index of Real Gross Private Investment in US
Recoveries, 1949–2014
Sources: BEA; NBER; authors’ calculations
Trough=100
8
0
1
00
1
20
1
40
1
60
1
80
2
00
2
20
E
arlier Recoveries
1991Q1–2001Q1
2001Q4–2007Q4
2009Q2–
2015100 5 25 3530 40
Quarters since End of Recession
Figure 7 Index of Real Government Consumption and
Gross Investment in US Recoveries, 1949–2014
Sources: BEA; NBER; authors’ calculations
Trough=100
90
120
130
140
150
160
170
180
Earlier Recoveries
1991Q1–2001Q1
2001Q4–2007Q4
2009Q2–
2015100 5 25 3530 40
Quarters since End of Recession
100
110
Figure 7 presents the series for government spending—
which, as we can see, has been the other major drag on the
present recovery. There has been no other recovery in the
modern history of the US economy in which government
spending decreased in real terms (with the exception of a
short cycle in the early 1970s). The picture does not change if
we examine the cycles from peak to peak and thus take into
account the effect of the fiscal stimulus of 2008–9, which
mostly predated the last cyclical trough. Even examining these
full cycles, the current recovery stands out as one in which the
level of government spending is lower at the end of the period
under examination than at the beginning.
Figure 8 shows that exports helped to spark the current
recovery; their performance at the initial stage of the recovery
was average compared to the rest of the postwar cycles but
significantly better compared to the previous two cycles.
However, the weak foreign demand of the recent period has
affected exports, and their growth has slowed significantly.
Finally, Figure 9 illustrates the path of US imports. It is
important to keep in mind that imports reduce GDP, and thus
the steeper the line in the figure, the greater the drag on GDP
growth. The behavior of imports during the recovery can be
divided into two subperiods. The beginning of the recovery is
marked by a steep increase in imports—much steeper than in
the previous two recoveries and almost every other postwar
recovery. However, in the last three years the pace of imports
has slowed considerably, substantially aiding growth and, to a
certain extent, counteracting the poor performance of the
other components of GDP. We will discuss the foreign sector
in more detail in the next section.
In conclusion, we can make the following points about
the components of GDP during the current recovery:
1. Figures 5 and 7 show that the biggest obstacles for the
recovery have been the unequal distribution of income
and the debt overhang from the previous cycle—which
have resulted in the feeble recovery of consumption—
and the fiscal conservatism of the US government.
2. The performance of investment has been average com-
pared to other recoveries.
3. The path of exports in the recent period is a sign of the
weak foreign demand for US products, largely due to the
Levy Economics Institute of Bard College 5
Figure 8 Index of Real Exports in US Recoveries, 1949–2014
Sources: BEA; NBER; authors’ calculations
Trough=100
80
1
00
1
20
1
40
1
60
1
80
2
00
220
Earlier Recoveries
1
991Q1–2001Q1
2001Q4–2007Q4
2009Q2–
201510
0
5 25 3530 40
Quarters since End of Recession
Figure 9 Index of Real Imports in US Recoveries, 1949–2014
Sources: BEA; NBER; authors’ calculations
Trough=100
-80
0
20
40
60
80
-60
Earlier Recoveries
1991Q1–2001Q1
2001Q4–2007Q4
2009Q2–
201510
0
5 25
Note: Figure shows the negative of the change in imports, as imports are a
subtraction from GDP.
3530 40
Quarters since End of Recession
-40
-20
100
120
6 Strategic Analysis, May 2015
economic problems of US trading partners. We believe this
is a very important issue for the future as well.
4. From a macroeconomic point of view, an encouraging
sign has been the recent performance of imports, whose
rate of growth has slowed.
The Foreign Sector
As we have repeatedly argued in previous Strategic Analysis
reports—starting with the very first one in 1999—the struc-
tural current account deficit is one of the biggest problems the
US economy faces.
3
Improvement in the current account is a
necessary condition for sustainable recovery in the future. It is
thus worth having a closer look at the recent behavior of the
current account and its components and thinking how these
components will behave in the medium-term future.
In Figure 10 we can see that, beginning in the early 1990s,
net borrowing and the trade deficit increased, reaching 6 per-
cent of GDP on the eve of the Great Recession. The year 2007
marked a reversal of this trend, which continued until the
recession’s end in 2009Q2. The (weak) recovery that followed
was not accompanied by a significant increase in the trade
deficit or in net lending. The trade deficit increased until
2012Q1—reaching 3.6 percent of GDP—and then decreased
again, and is now around 3 percent of GDP. On the other hand,
net borrowing increased only slightly after 2009, and has fol-
lowed the downward trend of the trade deficit since 2012. It is
now around 2.3 percent of GDP.
Based on the above—and as we can see in Figure 10—the
improved performance of net borrowing and the current
account balance can be decomposed into two parts: (1) the
overall improvement in the trade balance and (2) an increase
in net income receipts from abroad on the order of 1 percent
of GDP.
Trade Balance
In Figure 11 we can see that the overall improvement in the
trade balance (as of end 2014) is mostly due to the improve-
ment in the balance of trade in goods, although there has been
a slight improvement in the balance of trade in services as well.
If we go one step further, we can understand where this
improvement in the trade balance comes from. In Figure 12 we
decompose net exports of goods into (1) net exports of goods
except petroleum products and (2) net exports of petroleum
products. As we can see, when the recovery began in 2009, the
trade deficit in both categories started to increase, despite the
depreciation of the dollar over the same period. The downward
Sources: BEA; authors' calculations
Percent of GDP
Balance on Primary Income
Balance on Secondary Income
Balance on Goods and Services
Balance on Current Account
2011199919961990 1993 2014
Figure 10 Current Account Balance and Its Components,
1990−2014
-6
-4
-2
0
2
-3
-1
1
-5
-7
200820052002
Sources: BEA; authors' calculations
Percent of GDP
Net Exports of Services
Net Exports of Goods and Services
Net Exports of Goods
2011199919961990 1993 2014
Figure 11 Net Exports, 1990−2014
-6
-4
-2
0
2
-3
-1
1
-5
-7
200820052002
Levy Economics Institute of Bard College 7
trend in net exports of “goods except petroleum products” has
continued uninterrupted, and has accelerated in the last few
quarters.
The game changer in the overall trade of goods is the
export of petroleum and petroleum products. Because of the
new oil extraction methods, the trade deficit in these products
reversed course in 2011 and has been shrinking ever since.
The decrease in this deficit between 2011Q2 and 2014Q4 is
more than 1 percent of GDP. If we look at the trade deficit in
petroleum products in 2014Q4 in relation to where it would
have been if it had continued along its pre-2011 path, we
would see an improvement of more than 2 percent of GDP. If
net exports of petroleum products were 2 percent lower, the
trade deficit would have returned to its precrisis level. Finally,
it is worth mentioning that this improvement has come about
mostly through a decrease in US imports of petroleum prod-
ucts rather than an increase in US exports.
The new methods that have been used for extracting oil
and gas—known as hydraulic fracturing, or “fracking”—are
still controversial because of the potential harmful environ-
mental implications (such as air pollution, earthquakes, and
adverse effects on the water supply). Moreover, from the point
of view of environmental economists—even before the appli-
cation of fracking—our biggest problem is not that we do not
have enough oil to burn; rather, we have too much oil to burn.
S
ources: BEA; authors' calculations
Percent of GDP
Net Exports of Petroleum and Related Products
N
et Exports of Goods except Petroleum and Related Products
N
et Exports of Goods
2
0111999 2002
2014
Figure 12 Net Export of Goods, 1999−2014
-
6
-4
-
2
0
-
3
-1
-
5
-
7
2
0082005
1
Sources: BEA; authors' calculations
Percent of GDP
N
et Exports of Services
C
harges for Use of Intellectual Property (n.i.e.)
Travel
Other Business Services
Financial Services
Transport
Insurance Services
Government Goods and Services (n.i.e.)
2
0111999 2002
2
014
Figure 13 Net Export of Services, 1999−2014
2
0082005
0.4
0
.8
1
.2
1
.6
1
.0
1.4
0.6
-0.6
-
0.2
0.2
0
-
0.4
Figure 14 Balance on Primary Income, 1999–2014
Sources: BEA; authors' calculations
Percent of GDP
-1.5
-1.0
-0.5
0
0.5
1.0
1.5
2.0
Direct Investment Income
Investment Income
Other Investment Income
Balance on Primary Income
Compensation of Employees
Reserve Asset Income
Portfolio Investment Income
2014200820051999 2002 2011
2.5
8 Strategic Analysis, May 2015
The newly added supply of oil extracted by fracking obviously
worsens this problem.
Nevertheless, leaving aside these very serious concerns,
the decrease in the trade deficit in petroleum products is a
very significant development for the US macroeconomy.
Another good piece of news comes from the net export of
services. As we can see in Figure 13, between 2008 and 2014Q4
net services increased by around 0.6 percent of GDP.
Primary Income
As we mentioned above, another source of improvement in
the current account is the increase in the net primary income
balance. In Figure 14 we present the components of the primary
income receipts. In the most recent period—after 2009—this
improvement is entirely due to the decrease in portfolio
investment income payments. In the years preceding the cri-
sis—especially in 2007 and 2008—there was also an improve-
ment in net direct investment income receipts, which have
since remained around 1.8 percent of GDP.
An interesting question is whether this improvement in
net primary income receipts is sustainable or just sympto-
matic of the crisis. In our view, it is most likely the latter.
In Figure 15 we present the net foreign assets of the US
economy. Given the current account deficit (see Figure 10), it is
not surprising that net foreign liabilities as a share of US GDP
have continued to rise since the crisis, albeit at a slower rate.
The reason for the improvement in the primary income
balance is that the implicit yield spread between US-owned
foreign assets and foreign-owned US liabilities has increased
since the crisis. However, this increase is a sign of the fragility
of the global economy, a result of the increase in demand for
US liabilities, and, finally, an outcome of the aggressive quan-
titative easing (QE) programs of the Federal Reserve. The
spread is bound to return to lower levels when the QE pro-
gram is rolled back and the Fed raises interest rates, especially
if the global economy returns to a state of relative stability.
Figure 16 confirms this conclusion. For the calculation of
the spread we estimated the implicit yield on foreign assets
earned by the US economy as the ratio of the income receipts
on US-owned foreign assets to the value of those assets the
previous year. Similarly, we calculated the implicit yield paid
by the United States as the ratio of the income payments on
foreign-owned US assets to the corresponding assets of the
previous year. The spread is simply the difference between
these two yields. As we can see, this “yield spread” is correlated
Figure 15 US Net International Investment Position,
1976–2014
Sources: BEA; authors' calculations
Percent of GDP
-50
-40
-30
-20
-10
0
10
20
Direct Investment at Market Value
US Net International Investment Position
Other Investment
Reserve Assets
Portfolio Investment
1992
1988
1984
1976
1980
2012
2008
2004
1996
2000
Figure 16 Yield Spread, 1980–2014
Sources: BEA; authors' calculations
Percent
0
0.5
1.0
1.5
2.0
2.5
1992
1988
1984
1980
2012
2008
2004
1996
2000
Levy Economics Institute of Bard College 9
with the business cycle and tends to peak one or two years
after each crisis. Thus, a high value for the spread is a bad sign
for the condition of the US and global economies.
US Trading Partners
An examination of US trading partners is necessary for our
analysis because of their influence on the performance of the
foreign sector of the US economy and the current account
balance. As we have argued in previous reports, a lower cur-
rent account balance (a higher deficit) makes the recovery of
the US economy dependent on debt-fueled private sector
spending, which is not sustainable in the medium term.
We identify three factors that might have a negative effect
on the foreign sector of the US economy in the immediate
future: (1) weaker growth among US trading partners and
thus weak demand for US exports; (2) lower inflation in the
economies of US trading partners, which will increase the rel-
ative price of US products; and (3) appreciation of the nomi-
nal exchange rate of the dollar.
The recent strong performance of the US macroeconomy,
at least until 2014Q4, has been an exception in the midst of a
slowdown of economic activity worldwide. It is likely that the
eurozone as a whole will lapse into another recession. Japan is
in a deflationary situation as well. The United Kingdom has
not convinced anyone that it has escaped a cycle of weakening
growth and fiscal austerity measures, though its growth rates
remain strong at the moment, largely because of its control of
an independent currency and its own fiscal policy. Finally,
Canada’s economy is vulnerable to elevated levels of house-
hold indebtedness and imbalances in the housing market
(Bank of Canada 2014) as well as a decline in oil revenues in
the west of the country.
A slowdown in economic activity is also evident in the
so-called emerging markets. The Chinese economy, which has
experienced decades of two-digit growth rates, is cooling, and
decreases in the price of oil and food commodities, along with
a rising dollar, are exerting enormous pressure on the economies
of Latin America and Russia. This situation is made worse by
the geopolitical instability in many parts of the world, espe-
cially in Russia and the Middle East.
As far as the United States is concerned, the stagnation, or
weaker-than-expected performance, of the “rest of the world”
translates into weaker demand for US exports and has a neg-
ative impact on the rate of growth.
On top of that, the weak(er) economic performance of
US trading partners has an impact on their inflation rates. As
their economies slow down, the rate of inflation slows as well.
In turn, this tends to lift the price of US products relative to
the products of its trading partners—an appreciation of the
real exchange rate—and thus has a negative impact on US
exports and imports. Our model includes the effects of such
changes in the current account balance.
Finally, another source of pressure on the US foreign sec-
tor is the appreciation of the nominal exchange rate (which,
of course, affects the real one as well). Quantitative easing
ended in October 2014, but this step marked only the end of
new securities purchases under the QE program. Official
statements indicate that the federal funds rate—the US policy
rate—may begin to rise later this year, with employment
growth being the key factor in this decision. On the other
hand, the European Central Bank recently launched a pro-
gram of quantitative easing, and some two-year yields are
negative in the eurozone. Central banks in Japan and the UK
are also holding off on plans to tighten monetary policy in
light of deflation, putting them in the camp of governments
expected to loosen domestic monetary policy relative to the
US Federal Reserve.
Figure 17 US Exchange Rate Indices, 1980Q1–2015Q1
Source: Federal Reserve
0
20
40
60
80
100
120
140
Nominal Other Important Trading Partners Index
Nominal Broad Dollar Index
Nominal Major Currencies Dollar Index
160
2010 201520052000
10 Strategic Analysis, May 2015
This divergence in the direction of monetary policy has led
to a significant appreciation of the dollar. As Figure 17 shows,
the dollar has appreciated by more than 10 percent against the
currencies of the United States’ trading partners since the sec-
ond quarter of last year. It is very possible that this nominal
appreciation will continue in the upcoming period as the path
of monetary policy and the pace of economic growth in the
United States and the rest of the world continue to diverge.
US Households: Some Forces Affecting the
Prospects for Economic Recovery
The growth in consumer expenditures in the recovery has
rested largely on the accumulation of household debt. Figure
18 shows updated series for both mortgage debt and con-
sumer debt, which includes items such as auto loans. To
obtain measures of leverage, we have divided all series in the
figure by household sector disposable income. As we have
pointed out previously (Papadimitriou, Hannsgen, and
Nikiforos 2013a), net new consumer debt as a proportion of
household disposable income was steadily climbing in the ini-
tial stages of the recovery (late 2009 through 2012), feeding
the weak recovery in consumption expenditures documented
in Figure 5 and the second section above. Net increases in
consumer credit as a percentage of household disposable
income, as illustrated by the red line in Figure 18, have remained
above zero since 2011. Still, the net increases have declined in
recent quarters, imparting a rounded, though upward-slop-
ing, shape to the portion of this line corresponding to the
period 2009Q2–2014Q4. The black line offers a different per-
spective on the same phenomenon, showing that the total
stock of consumer debt is trending upward and has stayed
persistently at levels well above those seen in the 1980s and
early 1990s.
The situation with mortgage debt is sharply different. We
have consistently argued that, overall, the household sector,
starting in the midst of the financial crisis, has been forced to
deleverage, impairing growth. This has largely been a story
about the stock of mortgage debt, which, following the precri-
sis housing boom, has declined in most quarters of the recov-
ery. Mortgages are traditionally the dominant form of
household debt because they offer middle-class homeowners
a chance to borrow against a large amount of collateral. The
hill-shaped gray line in Figure 18 shows the arcing trajectory
of the total stock of mortgage debt owed by the household
and nonprofit sector, while the blue line shows that the net
addition to this stock has emerged from mostly negative terri-
tory only since 2013. The blue line still remains below the red
line, meaning that consumer credit—which has so far escaped
deleveraging—now accounts for the bulk of net new debt each
quarter. Increased borrowing of one kind or another can often
be sustained for a long time, as in this case; but eventually,
retrenchment takes place relative to incomes. The conse-
quences of any further retrenchment in debt-financed con-
sumer spending would be felt throughout industries that
produce for the US consumer, and again, as we noted above,
the recovery in real private domestic consumption is already
weak relative to any previous recovery.
The use of household debt has been integral to recent
expansions, partly owing to an increasingly lopsided income
distribution (Papadimitriou, Hannsgen, and Zezza 2012;
Papadimitriou et al. 2014). Recently, Steve Keen (2015) observed
that leverage remains dangerously high. Detailed analysis of
household-level data reveals that little deleveraging has
occurred in the lower quintiles of the distribution (Wolff
2014). In other words, the recovery has not yet witnessed the
repair of balance sheets in all social strata. In fact, net worth
Figure 18 Ratio of Household and Nonprofit Sector
Liabilities to Disposable Income (Stocks and Flows),
1980–2014
Sources: Federal Reserve; BEA; authors’ calculations
0
0.2
0.4
0.6
0.8
1.0
1.2
Consumer Credit Outstanding (left scale)
Mortgage Debt Outstanding (left scale)
Change in Consumer Credit (right scale)
Change in Mortgage Debt (right scale)
2010
200520001980 1995
1985
-0.06
-0.04
-0.02
0
0.08
0.10
0.14
0.12
1990
0.02
0.04
0.06
Levy Economics Institute of Bard College 11
has not grown strongly in the recovery except among the
wealthiest Americans, whose portfolios stood to gain signifi-
cantly from a strong stock market. On average, households of
modest means, especially those in the bottom quintile, still
carry very high levels of debt in relation to their incomes. The
deleveraging of household balance sheets continues, and still
has not progressed to a sufficient extent in the aftermath
of the Great Recession of 2007–9. We continue to believe that
the combination of anemic wage growth (Rios-Avila and
Hotchkiss 2014) and rising household debt—of whatever
kind—cannot sustain growth. What’s more, very low general
inflation in wages and prices slows progress in reducing lever-
age, as it stymies growth in nominal household incomes. The
2010–14 deceleration in the growth in consumer credit rela-
tive to disposable income may prove to be a harbinger of a
second postcrisis household deleveraging.
Baseline Scenario
In order to evaluate the prospects for the US economy,
we simulate four scenarios using the Levy Institute’s macro-
econometric model.
As is our usual practice, we draw on the CBO’s projec-
tions for the US economy to form our baseline scenario. More
precisely, we use The Budget and Economic Outlook: 2015–
2025 (CBO 2015a) and its more recent update (CBO 2015b)
and examine what the prerequisites for and implications of
these projections are.
A summary of the CBO’s projections is shown in Table 1.
The federal budget deficit, as a percentage of GDP, is projected
to decrease slightly, from 2.8 percent in fiscal year 2014 to 2.4
percent in 2018. At the same time, real GDP will increase by
2.8 percent in 2015, 3.0 percent in 2016, 2.7 percent in 2016,
and, finally, 2.1 percent in 2018.
4
For our simulations we assume a mild increase in the price
level and stock market and a constant real exchange rate. The
growth and inflation rates of US trading partners are taken from
the International Monetary Fund’s World Economic Outlook
(IMF 2014). We also assume that nonfinancial corporations will
continue to accumulate debt at the same—constant—pace as
they have been doing since the end of the recent crisis.
In effect, the question we ask, given the above assump-
tions, is, what would the expense and borrowing behavior of
the private sector need to be in order for the CBO’s projec-
tions to be realized?
The results of these baseline simulations are summarized
in Figure 19. We can make two important observations. The
first is the significant worsening of the US foreign position.
According to our model, the current account deficit will reach
5 percent of GDP by 2017 and will remain there throughout
the following year.
Following simple accounting rules, this increase in the
current account deficit combined with the government’s tight
fiscal stance (as projected by the CBO) implies that the private
sector balance will decrease. As we can see in Figure 19, private
sector net borrowing (investment minus saving) maintains its
postcrisis trend and continues to rise, reaching positive terri-
tory in 2017 and remaining there throughout 2018. This is the
first time in the postcrisis period that private sector spending
exceeds income.
2014 2015 2016 2017 2018
Outlays (%GDP) 20.3 20.4 20.8 20.6 20.5
Revenues (%GDP) 17.5 17.7 18.4 18.3 18.1
Deficit (%GDP) -2.8 -2.7 -2.4 -2.3 -2.4
Real GDP growth rate (%) 2.2 2.8 3 2.7 2.1
Table 1 CBO Baseline Projections, 2014–18
Source: CBO (2015a, b)
Sources: BEA; authors’ calculations
Percent of GDP
-15
-10
-5
0
5
10
15
Government Deficit
Private Sector Investment minus Saving
External Balance
201320112009
2005
2007 2017
Figure 19 Baseline Scenario: US Main Sector Balances,
Actual and Projected, 2005−18
2015
12 Strategic Analysis, May 2015
We cannot emphasize enough the importance of this
finding. As we have repeatedly argued in the past, private sec-
tor spending in excess of income implies an increase in the
sector’s debt-to-income ratio, and is therefore unsustainable.
In the context of our baseline scenario, the projected trajec-
tory of the private sector gross-debt-to-disposable-income
ratio is depicted in Figure 20.
This kind of unsustainability was the primary reason for
the downturn of 2001 and the more recent Great Recession.
As our simulation results show, the recovery of the US econ-
omy requires that the same unsustainable process be repeated
once more.
Other Scenarios
As we mentioned above, the fragile economies of many
US trading partners as well as the recent appreciation of the
dollar—which is bound to appreciate even further—are among
the biggest obstacles to economic recovery in the United States.
To make this point more clear, we simulated three addi-
tional scenarios. In scenario 1 we assume that the annual
growth rate of real GDP of US trading partners will be 1 per-
cent lower than the rate projected by the IMF. This is a plau-
sible scenario given that the IMF’s projections are usually
on the optimistic side. In scenario 2 we assume a further 25
percent appreciation of the dollar over the next four years.
Finally, scenario 3 combines scenarios 1 and 2, and the lower
growth rate of US trading partners is combined with dollar
appreciation.
The effect of these developments on the future growth
rate of the US economy can be seen in Figure 21. Weaker
growth abroad and the rise of the dollar can have significant
consequences for the US economic growth rate. In scenario 1
the growth rate is around half a percentage point lower than
in the baseline in every year of the projection period (except
in 2015, where the difference is smaller). The dollar apprecia-
tion has a more negative impact and the growth rate differen-
tial is close to 0.8 percentage points. When appreciation and
slower growth are combined, the growth rate differential is
more than 1 percentage point. These results show that even a
minor decrease in demand for US exports and/or a moderate
appreciation of the dollar could lead the US growth rate to its
lowest levels since the beginning of the recovery. In fact, the
Sources: BEA; Federal Reserve; authors’ calculations
1.5
1
.55
1.6
1.75
1
.8
1.85
1.9
1.95
Baseline
Scenario 1
Scenario 2
Scenario 3
201220092000 20062003 2018
Figure 20 Private Gross-Debt-to-Disposable-Income
R
atios, Actual and Projected, 2000−18
1
.65
1
.7
2015
Figure 21 Real GDP Growth, Actual and Projected, 2010−18
Sources: BEA; authors’ calculations
Annual Growth Rate (in percent)
1
1.5
2.5
3
3.5
Baseline
Scenario 1
Scenario 2
Scenario 3
2014201320122010 2011 2018
2
2015 2016 2017
Levy Economics Institute of Bard College 13
growth rate projected under scenario 3 for the year 2018
would be the lowest of any recovery in the last four decades.
To understand the full implications of our scenarios,
Figure 21 needs to be read together with the related financial
balances of the three institutional sectors of the economy,
shown in Figures 22 to 24. As we can see, the progressively
weaker growth rate in all three scenarios is accompanied—in
fact, it is caused—by a similar, progressively higher current
account deficit. In scenario 3 a growth rate of slightly more
than 1 percent in 2018 is combined with a current account
deficit of close to 7 percent of GDP.
The increase in the current account deficit is partly cov-
ered by an increase in the deficit of the government sector.
The change in the government sector balance is solely the
result of automatic stabilizers, since our assumptions about
discretionary government spending still follow the projec-
tions of the CBO.
However, the most important consequence of this
increase in the current account deficit is a further increase in
the deficit, and thus the debt-to-income-ratio, of the private
sector. In other words, not only does the growth performance
of the economy become (progressively) worse in scenarios 1
through 3, but also this weaker performance contributes to a
further increase in the private sector debt-to-income ratio,
which in turn makes the economy more fragile. As shown in
Figure 20, the gross-debt-to-disposable-income ratio of the
private sector increases more rapidly compared to the baseline
scenario, and by the end of our projection period achieves lev-
els comparable to those reached in 2006, the last year prior to
the Great Recession.
S
ources: BEA; authors’ calculations
Percent of GDP
-
15
-10
-5
0
5
1
0
1
5
Government Deficit
Private Sector Investment minus Saving
External Balance
2
01320112009
2005
2
007 2017
Figure 22 Scenario 1: US Main Sector Balances, Actual and
Projected, 2005−18
2
015
S
ources: BEA; authors’ calculations
Percent of GDP
-
15
-10
-5
0
5
1
0
1
5
Government Deficit
Private Sector Investment minus Saving
External Balance
2
01320112009
2005
2
007 2017
Figure 23 Scenario 2: US Main Sector Balances, Actual and
Projected, 2005−18
2
015
Sources: BEA; authors’ calculations
Percent of GDP
-15
-10
-5
0
5
10
15
Government Deficit
Private Sector Investment minus Saving
External Balance
201320112009
2005
2007 2017
Figure 24 Scenario 3: US Main Sector Balances, Actual and
Projected, 2005−18
2015
14 Strategic Analysis, May 2015
C
onclusion
T
he goal of the present report was to highlight the main struc-
t
ural problems of the US economy. We analyzed the nature of
t
he present recovery by decomposing GDP into its various
c
omponents. Through this prism, it is not hard to identify the
main reasons for the slow pace of the recovery, principally:
1. The fiscal conservatism of the US government. This is the
only recovery in which there has been a decrease in gov-
ernment expenditure.
2. The weak performance of US exports and imports. A signif-
icant exception to this is the increase in net exports of
petroleum and related products due to new extraction
technologies and the sharp decline in the price of oil.
3. The high income inequality and debt overhang from the
previous cycle, which have resulted in the slowest recovery
of consumption in the postwar period.
The first two factors make the US recovery dependent on
an unsustainable increase in private expenditure over private
borrowing. Our baseline scenario shows that for the CBO
projections to materialize, the private sector, beginning in
2017, has to again become a net borrower—for the first time
post crisis—and increase its debt and debt-to-income ratio.
Moreover, as our last report showed, given the high levels of
income inequality, this unsustainable increase in debt and the
debt-to-income ratio will disproportionally fall on the house-
holds at the bottom of the distribution, which are bearing an
ever-rising consumer-debt burden.
Finally, we argued that a long-run sustainable recovery
could be undermined by two additional factors: the apprecia-
tion of the US dollar and the fragile economies of many of
the United States’ trading partners. In scenarios 1 through 3 we
showed that further dollar appreciation and/or a growth slow-
down in the trading partner economies will lead to an increase
in the foreign deficit and a decrease in the projected growth rate,
and at the same time heighten the need for private (and govern-
ment) borrowing and increase the fragility of the US economy.
A final note: in our simulations, we assumed away any neg-
ative feedback effects from a slowdown in the United States on
the growth rate of its trading partners. However, as the recent
experience of the eurozone shows, these effects can be signifi-
cant, and lead to a vicious cycle of weak demand and low growth.
N
otes
1
. Each period shown in the figure is inclusive of the trough
o
f a recession and the peak of the subsequent recovery. For
t
he recession dates, we use the quarter corresponding to the
m
onthly date published by the NBER. This method results
in the use of 1953Q3, rather than 1953Q2, as the date of the
1953 trough, which occurred in July of that year.
2. We have previously discussed this issue of “jobless recov-
eries” in Nikiforos (2013) and Papadimitriou, Hannsgen,
and Nikiforos (2013a).
3. More recent reports that have tackled this issue include
Papadimitriou, Hannsgen, and Nikiforos (2013b) and
Papadimitriou et al. (2014).
4. Note that the projections for the budget refer to fiscal
years while the projections for the growth rate refer to
fourth-quarter-to-fourth-quarter percentage changes. In
our simulations we take into account these differences in
timing. However, in our graphs we present the results for
calendar years, which explains some minor discrepancies
between our simulations and the projections of the CBO.
References
Bank of Canada. 2014. Financial System Review. Ottawa.
December.
CBO (Congressional Budget Office). 2015a. The Budget and
Economic Outlook: 2015–2025. Washington, D.C.: CBO.
January 26.
———. 2015b. Updated Budget Projections: 2015–2025.
Washington, D.C.: CBO. March 19.
Godley, W. 1999. Seven Unsustainable Processes: Medium-
Term Prospects and Policies for the United States and the
World. Strategic Analysis. Annandale-on-Hudson, N.Y.:
Levy Economics Institute of Bard College. Revised
October 2000.
IMF (International Monetary Fund). 2014. World Economic
Outlook: Legacies, Clouds, Uncertainties. Washington,
D.C.: IMF. October.
Keen, S. 2015. Outlook 2015: Global Debt Deflation and
Manipulated Asset Markets. Kingston (UK): IDEA.
Nikiforos, M. 2013. Employment Recovery(?) after the Great
Recession. Policy Note 2013/3. Annandale-on-Hudson,
N.Y.: Levy Economics Institute of Bard College. April.
Levy Economics Institute of Bard College 15
Papadimitriou, D., G. Hannsgen, and G. Zezza. 2012. Back to
Business as Usual? Or a Fiscal Boost? Strategic Analysis.
Annandale-on-Hudson, N.Y.: Levy Economics Institute
of Bard College. April.
Papadimitriou, D., G. Hannsgen, and M. Nikiforos. 2013a. Is
the Link between Output and Jobs Broken? Strategic
Analysis. Annandale-on-Hudson, N.Y.: Levy Economics
Institute of Bard College. March.
———. 2013b. Rescuing the Recovery: Prospects and Policies
for the Recovery. Strategic Analysis. Annandale-on-
Hudson, N.Y.: Levy Economics Institute of Bard College.
October.
Papadimitriou, D., M. Nikiforos, G. Zezza, and G. Hannsgen.
2014. Is Rising Inequality a Hindrance to the US Economic
Recovery? Strategic Analysis. Annandale-on-Hudson,
N.Y.: Levy Economics Institute of Bard College. March.
Rios-Avila, F., and J. L. Hotchkiss. 2014. A Decade of Flat
Wages? Policy Note 2014/4. Annandale-on-Hudson,
N.Y.: Levy Economics Institute of Bard College. June.
Wolff, E. 2014. “Household Wealth Trends in the United States,
1962–2013: What Happened Over The Great Recession?”
Working Paper No. 20733. Cambridge: NBER.
N
onprofit Organization
U.S. Postage Paid
Bard College
B
lithewood
PO Box 5000
A
nnandale-on-Hudson, NY 12504-5000
Address Service Requested
o
f Bard College
Levy Economics
Institute