Jobless recovery is no recovery prospects for the US economy
Bạn đang xem bản rút gọn của tài liệu. Xem và tải ngay bản đầy đủ của tài liệu tại đây (2.96 MB, 20 trang )
Levy Economics Institute of Bard College
Strategic Analysis
March 2011
JOBLESS RECOVERY IS NO
RECOVERY: PROSPECTS FOR
THE US ECONOMY
. , , and
Introduction
The US economy grew reasonably fast during the last quarter of 2010, and the general expecta-
tion seems to be that satisfactory growth will continue in 2011–12. This report argues that the
expansion may indeed continue through 2012, and perhaps for another quarter or so in 2013. But
with large deficits in the government and foreign sectors, satisfactory growth in the medium term
cannot be achieved without a major, sustained increase in net export demand. This, of course,
cannot happen automatically, and it certainly will not happen without either a cut in the domes-
tic absorption of goods and services in the United States or a revaluation of the currencies of the
major US trading partners. Both might impart a deflationary impulse to the rest of the world,
while the latter might also cause a resumption of inflationary pressures.
Following our usual custom, we make no short-term forecast. Instead, using the Levy Institute’s
macro model, which is rooted in a consistent system of stock and flow variables, we trace a range
of possible medium-term scenarios in order to evaluate strategic predicaments and policy options,
without being at all precise about timing.
The Current State of the US Economy
The new Republican Congress has changed the rules of how policy will be formed, at least for the
next two years. Early legislative deliberations are firmly fixed on cutting the budget deficit—after
having achieved a compromise with the White House in continuing President Bush’s tax cuts for
some government transfers and payroll withholding—so that any talk about fiscal stimulus
The Levy Institute’s Macro-Modeling Team consists of President . and Research Scholars
and . All questions and correspondence should be directed to Professor Papadimitriou at 845-758-7700 or
of Bard College
Levy Economics
Institute
receives no consideration, and is even subject to ridicule.
Hence, the burden of fighting high unemployment seems to
have fallen mostly on the shoulders of the Federal Reserve.
A second round of quantitative easing (QE2)—the purchase
of long-maturity assets by the Fed—was announced in
November 2010, and is an attempt to engineer a loosening of
the credit markets and spur growth and employment. But
what could be the effects of this second push by the Fed? They
might be similar to those of QE1, and an analysis reveals the
following. In November 2008, the Fed announced large-scale
purchases of mortgage-backed securities and debt issued by
government-sponsored enterprises (GSEs). Its securities hold-
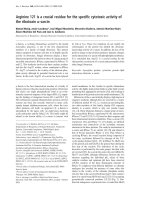
ings began to climb sharply in early 2009. As shown in Figure 1,
the monetary base (a broad measure of the Fed’s liabilities)
had already begun to rise several months prior to that, while
new asset purchases for QE1 ended in 2010.
The effects of QE1 and the other stimulus policies adopted
by the Fed since late 2008 have not been welcome in many
quarters both here and abroad, and their merits will be debated
for some time to come. Notably, however, a trade-weighted
index of the dollar’s value against a basket of foreign curren-
cies has declined quite a bit (see Figure 1). This development
has provoked captious commentary, especially from some
world leaders; but it may in fact have helped spur real (infla-
2 Strategic Analysis, March 2011
tion-adjusted) US exports, as shown by the blue line in Figure 1.
The figure also shows the yield on a 10-year inflation-indexed
Treasury security, which can be used as a measure of the real
interest rate. This rate has tumbled from well over 3.5 percent to
negative levels. Contrarians doubt that the Fed’s strategy can
succeed in reducing long-term interest rates over a prolonged
period—its remarkably sustained trend notwithstanding.
The expansionary fiscal policy initiated by President
Obama (Blinder and Zandi 2010), reinforced by an accom-
modative and even aggressive monetary policy that has kept
(real) short-term interest rates at zero percent and long-term
rates very low, have brought the “Great Recession” to an end.
Yet, with all this help, the recovery from the recession of 2008
has not been robust, as confirmed by stubbornly high levels of
unemployment and underemployment. Over the next few
years, policy and market developments are likely to prove
important for the performance of the US economy. Growth
and employment, in particular, have been far below the levels
of productive potential, and there is a widely accepted view
that most of the policy shifts under way will turn out to be not
only ineffective but also counterproductive.
The experience drawn from efforts to reduce budget
deficits in Europe could be seen as lessons in ineffective and
counterproductive policy. Greece, Ireland, the United Kingdom,
Portugal, and Spain—all of these countries are implementing
tax increases and drastic spending reductions, in the form of
cuts in public sector wages, government workforces, and
social spending. Meanwhile, the financial system continues to
create new demands on the public purse in Europe, where the
member governments of the eurozone lack the power to con-
duct independent monetary policy suited to their needs.
Notably, many large banks on the Continent and in Britain
hold significant amounts of bonds from countries such as
Greece, Ireland, and Portugal that may default on many of
their obligations. Separately, a mortgage crisis similar to the
one in the United States has developed in the Irish banking
system that has led many depositors to suddenly withdraw
funds (Krugman 2010). Bondholders are still skittish, and
yields on many European government bonds have climbed
significantly, notwithstanding the European Central Bank’s
large purchases of government bonds and its lending to trou-
bled eurozone banks. The leaders of Ireland have joined those
of Greece in agreeing to an international bailout effort, and
Figure 1 Possible Effects of Quantitative Easing
Sources: St. Louis Federal Reserve Bank, FRED database; authors’ calculations
Billions of 2005 Dollars
-500
0
500
1,000
1,500
2,000
2,500
Real Exports of Goods and Services, Balance-of-Payments Basis
(right scale)
Index of the Dollar Exchange Rate against Major Currencies, with
December 30, 2005 = 1,000 (left scale)
Monetary Base, in Billions of Dollars (left scale)
Real Yield to Maturity of Inflation-indexed Bonds, Multiplied by 100
(left scale)
2010200920082006 2007 2011
-40
0
40
80
120
160
200
pressure is being applied to Portugal to follow suit. However,
opposition to these efforts remains strong in much of Europe,
since these bailouts require even more draconian austerity
measures.
Here at home, many key interest rates are already at or
near record lows, a very unusual situation attributed partly to
the Fed’s unconventional policy measures (D’Amico and King
2010). While the Fed’s relaxed monetary strategy is certainly
beneficial, it will not be the motor for economic growth and
employment. In sectors of economic activity that are usually
regarded as “interest rate sensitive” (e.g., housing construc-
tion), the Fed’s policy has had minimal results. Research by
Macroeconomic Advisers, LLC, shows that even an additional
$1.5 trillion dollar bond purchase by the central bank would
reduce unemployment by only two-tenths of a percentage
point (Hilsenrath 2010). Low interest rates notwithstanding,
many firms seem to be sitting on large stocks of cash, waiting
for demand for their products to rebound. Moreover, there is
increasing tension over exchange rates among the govern-
ments of many of the world’s largest economies. This has led
to admonitions from many finance ministers around the
world that they see quantitative easing as an unfair effort to
“manipulate” the value of the dollar, as if policymakers had set
some obvious target value for the exchange rate. Some coun-
tries are now acting independently to devalue their currencies
in order to improve their trade balances. Certainly, this will be
of help domestically to many depressed economies, but it will
complicate US efforts to reduce the value of the dollar against
other currencies. Indeed, the United States and other countries
may find themselves printing large amounts of money simply
to maintain the competitiveness of their exports, and even then
face the risk of being branded as mercantilist nation-states.
Many members of the new Republican-led House of
Representatives were elected after campaigns in which they
advocated sharp cuts to government bureaucracies, an end to
federal deficits, and even a return to the gold standard (Green
2010). But we find some solace in polls showing that deficit
reduction constitutes the top policy priority for only 4 percent
of the electorate (CBS 2010), even though the radical antigov-
ernment contingent is a vocal and highly motivated voter
group. We nevertheless fear that, with a divided Congress,
nothing new and dramatic in the way of economic policy will
occur. To be sure, mainstream economic thinking, including
Levy Economics Institute of Bard College 3
that of the Congressional Budget Office (CBO) and the pres-
ident’s advisers, continues to adhere to a “stimulate now, cut
the deficit over the long run” approach to fiscal policy during
a recession. They are relatively cautious in their policy pro-
posals, despite the fact that unemployment remains extremely
high by historical standards. In the simulations reported in
this report, we use the CBO’s forecasts for some economic
variables, but even these begin with the unrealistic supposi-
tion that the economy is likely to heal itself in a baseline sce-
nario without major new stimulus packages. Like many
antideficit groups and politicians, the CBO adopts a some-
what alarmist tone and makes some assumptions that inflate
their projections of future federal debt levels (Galbraith 2010).
Recently, the leaders of the bipartisan deficit-reduction
commission put forward an initial proposal that calls for $4
trillion in budget cuts. These include deep reductions in
spending for bread-and-butter programs—including Social
Security, which helps people of modest or low income afford
necessary purchases. It is often forgotten that this program
helps reduce poverty, a goal that is especially crucial at a time
when work and family resources are scarce for an unusually
large number of Americans. Other fiscal austerity proposals
from Congress and middle-of-the-road nonprofit organiza-
tions call for a freeze on domestic discretionary spending
(e.g., see BPC 2010). (The term “discretionary” is used to refer
to spending that is not mandated by Social Security eligibility
rules or other laws, but rather allocated in every year’s federal
budgeting process.) These misguided plans mostly “backload”
spending cuts, but they involve the enactment of some spend-
ing cuts within one or two years and encourage an unfortu-
nate presumption on the part of the public that stimulus
measures should be off the agenda for the foreseeable future.
Some of the “investments” made under the Troubled
Asset Relief Program and other bailout programs have proven
to be profitable, but huge liabilities continue to accumulate
for others. These ongoing problems foster the impression that
there is already plenty of crisis-related spending, though offi-
cial measures in unemployment indicate that full recovery is
far from accomplished and many needs that are more imme-
diate and pressing remain unaddressed. While the fiscal stance
is likely to tighten further at the federal level, fiscal troubles
remain severe at the state and local levels in much of the
United States. Budget cuts are planned this year and next in
4 Strategic Analysis, March 2011
places such as New York City, which recently announced that
it would reduce its educational workforce by about 5,400 peo-
ple (Reddy 2010). Even new bond issues from the State of
California are received with skepticism by many investors, and
the new Democratic governor is acting in concert with his
Republican predecessor, who reportedly said that he must ask
for cuts to not only the fat in the state budget but also the bone
(Aneiro and Woo 2010).
Finally, as the global economy begins to revive, huge
amounts of excess reserves in the private banking system and in
sovereign portfolios around the world have generated destabi-
lizing bubbles in commodity and financial markets. Already,
capital inflows in some emerging economies have raised fears
that the ground was being laid for a repeat of the late-1990s
Asian financial crises. Many of these crises began with the
bursting of asset bubbles created by foreign investment. At this
point, the possibility of future asset booms is not among this
nation’s pressing concerns, but it reminds us that we need a bet-
ter basis for a broad-based and sustainable economic recovery.
Moreover, an uptick in inflation led by speculation in asset
markets could abruptly end efforts by some central banks to
promote higher growth rates and avert a new recession.
A closer look at the data will tell us about the economic
challenges now facing US policymakers.
More Precisely
It is by now well known that the US economy has lost millions
of jobs since the start of the Great Recession, and the ranks
of the unemployed and underemployed remain still at
stubbornly high levels. This, despite the National Bureau of
Economic Research’s Business Cycle Dating Committee, the
arbiter of business cycles, having declared that the recession
ended in June 2009.
1
Figure 2 shows the dynamics of real out-
put and the corresponding unemployment rates since 1970. It
can be seen that the Great Recession has been the longest, and
has generated the largest increase in unemployment. Even in
the 1981 recession, when the unemployment rate reached
10.8 percent, it began rising from a low of 5.9 percent at the
end of 1979—a net increase of 4.9 percent. In 2007, unem-
ployment stood at 4.4 percent and climbed to 10.1 percent—
a higher net increase of 5.7 percent. (Our figures are reported on
a quarterly basis and do not show the January and February
2011 unemployment rates, which showed some improvement.)
The rise in unemployment mirrors the drop in jobs.
Post–World War II employment as a share of the working-age
population (14–64) has fluctuated but has generally followed
the trend shown in Figure 3. When the 2007 recession began,
employment was very much below trend, with no visible
prospects of resuming its trend. In earlier recessions (shaded
areas), once recovery began, employment rehabilitation soon
followed. In the 1990, 2001, and 2007 recessions, structural
Figure 2 GDP Growth and Unemployment Rates
Unemployment Rate (right scale)
Real GDP Growth Rate (left scale)
Sources: Bureau of Economic Analysis (BEA); Bureau of Labor Statistics (BLS)
Percent
Percent
-5.0
-2.5
0.0
2.5
5.0
7.5
10.0
2
4
6
8
10
12
1970
1975
1980
1985
1990
1995
2000
2005
2010
0
Note: Shaded areas indicate recession.
Figure 3 Employment as a Share of Working-age Population
Employment
1965−2001 Employment Trend
Sources: BLS; authors’ calculations
Percent
56
58
60
62
64
66
68
54
1970
1975
1980
1985
1990
1995
2000
2005
2010
1965
Note: Shaded areas indicate recession.
changes affected the reaction of employment to output, pro-
gressively so. Notice that in the 1990 recession, employment
began falling somewhat before the downturn’s official begin-
ning, and kept falling for some time after the recession ended.
This phenomenon intensified in 2001, and is similar to the
2007 recession as well.
More than seven million jobs have been lost since the last
employment peak in November 2007, and, as of last December,
about 19 million jobs need to be created for employment to
return to its prerecession trend, adjusted for increases in the
current population. A comparison of employment trends for
all postwar recession periods
2
shows that the effects of reces-
sion on employment do not vanish after three years (the only
exception being the 1969 recession), and that employment
usually remains below its trend (Figure 4). But in December
2010, three years after the Great Recession began and a year
and a half after it officially ended, employment was still below
trend by more than 8 percent, or 19 million jobs. Significant
improvement in the employment situation is not in the off-
ing, as the Bureau of Labor Statistics report for February
shows (BLS 2011). The results from a household survey indi-
cated a very small decline in the unemployment rate, to 8.9
percent, while a separate survey of businesses found a total
Levy Economics Institute of Bard College 5
increase of 192,000 employees on US payrolls last month. In
the household survey, approximately one million people, or
about 0.6 percent of the labor force, said that they wanted to
work but were no longer bothering to look for a new job
because of a lack of employment opportunities. Over 5 per-
cent of the labor force was working part-time while searching
unsuccessfully for full-time employment.
The evolution of the US economy in 2010 has been in line
with our latest projections (Zezza 2010). In our December 2009
Strategic Analysis report (Papadimitriou, Hannsgen, and
Zezza 2009), we argued that the US government should post-
pone any measures to reduce the federal deficit. Our simula-
tions, conditional on the same assumptions, proved to be
extremely accurate in projecting employment but overly opti-
mistic in terms of real output growth, unless the final estimate
is revised upward.
We also assumed that household net borrowing, already
in negative territory, would level off as a share of income,
while borrowing by firms would slowly return to positive
values—which is roughly the situation now. These assump-
tions, together with our assumptions regarding the direction
of housing prices and the stock market and the path of fiscal
policy and net exports, implied that the economy would recover,
but with a high, and slowly declining, unemployment rate
(Figure 5). (In the last section of this report we will adopt a
Figure 4 Employment in Recessions (beginning of
recession = 100)
1980−82
1990−91
2001
Great Recession (2008−11)
Other Periods of Recession
Sources: BLS; authors’ calculations
Percent of Trend Value
35
90
92
94
96
98
100
102
104
30
25
20
1510
50
Months since Recession Began
Figure 5 GDP Growth and Unemployment Rates
2013201220102009200820072005 2006 2011
Sources: BEA; BLS; authors’ calculations
Percent
-2
0
2
4
6
8
10
12
Unemployment Rate — Actual and Projected (December 2009)
Unemployment Rate — Actual
GDP Growth Rate — Actual and Projected (December 2009)
GDP Growth Rate — Actual
-4
-6
6 Strategic Analysis, March 2011
similar set of assumptions to update our projections for the
prospects for the US economy in the medium term.)
The major determinants of consumer spending—at 70
percent the largest component of GDP—are now steadily
improving. Real wages have grown in the last two quarters,
after more than two years of precipitous decline (Figure 6),
although they are still about 4.7 percent below their prereces-
sion level. This recent growth is attributed to a moderate rise
in the real wage per worker following the decline at the onset
of the recession and the brief period of stagnation that fol-
lowed. Real wages, of course, are affected by employment
increases, and this is reflected in the numbers for the last two
quarters. Since the dynamics of real wages per worker can dif-
fer substantially among worker groups—with jobs in the
finance and management sectors seeing most of the gains in
recent decades
3
—the effects of a rise in real wages on aggregate
demand may be lower than what one might initially think.
The other major gauge of consumer spending is dispos-
able income. During this recession, real disposable income has
been sustained by a fiscal intervention that helped prevent a
further deterioration in consumption that would have impaired
growth substantially more, as shown in Figure 6. Figure 7
shows personal taxes, along with several subcategories of per-
sonal income: government transfers to individuals; employee
compensation; and personal income (including proprietors’
income, rental income, and income from assets) net of transfers.
Real disposable income has been sustained by a dramatic
fall in tax payments and large increases in transfer payments—
both significantly greater than what was registered in the 2001
recession. These are partly due to the recession—when unem-
ployment increases, so do payments for unemployment ben-
efits, et cetera—and also to specific government interventions
put in place by the Obama administration. As the figure shows,
both effects—the drop in tax revenues and the rise in trans-
fers—have begun to level off, with current transfer receipts now
at the prerecession level. If these trends continue, taxes and
transfers will not provide further stimulus to income and con-
sumption.
Household borrowing has remained negative, while it
was a major driver of the sustained aggregate demand boom
of the 2000s (Figure 8). Together with foreclosures, negative
borrowing is responsible for the decline in the stock of house-
hold debt outstanding, which fell to 117.6 percent of personal
disposable income from its peak of 130 percent in the third
quarter of 2007. It has been suggested that the decline in bor-
rowing does not necessarily imply a change in consumer atti-
tudes toward credit but is, rather, the statistical outcome of
the recent wave of bankruptcies and the resulting increase in
the number of loans written off by the institutions that held
them (Whitehouse 2010). If this were the case, we would, pre-
sumably, witness a sharp fall in the income and spending data
for specific groups of individuals who were more likely to take
Figure 6 Real Personal Disposable Income and Wages
Source: BEA
Annual Growth Rate in Percent
-6
-4
-2
0
2
4
6
8
Real Personal Disposable Income
Real Wages
2010
2005
20001990 1995
Figure 7 Determinants of Personal Disposable Income
Source: BEA
Annual Growth Rate in Percent
-30
-20
-10
0
10
20
Personal Current Transfer Receipts
Employee Compensation
Personal Income Net of Transfers
Personal Current Taxes
2010200520001990 1995
Levy Economics Institute of Bard College 7
out mortgages or loans they could not afford, but not for
social groups that were less affected by the mortgage crisis—
assuming that credit were still available to them. A plausible
outcome of this scenario would be a small increase in the aver-
age saving rate of US households. To the contrary, the saving
rate has increased dramatically—as we will discuss later—an
observation that is more in line with the view that households
have changed their habits and not simply defaulted on much
of their debt.
Changes in consumer spending habits are evident in the
data on consumer credit shown in Figure 9. Both revolving
and nonrevolving credit have been falling relative to dispos-
able income since the beginning of the recession, with the
largest share of the drop from their August 2007 peak
recorded in 2010, after the official end of the recession the
previous year. We have argued, however, that what may mat-
ter most for consumers’ decisions is not the level of debt out-
standing, but rather the debt burden relative to disposable
Figure 8 Household Borrowing and Debt
Sources: Federal Reserve; BEA
Percent of Personal Disposable Income
-4
0
4
8
12
16
Debt (right scale)
Borrowing (left scale)
2010200520001990 1995
Percent of Personal Disposable Income
90
100
110
120
130
140
80
Figure 9 Consumer Credit Outstanding
Sources: Federal Reserve; BEA
Percent of Personal Disposable Income
0
5
10
15
20
25
Total
Nonrevolving
Revolving
2010200519951980 1985 1990 2000
Figure 10 Debt Burden
Source: Federal Reserve
Percent of Personal Disposable Income
10
13
14
15
1
6
17
18
19
F
inancial Obligation Ratio
Debt-service Ratio
2010200520001980 1985
11
1
2
19951990
Figure 11 Propensity to Save Out of Disposable Income
Source: BEA
Three-month Moving Average in Percent
0
2
4
6
8
10
12
2010200519951980 1985 1990 2000
8 Strategic Analysis, March 2011
income. The overall debt burden has been declining steadily
since the recession began (Figure 10) and is now below its
2000 level, prior to the bursting of the dot-com bubble and
the start of the housing market frenzy. The shrinking debt
burden is undoubtedly a joint consequence of the decline in
total debt outstanding and low interest rates. Given that the
stock of debt is still high relative to GDP, a word of caution is
necessary here, since any rise in interest rates would quickly
reverse the downward trend. Assuming that very low interest
rates continue, further reductions in debt outstanding should
boost consumer confidence.
As mentioned above, the household saving rate has
increased significantly since the recession began. The propen-
sity of households to save out of disposable income, after
declining to an all-time low in 2005, has now jumped to about
6 percent of GDP—a level close to its value in the first half of
the 1990s, though still much lower than its peak of almost 12
percent in the early 1980s (Figure 11).
Rising assets, whether equities or housing, play a critical
role in the ability of households to borrow and spend. The
boom in equity prices was undoubtedly a major force behind
the rise in spending during the dot-com bubble, as was the
run-up in home prices prior to 2006. A widely used measure
of equity prices, the Standard & Poor 500 Index, along with a
measure of prices in the housing market, both deflated by a
general price index for consumer goods, are depicted in Figure
12. The recent data on these indexes show divergent trends after
2008, with the stock market index recovering rapidly and the
housing market remaining stagnant. Overall, the evidence
points to a modest increase in the pace of consumption, espe-
cially if real disposable income continues to rise, and an even
larger increase with the implementation of government policies
to sustain income, such as this year’s cut in payroll taxes.
Real investment, both residential and nonresidential,
began growing again in the second quarter of 2010 after a long
and dramatic fall (Figure 13). The largest increase in nonresi-
dential investment, however, was for transportation equip-
ment (56 percent in the last quarter of 2010 over the same
quarter in 2009), fueled by specific measures that have now
expired. Other components of investment also grew, including
“equipment and software” (16 percent) and “other industrial
equipment” (18 percent); these increases were not necessarily
due to macroeconomic policies. Irrespective of these signifi-
cant increases, the level of nonresidential investment is still 12
percent below its prerecession peak in the first quarter of 2008.
On the other hand, the growth in residential investment
shown in Figure 13 may be due to resales of foreclosed houses,
together with the end of the downward slide in residential
property values. The latter have stabilized in real terms since
late 2009 but remain substantially (58 percent) below their peak
in late 2005, and even below the average for the 2000s. The fig-
ure also illustrates a simple measure of aggregate profits.
4
Figure 12 Indexes of the Real Prices for Equities and
Existing Homes (1995M1=100)
Sources: S&P; National Association of Realtors
Index
120
140
160
80
160
240
320
Standard & Poor’s 500 Index (left scale)
Existing Home Price Index (right scale)
2010200520001995
Index
100
Figure 13 Profits and Investment
Source: BEA
Percent of GDP
0
10
20
6
8
10
12
14
Real Nonresidential Investment (right scale)
Real Residential Investment (right scale)
Corporate Profits (left scale)
2010200520001995
Annual Growth Rate in Percent
-30
-20
-10
Levy Economics Institute of Bard College 9
Casual observation of the trends depicted seems to suggest
that there is a lagged response of nonresidential investment to
profits.
5
It can be surmised, then, that the recent surge in cor-
porate profits, should it continue, may be an important factor
in aggregate demand growth, since no stimulus can be expected
from residential investment anytime soon.
The effects of net exports, foreign debt, the value of the
dollar, and international imbalances on the economy are also
of crucial importance. The US external balance and its com-
ponent parts are shown in Figure 14. In the last 20 years, net
exports have been a drag on aggregate demand, with imports
systematically surpassing exports. Buoyant domestic demand
in the United States, combined with a strong dollar, generated
a large and growing external trade deficit, which peaked at 6.4
percent of GDP in 2005, with the largest share (now 3.8 per-
cent) being non-oil trade. Since then, the non-oil trade deficit
has begun to drop while the ratio of oil imports to GDP has
remained relatively stable, fluctuating between 1.5 and 3.8
percent of GDP. The dollar’s decline against other currencies
(Figure 15) helped close the (non-oil) deficit, reinforced by
the effects of the recession having hit the United States more
severely than its trading partners.
If oil imports are excluded, the US external balance is
now close to a deficit of 1 percent of GDP, with the overall
external balance at 3.5 percent of GDP (see Figure 14). Oil
imports are clearly a major factor in US net current payments
to the rest of the world. Movements in the price of oil are
therefore quite important, and seem to be linked to the
dynamics of the US dollar. Figure 16 plots the aggregate,
trade-weighted nominal index of the dollar’s value, along with
a measure of the international price of oil. After 2001, oil
prices move in the opposite direction to the value of the dol-
lar: the correlation between the two figures is zero before
Figure 14 US Balance of Payments on Current Account
Percent of GDP
16
18
20
-8
-4
-2
0
2
Imports (right scale)
N
on-oil Imports (right scale)
Exports (right scale)
External Balance, Excluding Oil Imports (left scale)
External Balance (left scale)
2010200520001990
Percent of GDP
1
0
12
1
4
8
-6
1995
Source: BEA
Figure 15 US Dollar Exchange Rate Index (2000=100)
Source: Federal Reserve
Index
60
70
80
90
1
00
1
10
120
130
Broad Nominal Index
Yuan
Yen
E
uro
2008200620042000 2002 2010
Figure 16 US Dollar Nominal Exchange Rate Index
US Dollars per Barrel
100
110
120
0
80
120
160
US Dollar Nominal Exchange Rate Index (right scale)
Price of Oil (left scale)
2010200520001990
Index (2000=100)
70
80
90
60
40
1995
Sources: US Energy Information Administration; Federal Reserve
10 Strategic Analysis, March 2011
2001, and minus 0.8 from 2002 to 2010. Dollar devaluation, or
expected dollar devaluation, will push the international price
of oil upward, a fact that is consistent with oil exporters diver-
sifying their reserves away from the US dollar and/or inter-
ested in other currencies not pegged to the US dollar. A
devaluation of the US dollar, though effective (as we will
argue later) in improving the overall trade balance, will not
necessarily reduce the cost of US oil imports.
A growing trade deficit carries the implication that the
net foreign debt rises accordingly. The black line marked “net
foreign assets” in Figure 17, drawn from the Fed’s latest Flow
of Funds report (FRB 2011), shows that this sum had fallen to
roughly minus 50 percent of GDP in the third quarter of
2010. This line reflects assets and liabilities at cost rather than
at market price, and does not, therefore, consider exchange
rate changes affecting the dollar value of assets denominated
in other (appreciated) currencies. In contrast, the gray line,
drawn from Bureau of Economic Analysis data (BEA 2010a),
depicts the same history using market prices. This series now
stands at about minus 20 percent of GDP.
The United States is in an enviable position: not only can
it borrow from abroad in its own currency but it can also buy
assets denominated in strong currencies, or currencies that
are expected to appreciate. Therefore, since external deficits—
sooner or later—reduce the value of the currency of the
deficit country, the United States experiences capital gains on
its foreign financial assets denominated in nondollar curren-
cies—while the value of its dollar-denominated financial lia-
bilities does not change. The gray line shows estimates of this
effect based on information from the “US Net International
Investment Position” as reported by the BEA.
6
The blue line,
marked “net foreign direct investment,” illustrates how net
stocks of direct investment (at current values) have fluctuated
upward, reaching 8 percent of GDP in the third quarter of
2010. Apparently, foreign direct investment (FDI) has a life of
its own, independent of trade imbalances or movements of
the US dollar. American companies continue to invest in for-
eign markets at a faster pace than foreign companies do in the
United States.
Data from the Federal Reserve and the BEA show that
irrespective of the Fed’s relaxed monetary stance and the
downward pressure on the dollar, foreign central banks and
others are still willing to buy and hold dollar-denominated
assets, as detailed in Figure 18. It is interesting to note that a
major increase is registered in official holdings of US Treasury
and other government securities—which have risen to 26 per-
cent of US GDP, up from 7 percent in 2000—while private
holdings of these assets have increased from 6 percent to only
11 percent of GDP during the same period. A large increase is
also shown in foreign holdings of US corporate bonds, which
Figure 17 US Net Foreign Assets
Sources: Flow of Funds; BEA
Percent of GDP
-50
-40
-30
-20
-
10
0
10
2
0
Net Foreign Assets (BEA)
N
et Foreign Assets (Flow of Funds)
Net Foreign Direct Investment (BEA)
2
010200520001990 1995
1
980
-60
1
985
Figure 18 US Foreign Liabilities
Sources: Flow of Funds; BEA
Percent of GDP
0
2
0
40
6
0
80
100
120
Total US Liabilities
US Corporate Equities
U
S Corporate Bonds
Official Holdings of Treasury, Agency, and GSE-backed Securities
Private Holdings of Treasury, Agency, and GSE-backed Securities
FDI in the United States
2
010200520001990 1995
Levy Economics Institute of Bard College 11
now stand at 17 percent of GDP—a big jump from the 2000
level of 7 percent of GDP. US corporate equity holdings held
by foreigners, valued at cost, equaled 15 percent of US GDP in
2000 (before the dot-com crash) and were at the same value
in the second quarter of 2010, although they are now increas-
ing again. This leads us to conclude that the demand for safe
US assets is primarily from overseas central banks rather than
foreign investors wishing to diversify their portfolios. This
observation poses a serious challenge to the notion that for-
eign accumulation of US assets is a consequence of an over-
seas “saving glut.”
Figure 19 shows the net flows of income associated with the
various asset categories. Although the stock of US foreign debt
has increased considerably, its impact on interest payments has
not been dramatic so far, mainly due to the decline of interest
rates. Net interest payments for foreign liabilities other than
FDI have increased to 0.7 percent of GDP. On the other hand,
the US benefits from large income flows on FDI, on a scale
that is puzzling.
7
US net property income from direct invest-
ment is 1.9 percent of GDP, and more than offsets interest pay-
ments on its outstanding foreign debt. This may be due to
accounting incentives for US-based corporations with operat-
ing units abroad to repatriate comparably higher profits, while
overseas firms operating in the United States (with perhaps
lower profits) choose not to do so.
We can obtain a simple measure of the ex-post rates of
return on foreign investment by dividing the reported flow-
of-income payments from the BEA to the initial stock of FDI
valued at current costs. The conclusion from such a calcula-
tion is that the return on FDI in the United States is very low
in comparison to the return US investors earn abroad.
The indexes of global imbalances shown in Figure 20 are
constructed using the mean of the absolute values of the cur-
rent account balances of 169 countries
8
and scaling them in
relation to both world GDP and total world exports, with all
variables measured in current US dollars. The indexes cover a
30-year period (1980–2010), with 2010 data—and at times,
2009 data—projected by the International Monetary Fund
(IMF 2010b). Countries with missing data after 1992 were
taken out of the sample. The chart shows that, in spite of the
index’s decrease during the Great Recession, there are still
many countries spending more than their income and relying
on other countries to finance the imbalance.
The current account balances of some key US trading
partners have moderated since the start of the Great
Recession. Similarly, the US current account deficit decreased to
about 3.6 percent of GDP from its all-time high of 6.3 percent
in 2005. Figure 21 reports the current account balance of var-
ious countries and groups of countries as a percentage
of US GDP. As we observed in Figure 14, the United States
Source: BEA
Percent of GDP
-0.4
0
0.4
0
.8
1.2
1.6
2
.0
2.4
N
et Income from Direct Investment
Net Property Income
Net Income from Financial Assets
2
010200520001990 19951980 1985
-
0.8
-1.2
Figure 19 Net Income Payments from Abroad
Figure 20 Indexes of Global Imbalances
Source: IMF
Percent
1
2
3
4
5
6
7
Global Exports (right scale)
Global GDP (left scale)
2010200520001980 19951985
Percent
8
10
12
14
1
6
18
20
1990
12 Strategic Analysis, March 2011
continues to face a significant challenge in rectifying its trade
deficit, a large part of which is made up of oil imports.
Looking more closely at Figure 21 through the exchange-
rate lens of Figure 15, we cannot fail to notice that the deval-
uation of the dollar against the euro has been effective in
reducing the US trade deficit with the eurozone. The (smaller)
revaluations of the Chinese yuan and Japanese yen have been
less effective. The deficit with OPEC trading partners and
Russia is sizable, and, as we observed earlier, highly dependent
on the movement of oil prices. Japan and Germany rely heav-
ily on exports, but the eurozone as a whole is now roughly in
balance, since Germany’s surplus is offset by the deficits of the
other member countries.
Three Strategic Scenarios
Underlying the main conclusions of this Strategic Analysis is
an econometric model in which exports, imports, taxes, and
public and private expenditures are functions of world trade,
relative prices, tax rates, stocks of debt, and flows of net lend-
ing. In what follows, we present projections of US economic
performance between now and 2015. These projections are
not forecasts, especially not short-term forecasts. We have
exercised care to ensure that they are consistent with recent
developments and with a significant number of the indicators
that we have presented above. Our interest in making these
conditional projections is to describe major strategic challenges,
broadly conceived, that are likely to arise over the next five years,
and to consider alternative strategies to deal with them.
Baseline Scenario
Our baseline scenario has been constructed, as usual, using a
set of assumptions that is as neutral as possible. Our projec-
tions for output and inflation in US trading partners is from
the IMF “World Economic Outlook Update,” issued in July
2010 (IMF 2010a). In addition, we adopt the revised CBO
projections for fiscal policy that imply a declining deficit for
the federal government (CBO 2011). Assuming that state and
local government deficits stabilize in terms of GDP, we repli-
cate the CBO dynamics of fiscal policy for the US general gov-
ernment. Since the CBO’s projections are based on the current
state of legislation, they include the recently enacted compro-
mise bill, which includes a two-year extension of the Bush tax
cuts, reductions in payroll taxes, and extensions of unemploy-
ment benefits, as well as other changes to government expen-
ditures and transfers.
We assume that households keep paying down their debt,
although at a slower pace, while nonfinancial businesses get
back to positive net borrowing. These assumptions are not
inconsistent, in our view, with the latest figures on credit,
which show only a modest increase in consumer debt out-
standing for December 2010 and January 2011, following
several months of decline. The latest data on the stock of
mortgages, which is much larger than the sum of outstanding
consumer credit, are consistent with our assumptions.
We further assume a stable US dollar exchange rate as
well as stable interest rates and relative prices, including the
price of oil—although this assumption may prove faulty given
the recent spike in oil prices due to the political upheavals in
the Middle East. Should the situation in these countries dete-
riorate, the path of the financial balances would change dra-
matically. We nevertheless remain optimistic that things will
calm down and prices will return to their pre-upheaval level.
CBO projections frequently underestimate the future
path of government deficits. In recognition of this bias,
the revised projections (CBO 2011) attempt to correct it by
Figure 21 Balance of Payments on US Current Account
Sources: BEA; IMF
Percent of GDP
-
8
-6
-4
-2
0
2
4
Japan
E
urozone
Germany
OPEC and Russia
China
United States
2
010200520001990 1995
Levy Economics Institute of Bard College 13
providing an alternative projection for the government
deficit. Under the CBO’s hypothesis of a “continuation of cer-
tain policies,”
9
the projected deficit stabilizes at around 4.6
percent of GDP in 2015.
In our baseline scenario, the main sector balances slowly
move toward sustainable levels: by the end of the simulation
period, the external balance is zero, private sector net saving
goes back to about 4.6 percent of GDP—still high with
respect to its prebubble average—and the budget deficit, also
at 4.6 percent of GDP, becomes a mirror image of private sec-
tor net saving (Figure 22). These projected sectoral balances
are broadly in line with the CBO’s GDP projection, with our
measure of the public sector deficit at all levels of government
going down by 5.4 percent of GDP by the end of the simula-
tion period in 2015. The two-year relaxation of fiscal policy
contributes to an increase in the real GDP growth rate (to
about 3.8 percent), but economic growth declines subse-
quently as a result of the expiration of the fiscal stimulus in
2012. The increase in taxation and moderation in government
expenditure in that year will reduce GDP growth slowly, to
just below 2 percent by 2015. This is a scenario of “growth
recession,” in which unemployment declines to 8.6 percent at
the beginning of 2012 but then increases and stabilizes at a
high, and undesirable, level of about 9.4 percent by the end of
the simulation period (Figure 23). Our own assumptions take
into consideration our belief that the slowdown in US growth
will not have a large impact on US trading partners and that
slower growth in the United States will improve the US exter-
nal balance, which will reach zero by 2015. Government debt
will not decrease, since the government deficit, as a share of
GDP, remains higher than the GDP growth rate for most of
our simulation period. The deficit, however, will tend to sta-
bilize as a share of GDP, and both foreign and private sector
debt will decrease as a share of GDP.
To sum up, the simulations in our baseline scenario,
using neutral assumptions about what is likely to happen and
the revised CBO projection of fiscal policy under current leg-
islation, show that the private sector will continue to reduce
its debt and the external deficit will disappear, but unemploy-
ment will stabilize at a high level. The simulations also show
that the current attempt to address the public deficit “prob-
lem” by cutting spending will not meet with success.
Scenario 1: An Enhanced Fiscal Stimulus
Viewing the results of the baseline scenario simulations, we
think it is inconceivable that things would turn out as depicted,
especially during a presidential election season in 2012.
Reducing unemployment would become urgent, as will spend-
ing on infrastructure, education, research and development,
and other government investment. In our “enhanced fiscal
Source: Authors’ calculations
Percent
-
6
-4
-
2
0
2
4
6
G
overnment Deficit (right scale)
External Balance (right scale)
Private Sector Investment minus Saving (right scale)
Real GDP Growth (left scale)
200520001990 1995 2015
Figure 22 Baseline Scenario: US Main Sector Balances and
Real GDP Growth
Percent of GDP
-10
-
5
0
5
10
1
5
2010
Source: Authors’ calculations
Percent
3
4
5
6
7
8
9
10
Baseline
Scenario 1
Scenario 2
2010200520001990 1995 2015
Figure 23 Unemployment Rate in Three Scenarios
14 Strategic Analysis, March 2011
stimulus” scenario, we project the outcome of deferring the
adjustment to the public sector deficit assumed in the baseline
scenario. We assume that government expenditure continues
to grow, in real terms, at its prerecession average (2 percent for
government expenditure on goods and services, and 4 percent
for government transfers
10
), and that tax rates are kept at their
current level. All other assumptions remain the same as in the
baseline scenario. Figure 24 illustrates the possible outcome
for the three financial balances under these assumptions.
Output grows faster in this scenario, allowing unemployment
to drop just below 8 percent (Figure 23) by the end of the sim-
ulation period. Faster growth, on the other hand, results in a
larger foreign deficit, which exceeds 2 percent of GDP.
The main points to be made about this scenario are, first,
the relaxation in the fiscal policy (compared with what is now
projected by the CBO) would have to be so large that the gen-
eral government deficit would rise to over 7.8 percent, an
increase of more than 3 percent from the baseline scenario.
Second, if unemployment is to be significantly reduced, by
our reckoning, there would have to be a fiscal stimulus much
larger than the one assumed.
Scenario 2: Filling the Gap in Aggregate Demand
with Exports
Three strategies can be put in place to fill the gap in aggregate
demand and reduce unemployment: stimulating private
investment, trying to bring about an increase in net exports,
or relaxing the government’s fiscal stance. Several commenta-
tors point out that the most likely effect of QE2 will be on the
value of the US dollar. A dollar devaluation will reduce the
cost of US exports in foreign markets, and increase the dollar
price of US imports: the first effect will directly contribute to
US aggregate demand, while the second effect may be benefi-
cial to domestic demand if it stimulates import substitution.
A likely price to pay for dollar devaluation is that—when
expectations of a devaluation increase—speculators invest in
commodities priced in dollars, such as oil, driving up the price
of such commodities. Since the amount of US oil imports is
still large, at 2.4 percent of GDP, increases in the price of oil
will prove to be costly, in the short term, for US balance of
trade, and possibly for domestic prices—although the correla-
tion between the price of oil and domestic prices in the United
States seems to be much weaker than in previous decades.
But what would be the most effective way to increase US
net exports? If we look at the breakdown of US trade by coun-
try/region (Figure 21) and compare it with changes in the US
dollar exchange rate (Figure 15), we see that exchange rate
movements are not sufficient to close trade gaps with individ-
ual countries. Relative to 2000, the dollar is now devalued by
about 20 percent against the yen—with most of the devalua-
tion in the last three years—yet the trade deficit with Japan
has remained relatively stable at 0.5–1 percent of US GDP. The
devaluation against the yuan is about 24 percent, with most of
it occurring in the last two years, but the trade gap with China
has widened. Only the dollar’s devaluation against the euro,
which started earlier, has been recently associated with an
improvement in the US trade balance with members of the
eurozone. These figures seem to suggest that a revaluation of
the currency of surplus countries may be more effective in
closing trade gaps than a general devaluation of the dollar.
Besides, if devaluation is brought about by an increase in liquid-
ity provided by the Fed, which is then channeled by interna-
tional monetary markets toward countries with relatively high
rates of return, the currencies that will appreciate are not neces-
sarily those of surplus countries. The Chinese government,
Source: Authors’ calculations
Percent
-
6
-4
-
2
0
2
4
6
Government Deficit (right scale)
E
xternal Balance (right scale)
Private Sector Investment minus Saving (right scale)
Real GDP Growth (left scale)
2010200520001990 1995 2015
Figure 24 Scenario 1: US Main Sector Balances and Real
GDP Growth
Percent of GDP
-10
-
5
0
5
10
15
Levy Economics Institute of Bard College 15
which can control or prohibit short-term capital inflows into its
financial markets, may hold the power to prevent monetary eas-
ing in the United States from affecting the value of the yuan.
A coordinated realignment of currencies—or, even better,
some reforms of international monetary institutions—would
therefore be preferable to a devaluation of the dollar, and pro-
posals for reforms are being discussed more and more fre-
quently.
11
But reforms take time and may not be feasible in the
short term. Therefore, exchange rate movements—or the intro-
duction of tariffs—seem a more likely way out in the short term.
In our export-led growth scenario, we examine the effects
of a devaluation of the US dollar against all other currencies,
as measured by the broad exchange rate index published by
the Fed. Since the exchange rate index of the dollar against
other major currencies is almost at a historic low, such a
devaluation will imply in our model that the euro (and the
yen) will rise to very high values, imparting a deflationary
impulse to these areas. The eurozone absorbs US exports in an
amount equal to 3 percent of US GDP, so a slowdown in this
area will offset at least part of the effects of the dollar’s deval-
uation against the euro.
We assume a devaluation of 10 percent starting in the
second quarter in 2011, with no effects on the price of com-
modities, including oil. Our simulations show that the impact
on trade will be substantial by the end of the simulation
period, with the United States achieving a deficit of 1 percent
of GDP (Figure 25). The government deficit will also improve,
falling to 6.7 of GDP, since higher GDP growth (exceeding 5.5
percent in 2012 and slowing thereafter to 3 percent) and lower
unemployment imply larger revenues and less public expen-
diture. However, the impact of the devaluation on GDP
implies an additional reduction in the unemployment rate of
0.8 percentage point, and is therefore not sufficient to change
the United States’ path toward stagnating growth.
Conclusions
Our policy message is fairly simple, and consistent with that
of previous Levy Institute Strategic Analyses—a fact that is
not coincidental, given that events over the years have tended
to vindicate the approach we have advocated since the late
1990s (e.g., see Godley, Izurieta, and Zezza 2004). The years
since this series began have seen huge amounts of private and
public borrowing (albeit with their relative proportions shift-
ing over time). Since this century began, most commentators,
policy-oriented economists, and political leaders have argued
for reductions in government borrowing, but few have
pointed out the potential instabilities that could arise from
a growth strategy based largely on private borrowing. The
recent financial crisis has shown that Hyman P. Minsky (2008
[1986]) was right to criticize an unstable system in which pol-
icy permits private debt to explode. A return to normalcy will
occur only if US companies find customers other than domes-
tic ones. As the Financial Times’ Martin Wolf (2010) put it,
The crucial point is that the US can reduce its huge
fiscal deficits, without pushing the country into a
deep slump, if and only if other sectors expand
spending, relative to incomes. This is unlikely to hap-
pen in the US private sector, to a sufficient extent,
though some expansion of investment is plausible. A
good part of the needed adjustment must come from
expansion of foreign spending relative to income—
in other words, a reduction in the structural current
account deficit.
Source: Authors’ calculations
Percent
-6
-4
-
2
0
4
6
2
G
overnment Deficit (right scale)
External Balance (right scale)
Private Sector Investment minus Saving (right scale)
Real GDP Growth (left scale)
2010200520001990 1995 2015
Figure 25 Scenario 2: US Main Sector Balances and Real
GDP Growth
Percent of GDP
-10
-5
0
5
1
0
15
16 Strategic Analysis, March 2011
Hence, we have often suggested measures to reduce the trade
deficit, including devaluations (e.g., Papadimitriou, Hannsgen,
and Zezza 2008). The current account balance has improved
and seems to be righting itself, even in our baseline scenario.
So far, however, this return toward balance has occurred
mostly as a reaction to financial collapse and a deep recession,
not as a result of successful economic policy.
Ideally, countries with large surpluses should focus on
increasing their populations’ consumption levels. In the
absence of an internationally coordinated stimulus, though,
aggressive domestic policy is crucial for countries that are
running current account deficits. Domestic monetary and fis-
cal stimulus measures have helped and continue to do so
(Blinder 2010; Blinder and Zandi 2010). With the economy
operating at far less than full employment, we think
Americans will ultimately have to grit their teeth for some
hair-raising deficit figures, but they should take heart from
recent data showing record-low “core” CPI inflation
(Dougherty 2010). In the next few months, policymaking will
be hampered by political rhetoric and realities in Washington,
and hence deficits will probably remain far below the levels
needed to bring about a strong recovery. On the other hand,
export-led growth has the potential to begin reducing unem-
ployment. Given the likely political tenor of the new
Congress, we consider only a moderate fiscal stimulus in this
analysis, finding that growth prospects are somewhat
improved in a scenario combining a stimulus with devalua-
tion. Specifically, the unemployment rate declines to about 7
percent by the end of our simulation period. While the poli-
cies tested in scenario 2 can only be described as stopgap
measures, they could prevent a downward financial and eco-
nomic spiral. Hence, it will be important for President Obama
and Congress to negotiate a mutually acceptable fiscal expan-
sion, despite the difficulties involved in doing so with a
divided legislature.
Notes
1. See NBER (2010a, 2010b).
2. For an analysis of employment in recessions, see also
Shierholz (2011).
3. See Arestis, Fontana, and Charles (2011).
4. For corporate profits with inventory valuation and capi-
tal consumption adjustments, see National Income and
Product Accounts Table 1.12, line 13 (BEA 2011).
5. This observation has been confirmed by exploratory
econometric analysis, which shows a long-run response
of investment to profits of about 0.5—that is, an increase
in real profits of 1 percent implies a long-run increase in
investment of 0.5 percent.
6. As an example of the relevance of changes in the value of
assets, consider the US stock of financial assets (excluding
derivatives) at year-end 2008, which were equal to $13.1
trillion, or 93 percent of GDP (BEA 2010b). The value of
financial assets at year-end 2009 was $14.9 trillion, or 103
percent of GDP, with the $1.8 trillion increase due to net
purchases of new assets ($140 billion, or 8 percent of the
increase), price appreciation of existing assets ($1.1 tril-
lion, or 61 percent of the increase), and exchange rate
changes that led to a change in the dollar value of assets
($358 billion, or 20 percent of the increase). The residual
$185 billion is due to other reasons, such as changes in
coverage or capital gains/losses of direct investment affil-
iates, or changes in positions that cannot be allocated to
financial flows or fluctuations in either prices or the
exchange rate. For US liabilities, 32 percent of the increase
from 2008 to 2009 was due to new debt and 56 percent to
the increase in the market value of US assets held by for-
eigners. Only 8 percent of the increase was due to exchange
rate movements.
7. See Gourinchas and Rey (2005) for a discussion of this
phenomenon.
8. The countries in the index are: Albania, Algeria, Angola,
Antigua and Barbuda, Argentina, Armenia
1
, Australia,
Austria, Azerbaijan
1
, The Bahamas, Bahrain, Bangladesh,
Barbados, Belarus
1
, Belgium, Belize, Benin, Bhutan,
Bolivia, Botswana, Brazil, Brunei Darussalam
5
, Bulgaria,
Burkina Faso, Burundi, Cambodia
4
, Cameroon, Canada,
Cape Verde, Central African Republic, Chad, Chile, China,
Colombia, Comoros, Democratic Republic of Congo,
Republic of Congo, Costa Rica, Côte d’Ivoire, Croatia
1
,
Cyprus, Denmark, Djibouti
2
, Dominica, Dominican
Republic, Ecuador, Egypt, El Salvador, Equatorial Guinea,
Eritrea
1
, Ethiopia, Fiji, Finland, France, Gabon, The
Gambia, Germany, Ghana, Greece, Grenada, Guatemala,
Levy Economics Institute of Bard College 17
Guinea, Guinea-Bissau, Guyana, Haiti, Honduras, Hong
Kong SAR, Hungary, Iceland, India, Indonesia, Islamic
Republic of Iran, Ireland, Israel, Italy, Jamaica, Japan,
Jordan, Kazakhstan
1
, Kenya, Kiribati, Korea, Kuwait,
Kyrgyz Republic
1
, Lao People’s Democratic Republic,
Latvia
1
, Lebanon, Lesotho, Libya, Lithuania
1
, Former
Yugoslav Republic of Macedonia
2
, Madagascar, Malawi,
Malaysia, Maldives, Mali, Mauritania, Mauritius, Mexico,
Moldova
1
, Mongolia
2
, Morocco, Mozambique, Myanmar,
Namibia
3
, Nepal, Netherlands, New Zealand, Nicaragua,
Niger, Nigeria, Norway, Oman, Pakistan, Panama, Papua
New Guinea, Paraguay, Peru, Philippines, Poland,
Portugal, Qatar, Romania, Russia
1
, Rwanda, Samoa, São
Tomé and Príncipe, Saudi Arabia, Senegal, Seychelles,
Sierra Leone, Singapore, Slovenia
1
, Solomon Islands,
South Africa, Spain, Sri Lanka, St. Kitts and Nevis, St.
Lucia, St. Vincent and the Grenadines, Sudan, Suriname,
Swaziland, Sweden, Switzerland, Syrian Arab Republic,
Taiwan Province of China, Tajikistan
1
, Tanzania,
Thailand, Togo, Tonga, Trinidad and Tobago, Tunisia,
Turkey, Turkmenistan
1
, Uganda, Ukraine
1
, United Arab
Emirates, United Kingdom, United States, Uruguay,
Uzbekistan
1
, Vanuatu, Venezuela, Vietnam, Republic of
Yemen
3
, Zambia, Zimbabwe. (
1
From 1992;
2
from 1991;
3
from 1990;
4
from 1986;
5
from 1985.)
9. See CBO (2011), 21–24, and Figures 1-4 and 1-5. “The
projected deficit with the continuation of certain policies
is based on several assumptions: First, that provisions of
the Tax Relief, Unemployment Insurance Reauthorization,
and Job Creation Act of 2010 (Public Law 111-312) that
originally were enacted in 2001, 2003, or 2009, or that mod-
ified estate and gift taxation do not expire on December 31,
2012, but instead continue; second, that the alternative
minimum tax is indexed for inflation after 2011; and
third, that Medicare’s payment rates for physicians are
held constant at their 2011 level” (CBO 2011, 16).
10. Our model endogenously determines some transfers
that depend on the business cycle (e.g., unemployment
benefits), so our assumption is related to other transfers.
11. See Zoellick (2010) and Zhou (2009), among others.
References
Aneiro, M., and S. Woo. 2010. “California Bond Deal Bodes
Ill for States.” The Wall Street Journal, November 18.
Arestis, P., G. Fontana, and A. Charles. 2011. “Critique of
Financialization and the US Unemployment Gender
Gap.” Paper presented at the Association for Social
Economics panel on “Social Economics of the Financial
Crisis,” Annual Meeting of the Allied Social Science
Associations, Denver, Colo., January 7.
Bipartisan Policy Center (BPC). 2010. “Restoring America’s
Future: Reviving the Economy, Cutting Spending and
Debt, and Creating a Simple, Pro-growth Tax System.”
Washington, D.C.: BPC. November 17.
Blinder, A. 2010. “ In Defense of Ben Bernanke.” The Wall
Street Journal, November 15.
Blinder, A. S., and M. Zandi. 2010. “How the Great Recession
Was Brought to an End.” Princeton, N.J.: Princeton
University. July 27.
Bureau of Economic Analysis (BEA). 2010a. “U.S. Net
International Investment Position at Yearend 2009.”
News Release BEA 10-32. Washington, D.C.: BEA. June 25.
———. 2010b. “National Income and Product Accounts
Gross Domestic Product, 3rd quarter 2010 (advance esti-
mate).” News Release. Washington, D.C.: BEA. October 29.
———. 2011. “National Income and Product Accounts Table
1.12: National Income by Type of Income.” Washington,
D.C.: BEA. March.
Bureau of Labor Statistics (BLS). 2011. “February
Employment Report.” Washington, D.C.: BLS. March 7.
CBS News. 2010. “CBS News Poll on President Obama and
the 112th Congress,” November 11.
Congressional Budget Office (CBO). 2011. “The Budget and
Economic Outlook: Fiscal Years 2011 to 2021.”
Washington, D.C.: CBO. January.
D’Amico, S., and T. B. King. 2010. “Flow and Stock Effects of
Large-Scale Treasury Purchases.” Finance and
Economics Discussion Series 2010-52. Washington,
D.C.: Federal Reserve Board. September.
Dougherty, C. 2010. “Inflation Virtually Flat: A Still-weak
Economy Keeps Prices Down Even as Fed Actions Draw
Fire.” The Wall Street Journal, November 18.
18 Strategic Analysis, March 2011
Federal Reserve Board (FRB). 2011. “Flow of Funds Accounts
of the United States: Fourth Quarter 2010, March 10,
2011.” Washington, D.C.: Federal Reserve.
Galbraith, J. K. 2010. “There Is No Economic Justification for
Deficit Reduction.” Statement to the Commission on
Deficit Reduction, Washington, D.C., June 30.
Godley, W., A. Izurieta, and G. Zezza. 2004. Prospects and
Policies for the US Economy: Why Net Exports Must Now
Be the Motor for US Growth. Strategic Analysis.
Annandale-on-Hudson, N.Y.: Levy Economics Institute
of Bard College. August.
Gourinchas, P., and H. Rey. 2005. “From World Banker to
World Venture Capitalist: US External Adjustment and
the Exorbitant Privilege.” Working Paper No. 11563.
Washington, D.C.: National Bureau of Economic
Research. August.
Green, J. 2010. “The Tea Party’s Brain.” The Atlantic 306, no. 4
(November).
Hilsenrath, J. 2010. “Fed Fires $600 Billion Stimulus Shot.”
The Wall Street Journal, November 4.
International Monetary Fund (IMF). 2010a. “World Economic
Outlook Update: Contractionary Forces Receding but
Weak Recovery Ahead.” Washington, D.C.: IMF. July 8.
———. 2010b. “World Economic and Financial Surveys:
World Economic Outlook Database.” Washington, D.C.:
IMF. October.
Krugman, P. 2010. “This Is the Way the Euro Ends.” The
Conscience of a Liberal Blog, comment posted
November 18, />2010/11/18/this-is-the-way-the-euro-ends/.
Minsky, H. P. 2008 (1986). Stabilizing an Unstable Economy.
New York: McGraw-Hill.
National Bureau of Economic Research (NBER). 2010a. “US
Business Cycle Expansions and Contractions.”
Cambridge, Mass.: NBER. September 20.
———. 2010b. Report of the Business Cycle Dating
Committee. Cambridge, Mass.: NBER. September 20.
Papadimitriou, D. B., G. Hannsgen, and G. Zezza. 2008. “The
Buffet Plan for Reducing the Trade Deficit.” Working
Paper No. 538. Annandale-on-Hudson, N.Y.: Levy
Economics Institute of Bard College. July.
———. 2009. Sustaining Recovery: Medium-term Prospects
and Policies for the US Economy. Strategic Analysis.
Annandale-on-Hudson, N.Y.: Levy Economics Institute
of Bard College. December.
Reddy, S. 2010. “Budget Cuts to Affect All Areas of City:
Mayor Slashes $1.6 Billion; Orders Layoffs.” The Wall
Street Journal, November 19.
Shierholz, H. 2011, “Labor Force Smaller Than before
Recession Started.” Washington, D.C.: Economic Policy
Institute. January 7.
Whitehouse, M. 2010. “Defaults Account for Most of Pared
Down Debt.” The Wall Street Journal, September 18.
Wolf, M. 2010. “How to Chart a Course Out of the Sino-
American Storm.” Financial Times, November 18.
Zezza, G. 2010. Getting Out of the Recession? Strategic
Analysis. Annandale-on-Hudson, N.Y.: Levy Economics
Institute of Bard College. March.
Zhou, X. 2009. “Reform the International Monetary System.”
BIS Review 41/2009. Basel, Switzerland: Bank for
International Settlements. March 23.
Zoellick, R. 2010. “The G20 Must Look Beyond Bretton
Woods.” Financial Times, November 7.
Recent Levy Institute Publications
STRATEGIC ANALYSIS
Jobless Recovery Is No Recovery: Prospects for the US
Economy
. , , and
March 2011
Getting Out of the Recession?
March 2010
Sustaining Recovery: Medium-term Prospects and Policies
for the US Economy
. , , and
December 2009
Levy Economics Institute of Bard College 19
PUBLIC POLICY BRIEFS
It's Time to Rein In the Fed
and .
No. 117, 2011
An Alternative Perspective on Global Imbalances and
International Reserve Currencies
No. 116, 2010
What Should Banks Do?
A Minskyan Analysis
.
No. 115, 2010
Debts, Deficits, Economic Recovery, and the U.S.
Government
. and
No. 114, 2010 (Highlights, No. 114A)
Endgame for the Euro?
Without Major Restructuring, the Eurozone Is Doomed
. , . , and
No. 113, 2010 (Highlights, No. 113A)
POLICY NOTES
What Happens if Germany Exits the Euro?
2011/1
A New “Teachable” Moment?
2010/4
Why the IMF Meetings Failed, and the Coming Capital
Controls
2010/3
Global Central Bank Focus: Facts on the Ground
2010/2
WORKING PAPERS
Financial Markets
No. 660, March 2011
Minsky Crisis
.
No. 659, March 2011
Keynes after 75 Years: Rethinking Money as a Public
Monopoly
.
No. 658, March 2011
What Does Norway Get Out Of Its Oil Fund, if Not More
Strategic Infrastructure Investment?
No. 657, March 2011
Money in Finance
.
No. 656, March 2011
A Minskyan Road to Financial Reform
.
No. 655, March 2011
Measuring Macroprudential Risk: Financial Fragility
Indexes
No. 654, March 2011
Financial Keynesianism and Market Instability
.
No. 653, March 2011
The Dismal State of Macroeconomics and the Opportunity
for a New Beginning
.
No. 652, March 2011
Nonprofit Organization
U
.S. Postage Paid
B
ard College
B
lithewood
P
O Box 5000
Annandale-on-Hudson, NY 12504-5000
A
ddress Service Requested