Prospects and policies for the united states
Bạn đang xem bản rút gọn của tài liệu. Xem và tải ngay bản đầy đủ của tài liệu tại đây (908.04 KB, 20 trang )
Levy Economics Institute of Bard College
Strategic Analysis
October 2013
RESCUING THE RECOVERY:
PROSPECTS AND POLICIES FOR THE
UNITED STATES
. , , ,
and
Introduction
The main arguments in this report can be simply stated:
If Congressional Budget Office (CBO 2013) projections of government revenues and
outlays come to pass, the United States will not grow fast enough to bring down the
unemployment rate between now and 2016. The public sector deficit will decline from
present levels, endangering the sustainability of the recovery.
Net saving (saving less investment) by the private sector is slowly declining from its
peak in the fall of 2008, and if this variable merely behaves in accordance with histori-
cal norms, weak private sector demand will put pressure on the economic recovery.
If confidence is restored in financial institutions and markets and lending returns
to prebubble normal levels, private expenditure will continue to increase, helping the
economy to sustain the recovery. Net saving will then gradually be restored to its pre-
bubble level, with a slower reduction in the private sector’s debt-to-GDP ratio.
A public sector stimulus of a little over 1 percent of GDP per year dedicated to phys-
ical infrastructure investment would help counter the continuing drop in private expen-
diture, reducing unemployment to a more acceptable level by 2016. The government
deficit will not decline as rapidly, but will range between 5 and 6 percent.
The Levy Institute’s Macro-Modeling Team consists of President Dimitri B. Papadimitriou and Research Scholars Greg Hannsgen, Michalis
Nikiforos, and Gennaro Zezza. All questions and correspondence should be directed to Professor Papadimitriou at 845-758-7700 or
of Bard College
Levy Economics
Institute
A public sector stimulus of the same magnitude and
duration but focused on export-oriented R & D invest-
ment will increase US competitiveness through
export price effects, resulting in a rise of net exports,
and slowly lower unemployment to less than 5 percent
by 2016. The improvement in net export demand will
allow the US economy to enter a period of aggregate
demand rehabilitation, with very encouraging conse-
quences at home.
R & D investment will arrest the long-term decline
of the manufacturing sector and return the United
States to its past preeminent and competitive position
in the high-technology sector.
The policy measures simulated in this report
would be strongly impaired if conditions in the
household sector were such that the sector had to
concentrate on paying down its debt. Indeed, this
would be consistent with recent trends, and key finan-
cial ratios remain out of line with historical norms.
Hence, the “deleveraging” process of the past six years,
which has steadily reduced the ratio of aggregate
household debt to GDP, is all too likely to continue.
In July, the US Bureau of Economic Analysis (BEA 2013)
released a five-year revision of the national income and product
accounts (NIPA), the basis for GDP data.
1
The revision incor-
2 Strategic Analysis, October 2013
porates both definitional and statistical changes. Briefly, new
international accounting standards have led to the following
changes in NIPA data released during the summer: (1) the addi-
tion to fixed investment of expenditures on R & D, the develop-
ment of artistic originals, and some real estate transfer costs to
capital investment; (2) a harmonization of the accounting treat-
ment of wages and salaries; and (3) the use of accrual account-
ing for the transactions of defined-benefit pension funds. The
projections for the paths of growth, employment, and the three
sectoral financial balances make use of the revised data.
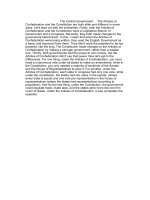
Figures 1 through 3 illustrate the changes in the three
financial balances between the new and old versions of the
NIPA series. The scales for Figures 1 and 2 are inverted so that
a deficit for the private or public sector appears as a surplus, and
vice versa. Figure 3 has an uninverted scale, so that deficits
appear in that figure as negative observations. The NIPA data
revisions have the effect of increasing the private sector balance
and decreasing the public sector balance for the period shown
in the figure, resulting in a downward shift in the former and an
upward shift in the latter (see Figures 1 and 2). Figure 3 shows
that the external balance, depicted on an uninverted scale, is
greater in the revised figures than those computed from the pre-
revision dataset. Owing to the offsetting effects of changes in the
two domestic balances, this latter balance—which encompasses
imbalances with all other countries in both trade and income
payments—is not dramatically affected by the revisions.
Figure 1 Private Sector Investment minus Saving
Sources: Bureau of Economic Analysis (BEA); authors’ calculations
Percent of GDP
-12
-10
-4
-2
0
2
4
6
Old
Revised
2009Q1
2008Q1
2007Q1
2005Q1
2006Q1
2010Q1
2012Q1
2011Q1
2013Q1
-6
-8
Figure 2 Government Deficit
Percent of GDP
0
2
4
6
8
10
12
14
Sources: BEA; authors’ calculations
Old
Revised
2009Q1
2008Q1
2007Q1
2005Q1
2006Q1
2010Q1
2012Q1
2011Q1
2013Q1
From the standpoint of projecting future economic activ-
ity in the context of our modeling approach, the main trends
in the three balances shown in the figures seem to be contin-
uing much as before: (1) in spite of high unemployment and
a modest recovery in output growth, the domestic private sec-
tor still appears to be gradually regaining its sea legs for
deficit-financed spending, a process begun after the last reces-
sion; (2) the general government deficit has continued to plunge
from its recessionary peak of more than 12 percent of GDP to
slightly above 7 percent of GDP in 2013Q1, reflecting eco-
nomic recovery as well as the pressures of the 2011 Budget
Control Act and the ensuing spending sequester; and (3) the
current account deficit has remained fairly steady for some time
at around 3 percent of GDP, presenting a picture of stability.
Yet there are signs that the economy is still in deep trou-
ble. It suffers from very low rates of employment per working-
age person, and, given this situation, new jobs are being
created at a rate that is far too slow. Falling official unemploy-
ment rates largely reflect a shrinking workforce (Nikiforos
2013a; Papadimitriou, Hannsgen, and Nikiforos 2013). Long-
term unemployment in particular is very high, a situation that
generally leads to a loss of work readiness over time.
The predicament we see in the figures so far is in the
opposition between (1) the slow private sector deleveraging
process since the financial crisis and real estate bust (seen in
Levy Economics Institute of Bard College 3
Figure 1), as well as the unheralded trend toward eurozone-
style austerity in the US government sector; and (2) the need
to accelerate economic growth in order to bring down the
unemployment rate, reverse the recent decline in household
income, and increase state and local tax revenues.
In the United States, consumer credit is a key driver of
household spending. This category of credit is reported in two
subcategories: revolving credit and nonrevolving credit. The
former subcategory includes credit card debt and home-equity
lines of credit, while the latter includes student loans and loans
for consumer durables, such as clothing, automobiles, trucks,
and furniture. The rate of growth of nominal nonrevolving
consumer credit has been strong relative to rates observed in
the years immediately following the financial crisis of
2008–09, with the Federal Reserve’s revised second-quarter
number reaching 6.8 percent per annum. (Except where we
indicate otherwise, the data in our figures is seasonally
adjusted.) This increase followed a 7.3 percent increase for the
previous quarter, according to revised figures. On the other
hand, as of the time of this writing, the total amount of revolv-
ing credit was increasing at a slow rate, one of many factors
that suggest to us that growth and job creation will probably
remain very sluggish without a renewed fiscal push.
The Fed’s low-interest-rate policies remain in effect for
now, and it is clear that Janet Yellen, the incoming Fed chair,
is likely to be concerned mostly about downside cyclical risks
when it comes to macro policy decisions, given the current
macroeconomic environment. The Fed brought some opti-
mism to bond markets in the United States and the emerging
markets with current chair Ben Bernanke’s announcement in
mid-September that the Fed would not yet begin reducing its
monthly open-market purchases at the long end of the matu-
rity spectrum. Most likely, the Fed will nonetheless begin to
“taper” purchases by the end of 2013, though a report released
after the meeting showed increased pessimism about growth
and employment on the part of the Federal Reserve Board and
the majority of regional Fed presidents (Federal Reserve Board
2013). On the other hand, the Fed’s recently released meeting
minutes for late July suggest that a minority of board mem-
bers seek to lower its 6.5 percent threshold unemployment
rate for hikes in short-term interest rates by a full percentage
point.
2
Such an act, some think, would partially compensate
for the anticipated tapering of purchases at the long end of the
Figure 3 External Balance
Percent of GDP
-7
-6
-
5
-4
-
3
-2
-1
0
Sources: BEA; authors’ calculations
Old
Revised
2009Q1
2008Q1
2007Q1
2005Q1
2006Q1
2010Q1
2012Q1
2011Q1
2013Q1
4 Strategic Analysis, October 2013
maturity spectrum, helping to reduce strain on financial con-
ditions. Benchmark mortgage rates, including rates on 30-
year fixed-rate mortgages, had risen by approximately a full
percentage point since May, when talk of an impending taper
began, and upward pressure on these rates seemed to be eased
by the Fed’s new policy announcement. Nonetheless, nation-
ally, monthly housing starts as well as purchases of existing
homes continue to increase broadly, in a gradual but partial
reversal of one of the trends that brought on the US recession
of 2007–09. The monetary policy fright caused by discussion
of future policy tapering has also caused ripples in emerging
markets and in eurozone bond markets, where spreads appeared
to be widening, at least until the Fed’s recent announcements.
For now, the tightening of credit conditions acts as a damper on
a housing recovery that nonetheless remains well under way.
Some evidence for this proposition, along with the gen-
eral weakness of household spending, is contained in Figure 4,
which depicts amounts of six kinds of outstanding consumer
debt in a stack diagram (see Federal Reserve Bank of New
York Research and Statistics Group 2013). The dollar volumes
of each type of debt are expressed as percentages of GDP per
year. Despite the recovery in spending, the broad pattern of
consumer deleveraging appears to continue when viewed
from the perspective offered by the figure. The dynamics of
the total amount of debt are dominated by the big decline in
mortgage debt, shown in gray at the bottom, that occurred
following the US financial crisis that hit in approximately
2008–09. Also among the notable trends is an increase in stu-
dent loan debt, which is shown in blue.
The CBO’s September report confirms other recent evi-
dence in support of the notion that the federal deficit contin-
ues a sharp decline (see Figure 2). Detailed series in the report
show a broad decline in outlays since the end of the 2007–09
recession. The spending sequester went into effect as of March
1, leading to $85 billion in immediate, across-the-board cuts
in discretionary spending, a category that amounts to approx-
imately 8 percent of GDP, including both defense and nonde-
fense outlays. A failure to agree on a continuing resolution to
fund federal government operations in the new fiscal year led
to a partial government shutdown over these and other issues
beginning October 1. As this report goes to press, the shut-
down appears to be ending.
3
However, the broad, automatic
sequester cuts are slated to stay in force for 10 fiscal years in
all. The federal government has already implemented a large
number of furloughs. These temporary reductions in hours
can easily result in cuts of 20 percent or more in the
employee’s gross pay. Also, some federal contractors—private
companies that perform multifarious tasks, including mili-
tary procurement, for the federal government—are said to
find themselves without business. Without a legislative com-
promise, these and other sequester-related job losses are more
likely to become permanent, but the conservative-dominated
House of Representatives threatens to block compromise in
its efforts to minimize domestic government spending, focus-
ing especially on defunding Obamacare.
A longer-term legislative compromise to fix the sequester—
that is, get rid of these deep across-the-board cuts—could,
unfortunately, entail cuts to many entitlement programs,
such as Social Security and food stamps, that are part of
mandatory federal spending. It is alleged by many serious
commentators and think tanks that the long-term fiscal threat
Figure 4 Consumer Debt by Type, 2003Q1–2013Q2
Sources: Federal Reserve Bank of New York Quarterly Report on Household
Debt and Credit Data, August 2013; BEA; authors’ calculations
Percent of GDP (Annual Rate)
30
40
50
60
70
80
90
100
Other
Student Loans
Credit Card Debt
Auto Loans
HE Revolving Loans
Mortgages
2009Q1
2008Q1
2007Q1
2005Q1
2006Q1
2010Q1
2012Q1
2011Q1
2013Q1
2003Q1
2004Q1
0
1
0
20
represented by such programs is the key fiscal policy concern
to focus on for now.
Hence, most of the long-term plans bandied about in
congressional committee meetings and think tank–sponsored
conferences—while laudable in many ways—are designed
either to be revenue neutral or to increase revenues. In partic-
ular, the proposed tax reform plans now under discussion
promise to work through increased efficiency, rationality, and
simplicity, rather than the stimulative effects of tax cuts alone.
From our standpoint as economists urging a change in the fis-
cal policy stance to stabilize the economy, we note a continuing
policy bias in most of these proposals toward fiscal tightening,
as well as a lack of sensitivity, in many cases, to urgent spend-
ing needs. Proposed long-run changes to social benefit (“enti-
tlement”) programs made by the administration and most
congressional leaders include, for example, reductions in
Social Security benefits for nonpoor retirees or increases in
contributions to these programs (McKinnon 2013), not to
mention proposals for further cuts in food stamp eligibility
and the like (Rosenbaum, Dean, and Greenstein 2013). In
contrast, in keeping with our Keynesian, stock-flow consistent
approach (e.g., Godley 1999), we do not consider any meas-
ures at this time that would have the net effect of tightening
Washington’s fiscal stance, whether by raising tax rates, clos-
ing loopholes, or cutting expenditures.
The Benefits of Infrastructure Spending
Generally speaking, government investment tends to promote
growth in the productivity of the total amount of resources
utilized, a phenomenon studied by econometricians for many
years (Aschauer 1989). Infrastructure in general, which includes
bridges, dams, the electrical “grid,” levies, school buildings, tun-
nels, and so on, is still due for a huge overhaul, with the most
recent report from the civil engineering profession conferring
a D+ overall ranking on an A-to-F scale (ASCE 2013). One
tends to forget the importance of infrastructure until there is
a catastrophic failure, as in the Route 35W bridge collapse in
Minneapolis; or, on a larger scale, Hurricane Katrina in the
area around New Orleans. Hence, in scenario 1 below, we con-
sider a plan to achieve higher growth and employment by
means of an increase in spending to repair, renovate, and
replace aging infrastructure.
Levy Economics Institute of Bard College 5
Our argument is cast within the framework of the three
balances in the national accounting identity. In more detail,
our argument is, as always, framed within an analysis of the
key financial balances in any advanced economy. The national
accounting identity shows that in a three-sector model, the
sectors’ financial balances (their income minus their expendi-
tures) add up to zero:
(Private Sector Investment — Saving) + Government
Deficit + External Balance = 0
Note that, as in Figures 1 and 2, we have written the first two
terms on the left side of the identity so that a positive number
indicates a deficit, implying that a negative value represents a
surplus.
The identity shows that a change in one balance implies
that one or both of the other balances must change. For exam-
ple, we argued consistently in the years before the financial
crisis of 2008–09 that the run-up in private sector investment
minus saving (shown in parentheses in the identity above),
which implied increasing private sector debt, would eventu-
ally come to a halt and decline. The latter overall trend,
known more popularly as deleveraging, began in 2010 and has
not been reversed in the household sector, as we saw in Figure
4. On the other hand, according to revised data, the overall
private sector balance—that of businesses, households, and
nonprofit organizations combined—has been positive since
2008, reflecting the relatively strong financial position of non-
financial firms (see Figure 1). On balance, firms see little need
to invest in new productive assets, as long as effective demand
remains weak in the United States and most of the rest of the
world. Hence, policymakers must increase demand flowing
from either the government sector (by increasing autonomous
spending, cutting tax rates, increasing transfers, or some com-
bination of the three) or the external sector (by increasing
exports or reducing imports).
An Export Strategy Led by R & D
The US current account deficit (the balance of trade and
international income payments) remains fairly large, at just
below 3 percent of GDP. One option for generating employ-
ment in the private sector without an unsustainable financial
6 Strategic Analysis, October 2013
bubble or boom would be to seek to generate new jobs in
export-related industries. We do so in our scenario 2 by increas-
ing spending in R & D in fields that hold promise for applica-
tions in the tradable goods and services sector. As the classic
example of Silicon Valley illustrates, R & D work has acted as
a catalyst to innovation in the United States, despite sharp cuts
in recent years. A voluminous empirical literature finds that
the returns to R & D expenditures are significant, and that a
large share of the fruits of a given private firm’s R & D efforts
tend to go to other industries and firms (CBO 2005). Moreover,
we now enjoy an improved ability to conduct an inquiry in this
area: R & D activity is the largest change to measured US GDP,
with the recently revised NIPA concepts treating this sort of
spending as a form of investment.
4
The new data unsurpris-
ingly indicate that R & D spending by all levels of government
has been on the decline as a percentage of GDP (see Figure 5).
Our proposed increase in R & D spending would directly
help the economy in at least two ways: (1) as do other forms of
government spending, it would increase the income generated
by the government and its contractors; and (2) by leading to
the discovery and adoption of new production techniques, it
would reduce unit costs for producers. To provide our first
look at the potential effects of R & D within the Levy Institute
US macro model, we focus on a case in which spending leads
to innovation specifically in the export sector, which would
reduce the relative price of exports in foreign markets and
hence yield a decline in the current account deficit.
Furthermore, the approach adopted in this scenario would
allow the domestic household sector to continue to mend its
still-debt-laden balance sheet.
As we argued earlier, efforts to increase government spend-
ing significantly may not be feasible: the public sector lacks
the political will to increase spending, given that (1) Washington
remains convinced of the need to further reduce the federal
deficit, at least in the “out years”; and (2) US states and local-
ities are still suffering from slump-weakened tax receipts and
a reluctance to take the step—politically unpopular in most
parts of the nation—of increasing tax rates to alleviate rev-
enue shortfalls.
5
Hence, we turn to the external sector. Cutting imports
quickly would require a disastrous fall in private sector income,
while an export-oriented strategy would require some ability to
find strong markets somewhere and maintain competitiveness.
Both of these tasks are far more difficult than usual in the con-
text of a deflationary world economy, a situation all too sus-
ceptible to the “beggar-thy-neighbor” dynamics of competitive
devaluation—a situation sometimes dubbed a “currency war”
by the press and some world leaders, who blame current-
account problems on purportedly unrealistic and admittedly
substantial revaluations in the currencies of their small- and
medium-size economies (New York Times 2013).
Moreover, US “competitiveness,” a gauge of factors affect-
ing the cost of exports in foreign currencies and of imports to
US buyers, is strong, according to a recent ranking, though the
nation slipped from number five to number seven in the
world in this category out of 122 in the sample (WEF 2013).
6
On the other hand, over the past 10 years or so there has been
an extended real appreciation in the currencies of emerging-
market countries such as Brazil, Indonesia, Russia, Romania,
India, and China, a trend that has eroded their competitive-
ness, substantiating the concerns mentioned earlier.
7
The US
dollar is fairly weak in goods-for-goods terms according to
data such as those shown in Figure 6, especially when com-
pared to the currencies listed toward the top of the figure; that
is, those undergoing the most dramatic long-term, real appre-
ciation. Hence, there is little sign of a large or growing US
disadvantage in overall competitiveness that would justify
calls for redress in the area of macroeconomic policy.
Figure 5 Gross Government R & D Investment,
2000Q1–2013Q2
Sources: BEA; authors’ calculations
Percent of GDP
0
0.1
0.2
0.3
0.4
0.5
Federal Nondefense
Federal Defense
State and Local
201020062000 20042002 20122008
Levy Economics Institute of Bard College 7
At the same time, any effort to increase competitiveness
would run up against a plethora of governments around the
world that have already been working in this policy direction
because (1) they face sizable debt burdens; (2) much of their
debt is denominated in a foreign currency, a pegged local cur-
rency, or a common currency, the euro; and (3) future interna-
tional loans to the governments in question are conditioned on
harsh austerity measures in most cases.
The United States, possessing its own unpegged currency,
does not face this situation.
8
In the States, arguments about
the need for austerity measures make for a moot debate: the
government sector deficit has been falling as a percentage of
GDP largely because of a cyclical upturn, and the CBO now
projects this trend to continue, knocking away the thin reed of
rhetoric supporting retention of the spending sequester.
9
Hence, the United States cannot claim to have the same
imperative as crisis-torn eurozone nations to implement
nominal wage cuts and raise productivity.
Nonetheless, given the deflationary bias observed in the
international economy, US competitiveness will probably
tend to erode unless current policies are replaced, reversing
stagnation in manufacturing and other export-related sectors.
Hence, to some extent, export growth is an imperative for the
United States as well. The hope is for a positive-sum game.
Looking at matters in yet another way, given a lack of political
will in Washington to repeal sequester spending caps, the case
can be made that an increase in exports is the only way to
simultaneously meet the self-imposed fiscal restrictions, sus-
tain strong US GDP growth, and allow US trading partners
that have internationally acceptable currencies of their own to
avoid fiscal austerity.
10
Indeed, we have argued many times
before that an export-oriented approach represented an
urgent hope for the United States, since we saw no sustainable
option based on private sector demand growth (e.g., see
Godley, Izurieta, and Zezza 2004).
Historically, the era of high US current account deficits
coincides neatly with a period that saw a decline in manufac-
turing as a share of the value-added of the economy, as Figure
7 illustrates. There are very high hopes in the new smartphone
industry, which apparently is beginning to reach a mass cus-
tomer base; but it is not clear how many industries hold such
promise as sources of new export jobs and earnings. For
example, there are reports that Europe is attempting to reduce
its steel-producing capacity, and many big national producers
are reeling under heavy debt burdens.
11
It is crucial that
growth in demand at the aggregate level be restored before
this sector can sustain job creation at required levels.
Moreover, the manufacturing sector is building from a rel-
atively small initial level. According to establishment survey
data from the US Department of Labor, manufacturing indus-
tries now account for only a small share of US employment:
approximately 11.7 million full-time equivalents (FTE), or 9.4
percent of total employment expressed in FTEs. This situation
obtains partly because of the phenomenal rate of labor-pro-
ductivity growth achieved by US manufacturers, even relative
to their international competitors, since the 1970s and 1980s
(see Hatzius 2013); partly because of the increasing market
Figure 6 Real, Effective Exchange Rate Revaluation
Sources: Interagency Group on Economic and Financial Statistics; authors’
calculations
China
Russian Federation
Brazil
Singapore
Australia
Switzerland
Canada
Spain
Saudi Arabia
Luxembourg
Sweden
Belgium
Austria
Netherlands
Italy
Ireland
Mexico
France
Germany
Eurozone
United States
United Kingdom
South Africa
Japan
10 20 30 50400
Note: Data extracted September 20, 2013. Revaluation is the percent change in
the real, effective exchange rate relative to the 2005 base year for the series.
-10-20
Percent Change, 2005–July 2013
8 Strategic Analysis, October 2013
share held by these competitors; and partly because of the
many immutable factors that have kept exports plus imports
relatively small as a percentage of US GDP.
12
As a group, the small absolute size of the US export sec-
tor means that it must grow at a very rapid rate in order to
achieve a given reduction in the size of the current account
deficit as a percentage of GDP and to make a significant dent
in the unemployment rate. Indeed, it has been noted that ris-
ing labor costs in some Asian countries, as well as new sources
of inexpensive fossil fuels, could lead to an “insourcing” boom
(Fishman 2012) or manufacturing renaissance of sorts
(Hatzius 2013) in the United States. But can one point to a
significant share of industries where US manufacturers stand
a chance of becoming low-cost producers for the world?
Figure 8 divides US gross exports into major types of prod-
ucts: automotive; capital goods, excluding automotive; con-
sumer goods, excluding automotive; foods, feeds, and beverages;
industry supplies and materials; and services. The picture
prompts two observations:
(1) Product groups differ in the degree to which they
move in sync with the business cycle, with industrial
supplies and materials displaying the greatest amount
of procyclical volatility among the seven series.
(2) Most of the groups are growing slowly, if at all, with
the aforementioned industrial supplies and materials
and services aggregates growing most rapidly, on
average, over the period shown in the figure. A more
detailed look might suggest that the effects of various
nonconvexities, including technological-foothold
effects and interindustry and interfirm externalities),
account for the fact that these groupings tend to be
either static, on the one hand, or rapidly growing, on
the other, at any given time and in any given region.
Also, it has long been argued that certain sectors,
especially the manufacturing sector, have an inherent
advantage over the long run because they undergo
technical progress most rapidly, allowing them
to reduce the inputs needed for a given amount of
output, or because demand for them increases as
countries grow more wealthy (e.g., Kaldor 1985,
7–30; Baumol 2012).
Also, citing examples such as Silicon Valley in northern
California, some work indicates that industries closely linked
to R & D enjoy high external economies when they are clustered
in a given geographic region. Moreover, private sector–based
innovation is far more likely to occur when it is catalyzed by a
Figure 7 Manufacturing and External Balance
Sources: BEA; authors’ calculations
Percent of GDP
0
5
10
1
5
20
25
30
Net Exports (right scale)
Manufacturing (left scale)
E
xternal Balance (right scale)
2
000199019801960 1970 2010
Percent of GDP
-4
-3
-
2
-1
0
1
2
-7
-6
-5
Figure 8 US Exports by Type of Product, Quarterly,
2
000Q1–2013Q2
Sources: BEA; authors’ calculations
Percent of GDP
0
1
2
3
4
Capital Goods (excluding automotive)
Exports of Services
Industrial Supplies and Materials
Consumer Goods (excluding automotive)
Automotive Vehicles, Engines, and Parts
Other
Food, Feed, and Beverages
2008200620042000 2002
2012
Note: Data revised as of July 31, 2013.
2010
Levy Economics Institute of Bard College 9
high level of public sector investment in R & D (e.g., Mazzucato
2012; Hicks and Atkinson 2012).
1
3
Finally, R & D spending in
both public and private domestic sectors tends to be rather pro-
cyclical, exacerbating business cycle fluctuations, unless policies
are implemented to stabilize R & D efforts.
In scenario 2 below, we take the tack of trying to increase
export competitiveness by stoking innovation in export-ori-
ented industries, a route that might yield new products and
cost-saving production techniques. Our proposed means is a
shot of government investment in R & D, currently scheduled
for deep cuts under the sequester’s across-the-board budget-
ary axe. R & D, defined by John Cornwall (1977) as “the con-
scious application of resources to develop inventions into a
form that has commercial value” (105), has been touted by the
presidential candidates from both major parties in the most
recent presidential election (Plumer 2013) and by leaders in
business and academe (Reif and Barrett 2013). Government
R & D tends to be pure rather than applied, but experts note
that even a small dose of government R & D—say, $2 billion
annually—aimed at complementing manufacturing innova-
tion could bring tangible benefits to US industry (Pisano and
Shih 2012). For reasons of limited space, we cannot take up
the issue of R & D spending itself in great detail in this report
(see appendices 1 and 2 of Papadimitriou et al., forthcoming),
but we can only note widespread support for saving these
activities from congressional cuts by the best-financed think
tanks advising the Washington elite, with conference titles
such as “Innovating American Manufacturing: New Policies
for a Stronger Economic Future” providing a sense of the
message—and reasonably sound rationale—being touted.
Sufficient Demand Growth in the External Sector?
Given that our concerns center mostly on aggregate demand,
one key question mark in any export-oriented plan is the
strength of demand in the rest of the world, represented in
our model by a variable for trading-partner GDP (Shaikh,
Zezza, and Dos Santos 2003). The so-called emerging markets
are said to be entering a period of slower growth, a thought
that is being borne out in 2013Q2 GDP data for the BRICs
(Brazil, Russia, India, and China). In the case of China,
reports suggest that this sea change reflects a long-term plan-
ning decision that now is a time to turn gradually toward a
higher consumption-to-investment ratio.
1
4
Since rumors of
an early tapering of QE3 rocked markets last spring, some
emerging-market countries have found themselves buffeted
by significant capital outflows and currency declines, and the
heightened financial concern has led to broader gloom in the
affected securities and derivatives markets and contributed to
downward revisions in emerging-market growth forecasts.
On the other hand, as indicated earlier, these may represent
the culmination of what appears to be a long wave of real
appreciation in India, Taiwan, and South Africa. Meanwhile,
the eurozone as a whole saw real growth reach an estimated
1.2 percent for the quarter—still far less than the figures for
the aforementioned emerging-market countries (e.g., 4.4 per-
cent in India in 2013Q2), but a modest breakthrough into
positive territory nonetheless (Popper 2013). Yet growth
remains deeply negative and unemployment extraordinarily
high in much of Europe. Moreover, owing to the tight fiscal
strictures to which the euro crisis has led, fiscal policy in the
eurozone still has a strong contractionary bias, leading to legit-
imate fears of a downward fiscal spiral in those countries using
the euro (for details, see Hannsgen and Papadimitriou 2012).
Turning to the climbing bond yields that signaled the
beginning of the euro crisis in 2012, the good news is that the
European Central Bank (ECB) has decided to support euro-
zone bond markets with loans to banks in the largest of the
member-countries. These efforts have worked to great effect
for the sovereign debt of Italy and Spain, resulting in steadily
declining spreads. The bad news is that these measures have
not acted as effectively to narrow other “peripheral” eurozone
interest rate spreads, and, moreover, strong pressures exist to
adopt and adhere to austerity measures in return for ECB
open-market purchases (Norris 2013). As suggested above,
this policy approach invariably leads to wage deflation, which
in turn tends to undermine aggregate demand (Keynes 1936,
ch. 18 and 19). In many ways, this seems similar to the defla-
tionary world economy described by John Maynard Keynes in
the 1920s and 1930s, a point documented by a huge report
from the International Labour Organization (ILO 2013), which
found that approximately 200 million people are unemployed
worldwide (31). Hence, if an export-oriented approach were
needed, it would be one that takes into account barriers
presented by insufficient worldwide aggregate demand. For
this reason, we do not offset the R & D spending in scenario 2
10 Strategic Analysis, October 2013
with new taxes, instead allowing it to generate a net loosening
of the fiscal policy stance.
The Story So Far and Implications for Fiscal Policy
A projection of current economic trends based on our model
will provide a benchmark against which to compare the
results of two policy scenarios. The parameters in the model
are set as in previous analyses, with the World Economic Outlook
report issued in April by the International Monetary Fund
(IMF 2013) providing baseline world economic growth fore-
casts. Interest rates and the nominal effective exchange rate of
the dollar are not expected to change appreciably from their
current values. Using the projected government spending and
revenues from the CBO, the model’s base-run simulations for
the three balances and real GDP growth rates appear in Figure
9. Consensus economic growth forecasts have grown weaker
since the CBO issued its report, so it must be kept in mind
that the picture presented in the figure is likely to be on the
optimistic side. All subsequent simulations start from this
baseline.
We report the results of our projections from 2013 through
2016. As shown in Figure 9, the current account deficit increases
slightly and then declines through the remainder of the pro-
jection period. Private sector investment minus savings con-
tinues to reflect the deleveraging process, meaning that this
sector’s income is greater than its outflows and, by implica-
tion, the continuing decline of its indebtedness as a percent-
age of GDP. Yet some signs show the easing of this process,
resulting in a rise in private sector investment minus savings
as a percentage of GDP that comes to a halt by the end of the
projection period.
Turning to the government deficit, the projection of cur-
rent trends denotes the continuing movement toward fiscal
consolidation into next year and the year after that. The
decline in the deficit is projected to flatten out in 2016, the
final year of the simulation period. This has been heralded as
an achievement of sorts, but as we have argued above, it is
likely to prove disastrously inappropriate in the face of a large
output gap and high unemployment rate. Another line in the
same figure shows a convergence of the real GDP growth rate
to around 3.5 percent as the projection period ends.
Finally, Figure 14 (page 13) shows the path of unemploy-
ment extending the weak labor-market recovery, with the offi-
cial unemployment rate standing at only slightly less than 7
percent at the end of the simulation period.
An Increase in Government Infrastructure
Spending
In the Levy Institute’s Keynesian, stock-flow consistent model,
a loosening of fiscal policy is expected to cause an increase in
economic growth. As explained in Nikiforos (2013b) and in a
previous strategic analysis report (Papadimitriou, Hannsgen,
and Nikiforos 2013), the increased GDP growth rate gives rise
to a decline in the unemployment rate, once withdrawals from
the labor force are taken into account. We simulate the effects
of an increase in government infrastructure spending of $160
billion, or approximately 1 percent of GDP, relative to the
baseline, in each year of the simulation. The focus is to reduce
the unemployment rate more quickly than the policies
posited in the baseline scenario.
The results indicate substantial improvement. As shown
in Figure 10, private sector net borrowing is somewhat higher
by less than 1 percent throughout the projection period, reflect-
ing a dynamic multiplier effect in which increased government
Sources: BEA; authors’ calculations
Percent of GDP
-15
-10
-5
0
5
10
15
Government Deficit (left scale)
Private Sector Investment minus Saving (left scale)
External Balance (left scale)
Real GDP Growth (right scale)
2010
2008
2007
2005
2006
2011
Figure 9 US Main Sector Balances and Real GDP
Growth, Actual and Projected, 2005–16
2009
2013
2014
2012
2015
2016
Annual Growth Rate in Percent
-5
0
5
10
15
20
25
35
30
Levy Economics Institute of Bard College 11
spending works its way through the economy. The govern-
ment deficit does not decline as rapidly, reaching about 6 per-
cent of GDP—and a hint of an upward-turning inflection
point—by the end of the simulation period. The third path in
the figure shows that the current account deficit is a bit higher
than in the baseline, a fact that follows ineluctably from the
aforementioned higher deficits of the domestic government
and private sectors (Godley 1999). Moreover, as the figure
shows, the real GDP growth rate converges to approximately
5 percent toward the end of the simulation.
Finally, Figure 14 (page 13) shows the path of the unem-
ployment rate falling below 6 percent by 2016. The fiscal stim-
ulus and its multiplier effects result in an improved recovery
vis-à-vis the outcome of the baseline, which is depicted in the
same figure.
Simulating an Increase in Export-oriented R&D
Spending
What if we assumed that the macroeconomic effects of a change
in government spending depended on the particular types of
spending that were changed? As mentioned earlier, there is cur-
rently much talk, fostered by think tanks and political and
educational leaders, that it makes sense to increase spending
on R & D, or at least to save government R & D from the
effects of automatic cuts imposed by the sequester. A round fig-
ure of $40 billion per quarter, or $160 billion at an annual
rate, is used as an amount of extra spending to add to baseline
expenditures throughout the projection period. To recapitu-
late, the idea is that such spending would have the added effect
of raising average productivity in industries catering to export
markets, resulting in a fall in US export prices relative to the
overall US price level. We assume that this spending is aimed
exclusively at reducing domestic costs of production, although
in reality the effects might also include bringing novel prod-
ucts to market overseas.
The R & D is relevant in the context of the Levy Institute
model as a means of increasing exports, offering a helpful
complement to the Keynesian effects of fiscal stimulus. To
simulate the impact of R & D it is necessary to show, in some
way, the effects of technological innovation on productivity
and costs in industries that produce for export. Toward that
end, productivity in these industries is an increasing function
of their existing “stock” of accumulated R & D. Figure 11
depicts such a relationship. It shows productivity rising as the
stock of export-relevant R & D increases. The principle illus-
trated in the figure seems consistent with the reasoning
behind the BEA’s move to include R & D in NIPA as a form of
fixed investment (see also Papadimitriou, Hannsgen, and
Nikiforos 2013).
Next, we assume that unit costs, and hence the real export
price, fall roughly in inverse proportion to productivity.
Finally, completing the chain of reasoning in this scenario, the
real export price is one of the variables that determine the
path of export volume over time.
The relationship depicted in Figure 11 is almost univer-
sally thought to be positively sloping by those who study this
area. Broadly speaking, however, the academic literature can-
not provide a single precise estimate of the parameter that
governs the shape of the relationship shown in the figure—
the size in percent of the effect of a 1 percent increase in the
stock of R & D. The CBO report referred to earlier summa-
rizes decades of study and analysis in this literature. It finds
the range of estimates regarding the effect of R & D spending
to be quite wide, and dependent upon the type of study and
the data used: “The core of the empirical literature on R & D
Sources: BEA; authors’ calculations
Percent of GDP
-15
-10
-5
0
5
10
15
Government Deficit (left scale)
Private Sector Investment minus Saving (left scale)
External Balance (left scale)
Real GDP Growth (right scale)
2010
2008
2007
2005
2006
2011
Figure 10 An Increase in Government Infrastructure
Spending: US Main Sector Balances and Real GDP
Growth, Actual and Projected, 2005–16
2009
2013
2014
2012
2015
2016
Annual Growth Rate in Percent
-5
0
5
10
15
20
25
35
30
12 Strategic Analysis, October 2013
comprises studies that estimate the private return to R & D by
using data at the firm or industry level, and their results,
though not uniform, are the most consistent across studies.
They seem to form the basis for the consensus that the elas-
ticity of R & D is positive and significant (that is, it differs sig-
nificantly from zero)” (CBO 2005, 14).
Hence, to the extent that a case exists for a quantifiable
productivity payoff to R & D, the CBO finds it in this “core”
of the academic work on the subject. The report’s authors
conclude that estimates of the output response to a 1 percent
increase in the accumulated stock of R & D knowledge ranges
from 0 to 0.6 percent.
15
Presumably, the best answer would
depend on the type of R & D contemplated, but we assume
here that government R & D funding would be increased for
a fairly broad range of fields, both pure and applied. This
leaves us somewhat free to set the assumed effect without
great concern for exactness.
16
Simulation results for an export-oriented R & D govern-
ment spending scenario show that the private sector increases its
spending more than before, resulting in a pathway for its sec-
toral balance exceeding 2 percent by the end of the projection
period (see Figure 12). Higher levels of imports in this sce-
nario reflect the fact that the assumed change in relative prices
affects exports, but not imports. Consumers enjoy higher
incomes as a result of increased exports and government
spending, and more of this increase is spent on imported
goods and services than in the case of a nominal depreciation,
which generally raises the real price of imports, at least at first.
Turning to the government deficit, the figure shows that
assumed effects of R & D on exports reduce the fiscal impact
of increased spending vis-à-vis the simple infrastructure pub-
lic investment simulated before, in which no productivity
effects were assumed. On the other hand, the projected path-
way for the government deficit shows that it still exceeds base-
line projections. Figure 12 shows a steady and very gradual
rise in the current account deficit throughout the simulation
period, reflecting increased export volume. Similarly, the same
figure depicts real GDP growth gradually nearing 5.5 percent
by the end of the projection period, a bit higher than at the
end of the previous scenario. Finally, the downward path of
unemployment appearing in Figure 14 is steeper than in the
baseline or the infrastructure simulations, with this activity-
related variable falling to less than 5 percent by 2016.
Source: Authors’ calculations
Average Labor Productivity in Export Industries
Real Export Price
Figure 11 Assumed Relationship between R & D
Accumulation and Export-sector Performance
Stock of Accumulated, Export-related R & D Investment
Sources: BEA; authors’ calculations
Percent of GDP
-15
-10
-5
0
5
10
15
Government Deficit (left scale)
Private Sector Investment minus Saving (left scale)
External Balance (left scale)
Real GDP Growth (right scale)
2010
2008
2007
2005
2006
2011
Figure 12 Simulating an Increase in Export-oriented
R & D Spending: US Main Sector Balances and Real GDP
Growth, Actual and Projected, 2005–16
2009
2013
2014
2012
2015
2016
Annual Growth Rate in Percent
-5
0
5
10
15
20
25
35
30
Levy Economics Institute of Bard College 13
Implications of Increased R & D Spending plus
Continued Household Deleveraging
Household deleveraging may continue far more strongly than
projected in the baseline simulation. As discussed, we find
that growth is reasonably strong, but this outcome requires
renewed household and business borrowing, a rather shaky
premise assumed in all of the previous simulations. Here, we
try to make the case for some macroeconomic pessimism,
then report the results of a simulation with the same policy of
R & D spending (an increase of $160 billion annually) but
with additional household deleveraging, as outlined below.
Following the work of Wynne Godley (1999), we think it
reasonable to argue that historical norms are relevant as
benchmarks for household indebtedness ratios. Anwar Shaikh
(2012), using NIPA data for 1947 to 2010, presents evidence
that the private sector generally tends to maintain small posi-
tive financial balances over the long run. Developing a line of
argument that he attributes to Nancy and Richard Ruggles
(1992), he explains that households save mostly to invest in
durable consumer goods, while firms retain earnings prima-
rily to invest in capital goods. Hence, the private sector deficit,
which equals the difference between savings and investment
sectorwide, would find an average of approximately zero over
the long run. Therefore, the run of years of negative private
sector net saving running from the late 1990s through the late
2000s would prove to be a short-lived exception. Indeed, as we
saw earlier, household debt as a percentage of GDP is still
declining relative to the peak reached in the fall of 2008.
Moreover, Figures 9, 10, and 12 illustrate that the private sec-
tor as a whole has maintained a positive financial balance
since approximately the beginning of the 2007–09 recession.
In this scenario, we break with the CBO (2013) report in
making an assumption that household deleveraging continues
in this way, with US households focusing on forestalling new
purchases of goods and services in order to reduce their debt.
This assumption is embodied in lower projected amounts of
private sector borrowing relative to those assumed in all pre-
vious scenarios. Figures 15, 16, and 17 depict debt-to-GDP
ratios in the baseline and all three scenarios, including the
accelerated path of scenario 3. Figure 15 shows the ratio for
the whole private sector careening downward toward 1.5 as of
last year. This trend reflects both rising GDP and falling nom-
inal debt. The base-run scenario leads to a leveling out and
gradual turning up of the line for the debt-to-GDP ratio, with
Figure 14 Unemployment Rate, Actual and Projected,
2005−16
Sources: Bureau of Labor Statistics; authors’ calculations
Percent of Labor Force
0
2
4
6
8
10
12
Baseline
Scenario 1
Scenario 2
Scenario 3
2010
2008
2007
2005
2006
2011
2009
2013
2014
2012
2015
2016
Sources: BEA; authors’ calculations
Percent of GDP
-15
-10
-5
0
5
10
15
Government Deficit (left scale)
Private Sector Investment minus Saving (left scale)
External Balance (left scale)
Real GDP Growth (right scale)
2010
2008
2007
2005
2006
2011
Figure 13 Implications of Increased R & D Spending plus
Continued Household Deleveraging: US Main Sector Balances
and Real GDP Growth, Actual and Projected, 2005–16
2009
2013
2014
2012
2015
2016
Annual Growth Rate in Percent
-5
0
5
10
15
20
25
35
30
14 Strategic Analysis, October 2013
rebounding consumption acting as the driving force. After
that, in decreasing order, the debt-ratio paths are: scenario 1,
scenario 2, and the new scenario 3.
The lines for scenarios 1 and 2 in Figure 17 indicate
somewhat reduced private sector leverage relative to the base-
line, owing to the effects of higher GDP growth, which increases
the denominator of the debt ratio. The line for scenario 3 falls
still more rapidly, more or less extending the downward trend
that began with the start of the most recent US recession.
Figure 15 (for the entire private sector) and Figure 16 (for
nonfinancial corporations) show that the assumed added
deleveraging takes place solely in the household subsector.
Indeed, as illustrated in Figure 16, weaker economic growth
rates under the assumption of household deleveraging bring
higher debt ratios for the corporate nonfinancial sector by the
end of the scenario, showing the effects of lower sales.
Figure 13 shows the economy headed for higher deficits,
with an upturn in the government sector deficit. This is, of
course, a response—generated by the model—to slow growth.
Private sector investment minus saving traces out an upward
hump, turning downward by the end of the simulation period.
The current account balance is higher than before, meaning
that the reduction in private sector deficit spending is suffi-
cient to outweigh the adverse fiscal impacts of lower eco-
nomic growth rates, also shown in the figure. Finally, real
GDP growth again flattens out as the projection period unfolds,
but this time it fails to reach even 5 percent per year.
Turning back to Figure 14, one can see that the unemploy-
ment rate is higher under scenario 3 than in the previous two
scenarios, revealing the importance of household consumption
spending in the US economy. Nonetheless, the fiscal-stimulus
and export-price effects are still operative for the projection
period, in that the unemployment rate lies entirely below the
one generated in the baseline simulation, following a relatively
straight downward path to about 5.5 percent by 2016.
Conclusion
The range of strategic policy options for the United States is
limited. Bringing down the stubbornly high unemployment
rate and reversing the decline of household fortunes are
urgent priorities. Accelerated economic growth and increased
aggregate demand will not come about from private expendi-
tures while the household sector continues its deleveraging
trend. Rescuing the recovery will require using expansionary
fiscal and monetary policies.
Figure 16 Nonfinancial Corporations: Debt-to-GDP Ratio,
Actual and Projected, 2005−16
Sources: Bureau of Labor Statistics; authors’ calculations
Ratio
0.6
0.65
0.7
0.75
0.85
2010
2008
2007
2005
2006
2011
2009
2013
2014
2012
2015
2016
Baseline
Scenario 1
Scenario 2
Scenario 3
0.8
Figure 15 Private Sector: Debt-to-GDP Ratio, Actual and
Projected, 2005−16
Sources: Bureau of Labor Statistics; authors’ calculations
Ratio
1.4
1.5
1.6
1.7
1.8
Baseline
Scenario 1
Scenario 2
Scenario 3
2010
2008
2007
2005
2006
2011
2009
2013
2014
2012
2015
2016
Levy Economics Institute of Bard College 15
Our baseline scenario may be considered a business-as-
usual case characterized by anemic growth and employment
in the years ahead. At the moment, the showdown over the
congressional debt ceiling and budget—a piece of political
theater combining ideological shifts and European-style aus-
terity—has placed all policy decisions on hold. The protracted
stalemate and partial government shutdown will have enor-
mously detrimental consequences for both the US and the
global economy.
1
7
What must come to pass, perhaps obviously, is a change
in the fiscal policy stance biased toward either infrastructure
and/or R & D investment. (Of course, here we leave to one
side other possibilities that are not considered above, such as
an increase in publicly funded care work; we have addressed this
possibility in previous reports [e.g., Papadimitriou, Hannsgen,
and Zezza 2011; Papadimitriou, Hannsgen, and Nikiforos
2013].) Our scenario considering increases in R & D expendi-
tures convinces us that restoring US price competitiveness, espe-
cially long overdue in the high-technology manufacturing
sector, will increase export demand at a relatively small cost of
about 1 percent of GDP in new stimulus annually to 2016.
Notes
1. The changes to the NIPA data are discussed in detail in
BEA (2013) and other documents available at
www.bea.gov/national/an1.htm#2013comprehensive.
2. The “forward guidance” on interest rates would continue
to be subject to the additional condition that projected
inflation stay below 2.5 percent over a one-and-a-half-
year horizon, and that “inflationary expectations con-
tinue to be well anchored” (FOMC 2013, 10).
3. The budgetary impact of the spending sequester and the
run-up to the October budget showdown are documented
in press accounts such as Banco (2013), Lawder (2013),
Rampell (2013), and Weisman and Lowrey (2013).
4. Lee and Schmidt (2010) provide an explanation of the
treatment of R & D investment in the BEA’s older satellite
accounts, and analyze the effect of making these activities
a part of GDP—a move carried out by the agency earlier
this year.
5. Most US states and localities are prevented from running
ongoing deficits of their own by constitutional restric-
tions at the state level.
6. More generally, in open-economy macroeconomics,
competitiveness is a measure of the real exchange rate in
tradable goods rather than an index number measuring
the factors that affect potential competitiveness in a vari-
ety of industries. A useful formula might be PfE/Pd,
where Pf is the price of imports in foreign currency, Pd is
the price of exports in domestic currency, and E is the
nominal exchange rate, measured as the domestic price of
foreign currency (Thirlwall 2002). An alternative formula
might use price indices for baskets of foreign and domes-
tic tradable goods as Pf and Pd. In practice, using such
variables raises both conceptual and data-availability
issues. The relevant equations in our own model use real
export and import prices, along with world GDP (see
Shaikh, Zezza, and Dos Santos 2003).
7. See Roubini Monitor (2013b). Figure 6 is based on a figure
in this post.
8. For our view of the situation in a country with this sort
of currency dilemma, see Papadimitriou, Nikiforos, and
Zezza (2013).
9. In various papers, the authors have supported repealing the
spending sequester outright (Hannsgen and Papadimitriou
Figure 17 Households: Debt-to-GDP Ratio, Actual and
Projected, 2005−16
Sources: Bureau of Labor Statistics; authors’ calculations
Ratio
0.6
0.7
1.0
2010
2008
2007
2005
2006
2011
2009
2013
2014
2012
2015
2016
Baseline
Scenario 1
Scenario 2
Scenario 3
0.8
0.9
16 Strategic Analysis, October 2013
2012) or making it conditional on the attainment of a
reasonably low unemployment rate (Papadimitriou,
Hannsgen, and Nikiforos 2013).
10. In a previous report, we analyzed the effects of adopting
nonselective import tariffs under the World Trade
Organization’s rules of the day. Under the key national
accounting identity, the effects of increasing exports ver-
sus cutting imports are similar in that they both raise net
exports, which are defined as exports minus imports. In
the present report, we look at only the effects of promot-
ing exports.
11. See, for example, the “Lex” column in the Financial Times
(print edition), October 12, 2012, and August 15, 2013.
12. One example would be the large interior of the United
States relative to the size of the coasts and the variety of
climates, soils, topographies, et cetera within its bound-
aries, which enable it to meet many of its own food and
energy needs with domestic production.
13. Mariana Mazzucato, University of Sussex, and Levy
Institute Senior Scholar L. Randall Wray have received an
INET grant for their work on innovation and finance. A
discussion of evidence in the theoretical and empirical
literature on the productivity-improving effects of R & D
will be provided in an appendix to a forthcoming work-
ing paper based on this report.
14. For an attempt to separate cyclical and structural move-
ments in macroeconomic time series, see, for example,
Roubini Monitor (2013a).
15. For completeness, we note that the other sorts of esti-
mates come from studies that use aggregate data rather
than firm-level data, as well as those that seek to measure
social, rather than private, returns. The CBO report states
that such estimates tend to be smaller, though, as noted
above, the CBO finds them to be relatively wide ranging
and imprecise (CBO 2005, 21–28). The CBO reports a
“range of measures of the central tendency of the esti-
mate,” from 0.1 to 0.2. In a footnote, the CBO attributes
this reported range to an article by Zvi Grilliches (1988).
As nonspecialists in the field of technological change, we
can seek at best an overall sense of the range of findings
of major and relevant econometric studies.
16. The effect of the flow increase in R & D also depends
upon the rate of depreciation of the existing R & D stock,
along with other assumptions. Wendy C. Y. Li (2012, 22)
finds a range of estimates for different industries based
on BEA-NSF data, with pure scientific research enjoying
a fairly low depreciation rate of about 16 percent. We find
that a path for the real export price such as the one we
assume is consistent with a simple calculation in which
there are no lags in applying innovations, and where
depreciation is within the range found by Li’s study. We
intend to provide additional details and background
research in a future Levy Institute working paper.
17. The scenario outlined in Nikiforos (2013b) augments the
analysis in this report.
References
ASCE (American Society of Civil Engineers). 2013. 2013
Report Card for America’s Infrastructure. Washington,
D.C. March.
Aschauer, D. A. 1989. “Is Public Expenditure Productive?”
Journal of Monetary Economics 23(2): 177−200.
Banco, E. 2013. “Army to Cut Its Forces by 80,000 in 5 Years.”
The New York Times, June 25.
Baumol, A. 2012. The Cost Disease: Why Computers Get
Cheaper and Health Care Doesn’t. New Haven: Yale
University Press.
BEA (Bureau of Economic Analysis). 2013. “Preview of the
2013 Comprehensive Revision of the National Income
and Product Accounts.” Survey of Current Business
(March): 13–39.
Calmes, J., and M. D. Shear. 2013. “Obama Says Income Gap Is
Fraying US Social Fabric.” The New York Times, July 27.
CBO (Congressional Budget Office). 2005. “R&D and
Productivity Growth: A Background Paper.”
Washington, D.C.: US Congress.
———. 2013. Updated Budget Projections. Washington,
D.C.: US Congress. September.
Cornwall, J. 1977. Modern Capitalism: Its Growth and
Transformation. Armonk: M. E. Sharpe.
Federal Reserve Bank of New York Research and Statistics
Group. 2013. Quarterly Report on Household Debt and
Credit. New York: Federal Reserve Bank of New York.
www.newyorkfed.org/research/data_indicators/
household_index.html.
Levy Economics Institute of Bard College 17
Federal Reserve Board. 2013. “Economic Projections of the
Federal Reserve Board and Bank Presidents, September
2013.” Washington, D.C. September 18.
Fishman, C. 2012. “The Insourcing Boom.” The Atlantic.
December.
FOMC (Federal Open Market Committee). 2013. “Minutes
of the Federal Open Market Committee, July 30–31,
2013.” Washington, D.C.: Federal Reserve.
Godley, W. 1999. Seven Unsustainable Processes: Medium-
Term Prospects and Policies for the United States and the
World. Strategic Analysis. Annandale-on-Hudson, N.Y.:
Levy Economics Institute of Bard College. January.
Godley, W., A. Izurieta, and G. Zezza. 2004. “Prospects and
Policies for the U.S. Economy: Why Net Exports Must
Now Be the Motor for U.S. Growth.” Annandale-on-
Hudson, N.Y.: Levy Economics Institute of Bard College.
August.
Grilliches, Z. 1988. “Productivity Puzzles and R & D:
Another Nonexplanation.” Journal of Economic
Perspectives 2(4): 9–21.
Hannsgen, G., and D. B. Papadimitriou. 2012. Fiscal Traps
and Macro Policy after the Eurozone Crisis. Public Policy
Brief 127. Annandale-on-Hudson, NY: Levy Economics
Institute of Bard College. November.
Hatzius, J. 2013. “The US Manufacturing Renaissance: Fact
or Fiction.” US Economics Analyst. Issue 13/12. New
York: Goldman Sachs. March 22.
Hicks, J., and R. D. Atkinson. 2012. “Eroding Our
Foundation: Sequestration, R&D, Innovation, and U.S.
Economic Growth.” Washington, D.C.: Information
Technology and Innovation Foundation.
ILO (International Labour Organization). 2013. Global
Employment Trends: Recovering from a Second Jobs Dip.
Geneva: ILO.
IMF (International Monetary Fund). 2013. World Economic
Outlook. Washington, D.C.: IMF. April.
Kaldor, N. 1985. Economics without Equilibrium. New York:
Oxford University Press.
Keynes, J. M. 1936. The General Theory of Employment,
Interest and Money. New York: Harcourt, Brace and Co.
Lawder, D. 2013. “Obama Signs Order for $109 Billion in
2014 Spending Cuts.” Reuters.com, April 10.
Lee, J., and A. G. Schmidt. 2010. “Research and Development
Satellite Account Update: Estimates for 1959–2007.”
Survey of Current Business (December): 16–27.
Li, W. C. Y. 2012. “Depreciation of Business R&D Capital.”
Bureau of Economic Analysis / National Science
Foundation R&D Satellite Account Paper. Washington,
D.C.: BEA. October.
Lowrey, A. 2013. “As Automatic Budget Cuts Go Into Effect,
Poor May Be Hit Particularly Hard.” The New York
Times, March 3.
Mazzucato, M. 2012. The Entrepreneurial State. New York:
Demos.
McKinnon, J. D. 2013. “Inflation Proposal to Shield Poorest.”
The Wall Street Journal, April 8.
New York Times, The. 2013. “Preventing a Currency War.” The
New York Times, February 13.
Nikiforos, M. 2013a. Employment Recovery(?) after the Great
Recession. Policy Note 2013/3. Annandale-on-Hudson,
N.Y.: Levy Economics Institute of Bard College. April.
———. 2013b. A New “Lehman Moment,” or Something
Worse. Policy Note 2013/9. Annandale-on-Hudson, N.Y.:
Levy Economics Institute of Bard College. October.
Norris, F. 2013. “Investors in Europe See a Glass Half Full
and Rising.” The New York Times, September 13.
Papadimitriou, D. B., G. Hannsgen, and G. Zezza. 2011. Is the
Recovery Sustainable? Strategic Analysis. Annandale-on-
Hudson: N.Y.: Levy Economics Institute of Bard College.
December.
Papadimitriou, D. B., G. Hannsgen, and M. Nikiforos. 2013.
Is the Link between Output and Jobs Broken? Strategic
Analysis. Annandale-on-Hudson, N.Y.: Levy Economics
Institute of Bard College. March.
Papadimitriou, D. B., G. Hannsgen, M. Nikiforos, and G.
Zezza. Forthcoming. Working Paper. Annandale-on-
Hudson, N.Y.: Levy Economics Institute of Bard College.
Papadimitriou, D. B., M. Nikiforos, and G. Zezza. 2013. The
Greek Economic Crisis and the Experience of Austerity: A
Strategic Analysis. Annandale-on-Hudson, N.Y.: Levy
Economics Institute of Bard College. July.
Pisano, G., and W. Shih. 2012. “A Fix for America’s Industrial
Commons.” Financial Times, November 12.
Plumer, B. 2013. “The Coming R & D Crash.” Washington
Post Wonkblog, February 26.
18 Strategic Analysis, October 2013
Popper, N. 2013. “Old Economies Rise as Growing Markets
Begin to Falter.” The New York Times, August 14.
Rampell, C. 2013. “Mandatory Federal Cuts Hurt Private
Sector, Too.” The New York Times, June 26.
Reif, R., and C. Barrett. 2013. “Science Must Not Be a Victim
of Washington Spats.” Financial Times, February 26.
Rosenbaum, D., S. Dean, and R. Greenstein. 2013. “Cuts
Contained in SNAP Bill Coming to the House Floor
Would Affect Millions of Low-Income Americans.”
Washington, D.C.: Center on Budget and Policy
Priorities. September. www.cbpp.org/files/9-6-13fa.pdf.
Roubini Monitor. 2013a. “Structural and Cyclical Factors in
China’s Investment-led Slowdown.” Roubini Monitor,
August 28.
———. 2013b. “EM Currencies’ Huge Real Appreciation
over the Past Decade.” Roubini Monitor, August 29.
Ruggles, N., and R. Ruggles. 1992. “Household and
Enterprise Saving and Capital Formation in the United
States: A Market Transaction View.” Review of Income
and Wealth 38(2): 119–62.
Shaikh, A. 2012. “Three Balances and Twin Deficits: Godley
versus Ruggles and Ruggles.” In D. B. Papadimitriou and
G. Zezza, eds. Contributions in Stock-flow Modeling: Essays
in Honor of Wynne Godley. New York: Palgrave Macmillan.
Shaikh, A., G. Zezza, and C. H. Dos Santos. 2003. Is
International Growth the Way Out of US Current Account
Deficits? A Note of Caution. Policy Note 2003/6.
Annandale-on-Hudson, NY: Levy Economics Institute of
Bard College. September.
Thirlwall, A. P. 2002. The Nature of Economic Growth: An
Alternative Framework for Understanding the
Performance of Nations. Northampton: Edward Elgar.
Weisman, J., and A. Lowery. 2013. “Hard Budget Realities as
Agencies Prepare to Detail Reductions.” The New York
Times, February 24.
WEF (World Economic Forum). 2013. The Global
Competitiveness Report 2012−2013. Geneva: WEF.
Recent Levy Institute Publications
STRATEGIC ANALYSIS
Rescuing the Recovery: Prospects and Policies for the
United States
. , ,
, and
October 2013
Is the Link between Output and Jobs Broken?
. , , and
March 2013
Back to Business as Usual? Or a Fiscal Boost?
. , , and
April 2012
PUBLIC POLICY BRIEFS
More Swimming Lessons from the London Whale
No. 129, 2013
From Safety Nets to Economic Empowerment
Is There Space to Promote Gender Equality in the Evolution of
Social Protection?
No. 128, 2013
Fiscal Traps and Macro Policy after the Eurozone Crisis
and .
No. 127, 2012
It’s About “Time”
Why Time Deficits Matter for Poverty
, , and
No. 126, 2012
Minsky and the Narrow Banking Proposal
No Solution for Financial Reform
No. 125, 2012
Levy Economics Institute of Bard College 19
The Mediterranean Conundrum
The Link between the State and the Macroeconomy, and the
Disastrous Effects of the European Policy of Austerity
. .
No. 124, 2012
POLICY NOTES
A New “Lehman Moment,” or Something Worse? A Scenario
of Hitting the Debt Ceiling
2013/9
“Unusual and Exigent”: How the Fed Can Jump-start the
Real Economy
2013/8
Debt Relief and the Fed’s Money-creation Power
2013/7
A Failure by Any Other Name: The International Bailouts
of Greece
. .
2013/6
The New Rome: The EU and the Pillage of the Indebted
Countries
. .
2013/5
Lessons from the Cypriot Deposit Haircut for EU Deposit
Insurance Schemes
2013/4
ONE-PAGERS
Fiscal Sadism and the Farce of Deficit Reduction in Greece
. .
No. 43, 2013
Exit Keynes the Friedmanite, Enter Minsky’s Keynes
.
No. 42, 2013
Waiting for Export-led Growth: Why the Troika’s Greek
Strategy Is Failing
. , , and
No. 41, 2013
The Fed Rates that Resuscitated Wall Street
No. 40, 2013
The Impact of a Path to Citizenship on the US Economy
and Social Insurance System
No. 39, 2013
WORKING PAPERS
A Simple Model of Income, Aggregate Demand, and the
Process of Credit Creation by Private Banks
and
No. 777, October 2013
Fiscal Policy and Rebalancing in the Euro Area: A Critique
of the German Debt Brake from a Post-Keynesian
Perspective
and
No. 776, September 2013
Wage and Profit-led Growth: The Limits to Neo-Kaleckian
Models and a Kaldorian Proposal
and
No. 775, September 2013
Economic Crises and the Added Worker Effect in the
Turkish Labor Market
and
No. 774, September 2013
Keynes’s Employment Function and the Gratuitous Phillips
Curve Disaster
-
No. 773, August 2013
Nonprofit Organization
U
.S. Postage Paid
B
ard College
Blithewood
P
O Box 5000
A
nnandale-on-Hudson, NY 12504-5000
A
ddress Service Requested
o
f Bard College
Levy Economics
Institute