The greek economic crisis and the experience of austerity
Bạn đang xem bản rút gọn của tài liệu. Xem và tải ngay bản đầy đủ của tài liệu tại đây (999.06 KB, 16 trang )
Levy Economics Institute of Bard College
Strategic Analysis
July 2013
Greece
THE GREEK ECONOMIC CRISIS AND
THE EXPERIENCE OF AUSTERITY:
A STRATEGIC ANALYSIS
. , , and
Introduction
“Seen from Greece, the Great Depression looks good,” Floyd Norris (2013) observed in a recent
column in The New York Times.
In 1934, five years into the Great Depression, the United States had experienced a loss of
about 20 percent of GDP but its economic performance had begun to improve, reversing course
and moving toward growth. In the case of Greece, which has lost more than 20 percent of GDP
since the onset of the global financial crisis in 2008, GDP continues to decline (Figure 1).
Unemployment in the United States began to decrease after the fourth year of the Depression,
while in Greece it continues its upward trajectory, surpassing the highest US Depression-era level
and showing no sign of reversing anytime soon (Figure 2). By 1934, personal consumption
spending in the United States had started to recover, while in Greece it fell farther in 2012 than in
any other year of the contraction. The most important difference between the comparable tra-
jectories of these two economies is in government consumption spending (excluding investment
in infrastructure). In the United States, such spending continued to grow during the ’30s down-
turn, helping to arrest the economy’s fall. In Greece, however, it has fallen severely, by 9.1 percent
last year alone—one of the steepest declines in the country’s continuing contraction (Norris
2013). And employment remains in free fall: over one million jobs have been lost since the peak
in October 2008, a drop of more than 28 percent, while the “official” number of workers unem-
ployed in March 2013 exceeded 1.3 million, or 27.4 percent of the labor force—the highest level
in any industrialized country in the free world during the last 30 years (Figure 3).
The financial support provided by the European Social Fund and the Greek Ministry of Labour and Social Insurance as part of the
Development of Human Manpower program is gratefully acknowledged.
The Levy Institute’s Macro-Modeling Team consists of President
. , and Research Scholars ,
, and . All questions and correspondence should be directed to Professor Papadimitriou at
845-758-7700 or Copyright © 2013 Levy Economics Institute of Bard College.
of Bard College
Levy Economics
Institute
2 Strategic Analysis, July 2013
Sources: BEA; ElStat
72
76
80
84
88
92
96
100
Greece (2008=100)
United States (1929=100)
+4+3+20 +1
+5
Figure 1 Greece and the United States: Two Great
Depressions—Real GDP Indices
Years since Depression Began
Sources: BEA; ElStat
Percent
0
5
10
15
20
25
30
Greece (base year = 2008)
United States (base year = 1929)
+4+3+20 +1 +5
Figure 2 Greece and the United States: Two Great
D
epressions—Unemployment Rates
Years since Depression Began
Figure 3 Greece: Employment and Unemployment
Source: ElStat
Thousands of Workers
3,400
3,600
3,800
4,000
4,200
4,400
4,600
Employment (left scale)
Unemployment (right scale)
2010200920082006 2007 2011
Thousands of Workers
200
400
600
800
1,000
1,200
1,400
2012
2013
Figure 4 Greece: Real GDP (2005=100)
Sources: IMF; EC; authors’ calculations
Billions of Euros
160
170
180
190
200
210
220
Baseline Scenario
Troika Projections (May 2010)
Troika Projections (December 2010)
Troika Projections (December 2011)
Troika Projections (June 2013)
150
The current economic conditions in Greece are, by and
large, the result of foolish policy based on a shaky economic
theory that advocates “expansionary austerity,” along with
labor market reforms, as the best recipe for medium- and
long-term growth in countries that, like Greece, are running
large government deficits and high levels of public debt as a
percentage of GDP.
In this report we argue, on the basis of simulations drawn
from the newly constructed Levy Institute macroeconometric
model for Greece, or LIMG (see Papadimitriou, Zezza, and
Nikiforos 2013), that prolonged austerity will result in a con-
tinuous fall in employment, since real GDP cannot grow fast
enough to arrest, let alone reverse, the downward trend in the
labor market. Our projections are therefore more pessimistic
than those made by either the European Commission (EC
2013) or the International Monetary Fund (IMF 2013c) in its
latest review of the Greek “economic adjustment” program. In
a report issued in May, the IMF—a member, along with the
EC and the European Central Bank, of the group of interna-
tional lenders known as the “troika”—acknowledged the seri-
ous errors in assumptions about projected annual deficits and
debt-to-GDP ratios, growth of GDP, and unemployment rates
emanating from the unrealistically low value of fiscal multi-
pliers applied to spending cuts and tax increases (IMF 2013b).
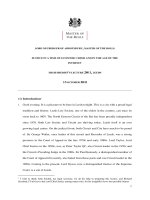
Figures 4 and 5 illustrate the troika’s successive erroneous pro-
jections for real GDP and real GDP growth, respectively; in
each, a vertical rule denotes the last year for which we have
historical data (2012) and the black line denotes our own
baseline projections, should the current austerity policy be
continued. Similarly, Figure 6 documents the successive pro-
jections of the troika as well as our own for the path of unem-
ployment. With joblessness in Greece now above 27 percent—
a stark indicator of the troika’s failure to accurately project the
consequences of their own policies—it’s astonishing that EC
and IMF officials continue to ask for more of the same. For
example:
Figure 5 Greece: Real GDP Growth Rate
Sources: IMF; EC; authors’ calculations
Percent
Baseline Scenario
Troika Projections (May 2010)
Troika Projections (December 2010)
Troika Projections (December 2011)
Troika Projections (June 2013)
20042000
2016
2008 2012
-4
0
4
8
-8
2002 2006 2010 2014
Figure 6 Greece: Unemployment Rate
Sources: IMF; EC; authors’ calculations
Percent
Baseline Scenario
Troika Projections (May 2010)
Troika Projections (December 2010)
Troika Projections (December 2011)
Troika Projections (June 2013)
20042000 20162008 2012
5
10
15
20
25
35
30
2002 2006 2010 2014
Levy Economics Institute of Bard College 3
4 Strategic Analysis, July 2013
Countries should press on with needed balance sheet
repair and structural reforms. Long-standing structural
rigidities need to be tackled to raise long-term growth
prospects. Southern Europe needs to increase compe-
titiveness in the tradable sector, especially through
labor market reforms. . . . These measures will help
reduce unemployment and rebuild competitiveness
in the periphery. (IMF 2013a, 49)
Our baseline projection about loss of employment, shown
in Figure 6, paints a completely different picture, with the pres-
ent policy delivering an even greater unemployment rate—close
to 34 percent—by the end of 2016. Despite the IMF’s mea culpa
in its May report, both the IMF and the EC are still projecting
a continuing recession for the first part of 2014 but a return to
economic and employment growth in 2014 and beyond. This,
of course, is impossible to achieve unless a coherent pattern of
strong growth in the components of aggregate demand
emerges well before the latter part of this year, given the nor-
mal lag between GDP growth and employment creation.
In the following section we investigate the determinants of
aggregate demand, while in subsequent sections we analyze their
plausible evolution over time, based on the troika’s projections
and our own evaluation; describe the assumptions on which
our simulations are based; and offer policy proposals for the
intermediate run. We should make clear, however, that these
simulations are not short-term forecasts. Instead, we use the
LIMG, which is based on a consistent framework of stock and
flow variables, to trace a number of possible medium-term
scenarios in order to evaluate strategic policy options.
Recent Developments in Aggregate Demand
Aggregate demand and its components have seen further
declines since our last report (Papadimitriou, Zezza, and
Duwicquet 2012). The last available data for real GDP growth
show that during 2012 another 5.7 percent of output was lost,
and the recent second estimate for the first quarter of 2013
continues the downward trend, with real GDP falling by 5.6
percent against the same quarter in 2012.
Figure 7 presents the contribution of each component of
aggregate demand to the real GDP growth rate as of the first
quarter of 2013. Each series is obtained by multiplying the
annual growth rate of the respective component of demand
by its share in GDP for the previous quarter, so that the real
GDP growth rate can be obtained by summing up each line.
Figure 7 Greece: Contributions to Real GDP Growth
Source: ElStat
Annual Growth Rate
-12
-8
-4
0
4
8
GDP
Exports
Consumption
Investment
Government Expenditure
Imports (reversed)
200820062004
2012
2010
Figure 8 Greece: GDP Components
Source: ElStat
Investment (left scale)
Exports (left scale)
Government Expenditure (left scale)
Consumption (right scale)
200820062004 20122010
Annual Level (in billions of euros)
24
28
32
36
40
44
48
52
56
60
Annual Level (in billions of euros)
110
120
130
140
150
160
170
180
190
200
The growth rate of imports is shown in Figure 7 with the sign
reversed, because of its negative impact on GDP growth. The
annual level of each contribution in money terms is shown in
Figure 8.
As shown starkly in Figures 7 and 8, the major determi-
nant of growth before the downturn was consumption, which
has since turned into the major GDP reducer, steadily declin-
ing in the last three years by more than any other component.
Investment boomed for two years before the beginning of the
crisis in 2007 but has since reversed course, declining at a rate
of 3–4 percent. Real government expenditure was also a sig-
nificant contributor to both aggregate demand and growth up
to 2009 but has been declining procyclically since then under
the heavy pressure applied by the troika to meet the deficit and
debt targets agreed upon in exchange for the bailout programs.
What had been the normal role for government to play dur-
ing a downturn became antithetical to the troika’s prescrip-
tions. The feedback loop from the steep decline in public
expenditure has been leading the way to a deepening reces-
sion. Figure 7 clearly shows the path of GDP growth closely
following that of consumption as the component with the
heaviest weight in determining aggregate demand.
Exports, with their unstable trend before and after the
crisis, have so far been unable to offset the drop in domestic
demand. Indeed, they were decreasing, on an annual basis, in
the last quarter of 2012. The feeble performance of exports
demonstrates yet another failure of the troika’s policies and its
insistence on the forced reduction in unit labor costs—by
decreasing wages via government fiat—as a means of increas-
ing competitiveness and achieving export-led growth.
At the same time, this strategy has, naturally, been proven
detrimental to domestic consumption, despite the (now dis-
credited) theory
1
that provided the academic seal of approval
for the troika policy—the claim that “expansionary austerity”
via severe fiscal contractions would not have any discernible
effects on output if they were obtained through cuts in public
spending rather than increases in taxation, allowing market-
based incentives to work properly. Finally, the large drop in
imports, a result of the deep recession, contributed minimally
to real GDP growth.
What is shown in Figure 8 is crucial for our simulated
scenarios. Notice that, almost at the same time, exports grew
as government expenditure started to contract at the end of
Levy Economics Institute of Bard College 5
2009, but so far, the increase of almost 8 billion euros from
their trough has been insufficient to balance the fall in gov-
ernment expenditure of 13 billion euros measured over the
same period. When austerity began, in 2009–10, the economy
was already experiencing a fall in investment that had started
at the end of 2007, coincident with the beginning of the global
Great Recession. In money terms, investment has fallen by
almost 34 billion euros since its peak at the end of 2007 and
in the first quarter of 2013 reached a record low of 25 billion
euros. Contrary to the claim of the “expansionary austerity”
theory estimating the fiscal multiplier to be close to zero, or
even less than zero, the fall in government expenditure and
investment has proven to yield a much larger output loss, ren-
dering the value of the multiplier higher than 2.5. In concert
with the drop of output and employment, consumption
declined by almost 30 billion euros, as shown in Figure 8.
While it might be possible for exports to grow further, it
is very unlikely that the increase in net exports could be strong
enough to counter the fall of the other components of aggre-
gate demand. We will next analyze the determinants of these
constituent parts of GDP growth to set the stage for the
model’s simulations.
Figure 9 Greece: Real Disposable Income and Private
Expenditure
Sources: ElStat; authors’ calculations
Annual Growth Rate in Percent
Disposable Income with Net Capital Transfers
Current Disposable Income
Private Expenditure
200820062004 20122010
-15
-5
0
5
10
15
-10
6 Strategic Analysis, July 2013
Private expenditure
In an earlier report, we found that private expenditure—the sum
of consumption and investment—was driven by the private
sector’s disposable income and net financial wealth, together
with the additional effects of access to borrowing and capital
gains arising from the equities market (see Papadimitriou,
Zezza, and Duwicquet 2012).
2
The dynamics of real disposable income and private expen-
diture are illustrated in Figure 9. It is interesting to note that,
when comparing Figure 9 with Figure 8, private expenditure
grew faster (slower) than income when investment was buoy-
ant (depressed). Figure 9 also traces the two different measures
of real disposable income: with and without net capital trans-
fers. The former experienced a large spike in the third quarter
of 2012, reflecting a transfer of capital from the public sector
to the banking sector to prop up a failing bank and prevent
another crisis from occurring, but with no discernible stimu-
lus to aggregate demand. Despite the apparent improvement
of all three variables in 2012, their outlook still seems negative.
Net financial wealth of the private sector measured at cost
3
has declined steadily since Greece entered the eurozone, and
since foreign debt exceeded government debt in 2008, the private
sector has become a net debtor, according to our measure.
4
As
the austerity programs continue to contribute adversely to the
net financial wealth of the private sector, some improvement
may eventually come from any decrease in foreign debt result-
ing from improvement in the current account.
Our econometrics reveal that additional effects on private
expenditure are obtained by the availability of credit, and by
the willingness of firms and households to borrow. The latest
data available (fourth quarter of 2012) for household and cor-
porate nonfinancial borrowing are shown in Figure 10. The
figure clearly illustrates that the rate of borrowing before the
crisis was increasing, contributing to a rising debt-to-GDP
ratio, with the household sector borrowing at an average rate
of 8 percent of GDP over the 2005–08 period, while the corpo-
rate nonfinancial sector borrowing rate reached 15 percent and
average borrowing for the entire private sector climbed to 23
percent in 2008, against an average nominal GDP growth rate
of about 6 percent. Once the crisis hit, both sectors moved pre-
cipitously toward negative territory, reflecting liquidity con-
straints, deleveraging, and other effects commensurate with the
downturn. The analogous levels of the stock of accumulated
liabilities (debt) of these two sectors are reported in Figure 11.
Examining Figures 10 and 11 more closely, we notice that,
together with negative borrowing, GDP also falls, pushing the
Figure 10 Greece: Private Sector Borrowing
Sources: Bank of Greece; ElStat
Percent of GDP
Nonfinancial
Corporate Nonfinancial
Households
20072005 20112009
-8
8
16
24
0
2013
Note: To eliminate seasonal fluctuations, data are presented as four-quarter
moving averages.
20
12
4
-4
2006 2008 2010 2012
Figure 11 Greece: Private Sector Gross Debt
Sources: Bank of Greece; ElStat
Percent of GDP
Nonfinancial
Corporate Nonfinancial
Households
20072005 20112009
80
120
160
200
240
40
0
2013
Levy Economics Institute of Bard College 7
stock of debt relative to GDP toward an increasing trend;
most noticeably, in the corporate nonfinancial sector. This
forms the basis of our assumption in running the model’s
simulations, in that the negative borrowing trend will con-
tinue as long as real GDP keeps falling.
The value of equities and housing are also drivers of invest-
ment and consumer spending. Our econometric analysis has
shown that net capital gains from the equities market increase
private expenditure at a faster rate than disposable income
alone, while the evidence of the effects of net capital gains
from the housing market on private expenditure is much
weaker. Figure 12 illustrates two measures: net capital gains
from the stock and housing markets obtained from the annual
growth in price indexes, net of nominal GDP growth. The two
trend lines correspondingly measure the net gain obtained
each year from buying equities or (existing) houses against
the gains obtained by investing in activities with a return
equal to output growth plus inflation. Our measures show
that housing prices increased considerably in the first part of
the 2000s, when the stock market was not performing well,
whereas both markets were subsequently profitable for a few
years, then plummeted as the recession took hold. The crash
in the stock market price index, from the previous peak of 163
in the third quarter of 2007 to 19 in the second quarter of
2012 (a fall of more than 88 percent), was so dramatic that the
63 percent increase witnessed between the second quarter of
2012 and the first quarter of 2013 barely lifted the value of the
market to where it was at the end of 1995. Although it is con-
ceivable that the increase in the equities market will continue,
from the combined effects of public enterprise privatizations
and selected companies’ depressed values, it is doubtful that
the lack of liquidity in the banking sector now limiting the
financing options of corporations will generate investment.
House prices, on average, continue to slide. Average prices
have fallen dramatically from the previous peak of our calcu-
lated index at the end of 2005, reverting to their 2003 level. We
see no reason for a reversal of this downward trend, but
assume that housing prices will stop falling during our simu-
lation period ending in 2016.
Net exports
We saw in Figures 7 and 8 that net exports are augmenting
real GDP growth mainly because of the drop in imports.
Figure 13 breaks out the corresponding real growth rate of
exported goods and services. The former increased very sig-
nificantly in 2010, recovering some of the drop that occurred
after 2008, but this does not indicate a stable trend, even though
a small increase has been achieved since the second quarter of
2012. On the other hand, the growth rate of exports of serv-
ices, which exceeded that of goods exports prior to the crisis,
has been mostly negative, and has experienced yet another
major decline since the beginning of 2012.
Figure 12 Greece: Relative Changes in the Price of Assets
Sources: Bank of Greece; ElStat
Stock Market (left scale)
Housing Market (right scale)
200420022000 20082006
Percent
-80
-60
-40
-20
0
20
40
60
80
Percent
-12
-8
-4
0
4
8
12
20122010
F
igure 13 Greece: Real Growth Rate of Exports
Source: ElStat
Percent
Exported Goods
Exported Services
20072005 201320112009
-10
0
10
20
30
-20
-30
2006 2008 2010 2012
8 Strategic Analysis, July 2013
As discussed earlier, the strategy imposed by the troika
aimed at increasing exports through an internal devaluation
(i.e., a decrease in unit labor costs) has not brought about
the anticipated effects, despite the reduction in relative unit
labor costs achieved since 2010. The current levels of three
harmonized competitiveness indexes based on consumer
prices, GDP deflators, and unit labor costs are depicted in
Figure 14. The indexes are contrasted on the basis of the first
quarter of 1999, and are structured such that an increase in
value implies a decrease in competitiveness. Greece had
experienced one of the largest drops in competitiveness—
measured by unit labor costs—before the start of the reces-
sion but has since reversed course, at least in terms of unit
labor costs, showing the second-largest decrease after
Germany, which systematically maintains lower values for
all competitiveness indexes over the entire 1999–2013
period. Figure 14 also illustrates that, while relative Greek
unit labor costs have declined, consumer prices have not fol-
lowed suit.
Furthermore, while the eurozone debt crisis and world-
wide fiscal austerity have, in general, dampened export
growth, the countries that import the bulk of Greek goods
and services are outside the euro area (about 7.5 percent of
GDP in 2012), as shown in Figure 15. This figure provides a
breakdown of Greek exports by destination country as a
ratio of GDP. What emerges is that Greece has suffered a
reduction in its exports to Germany, once its major foreign
market, in addition to a decline in exports to other euro-
area countries. Exports to the United States have remained
stable but insignificant throughout, accounting for less than
1 percent of GDP. Thus, even a major increase in domestic
demand among Greece’s trading partners would have a minor
impact on the country’s aggregate demand and employment.
The composition of exports by technological content
from 1990 to 2011, obtained from the STAN database of the
Organisation for Economic Co-operation and Development
(OECD), is shown in Table 1. We report the first value avail-
able (1990), the value before Greece’s accession to the euro-
zone (2000), the value before the recession (2006), and the
last available data (2011). What emerges is that the strategy
of reducing unit labor costs to boost competitiveness has
been associated with relatively insignificant growth in
exports with higher technological content, while exports of
Figure 14 Eurozone: Competitiveness Indexes, by Country
Relative to Eurozone Average (1999Q1=100)
-20
-10 0
10 20 30
Belgium
Germany
Ireland
Greece
Spain
France
Italy
Cyprus
Luxembourg
Malta
Netherlands
Austria
Portugal
Slovenia
Finland
Source: Bank of Greece
Consumer Prices (April 2013)
GDP Deflators (2012Q4)
Unit Labor Costs (2012Q4)
Note: The Harmonised Competitiveness Indicator based on consumer prices is
not available for the eurozone as a whole and has been computed as the simple
average of the indices for all euro-area countries except Slovakia, an outlier
whose HPI increased by almost 100 percent between 1999 and 2013, against an
average euro-area increase of 0.7 percent.
Table 1 Greece: Exports of Goods (percent of GDP)
1990 2000 2006 2011
Agriculture 1.17 0.96 0.75 0.87
High-technology Industries 0.15 0.69 0.8 0.83
Medium-high-technology
Industries 0.6 1.03 1.19 1.26
Medium-low-technology
Industries 2.23 2.56 2.62 5.21
Low-technology Industries 4.21 2.95 2.15 2.18
ICT Manufactures 0.12 0.47 0.42 0.37
Source: OECD
Levy Economics Institute of Bard College 9
agricultural goods and those mostly in the medium-low-tech-
nology category show much higher growth increases.
Moreover, the recent large increase in the value of Greek
exports is due to oil refinery operations, which are a sizable
export component and positively affected by an increase in the
price of oil. Overall, then, the current strategy of basing the
Greek recovery on exports may be shifting production toward
sectors with lower value added, and larger volatility for oil-
related trade.
Goods imports have fallen significantly, from 34 percent
of GDP in 2008 to about 24 percent in 2009, but no further
decline in the import propensity has been generated through
price adjustments, and imports are now at 23 percent of GDP
in real terms (25 percent when both are measured in euros).
Services imports, however, have not declined as much as goods
imports but have fluctuated around 6 percent of GDP, with no
visible impact from changes in relative prices.
The increase in the value of goods exports, and the over-
all decline in imports, result in an improvement in the balance
of trade, as reported in Figure 16.
The current account balance and the financial account
The net payment flows from the rest of the world, other than
those arising from trade, are shown in Figure 17. Greece was
Figure 15 Greece: Exports of Goods, by Destination
Source: OECD
Percent of GDP
Rest of World
Other Eurozone Countries
Germany
United States
201020061990
2
4
6
8
0
1994 1998 2002
Figure 16 Greece: Balance of Trade
Source: ElStat
Percent of GDP
15
25
35
45
Balance of Trade (right scale)
Imports (left sale)
Exports (left scale)
201120092005 2007 2013
-16
-12
-8
-4
Percent of GDP
Note: To eliminate seasonal fluctuations, data are presented as four-quarter
moving averages.
Figure 17 Greece: Net Payments from Abroad
Source: ElStat
Percent of GDP
Capital Transfers
Other Current Transfers
Compensation of Employees
Other Property Income
Interest
20072005 201320112009
-1
0
1
2
3
-2
-5
-3
-4
10 Strategic Analysis, July 2013
transferring resources out of the country in the form of inter-
est payments at about 5.8 percent of GDP, before the 2012 PSI
“haircut” that almost halved these payments.
5
When consid-
ering the effect of interest payments earned by Greek residents
on foreign assets at about 1.3 percent of GDP, total interest
payments as of the fourth quarter of 2012 amounted to about
1.7 percent of GDP. To be sure, this figure seems very low, con-
sidering that both the private and public sectors are net debtors
and that the sum of their gross liabilities largely exceeds 200
percent of GDP.
We turn next to the stock composition of foreign assets
and liabilities. Table 2 starkly shows the dramatic increase in
foreign debt, a consequence of the prolonged current account
deficit. Greece’s overall net debt increased from 56 percent of
GDP at the end of 2000 to 126.6 percent of GDP by the end of
2012. Public debt held abroad, as of the end of 2012, amounted
to 122 percent of GDP. It is interesting to note the recently
changed nature of debt financing, with a considerable drop in
public securities held abroad—which now amount to only
about 20 percent of GDP—and a strong increase in long-term
loans to the government that reflects the European Union
(EU) and IMF bailouts. As noted above, the private sector is
also a net debtor to the rest of the world, and the latest num-
bers reflect the changed nature of the composition of Greek
liabilities held by foreigners, with a drop in Greek equities
from 36 percent of GDP in 2006 to the current 15 percent of
GDP, and a strong increase in liquid assets (“deposits”), which
increased from 41 percent of GDP in 2006 to the current level
of 103 percent of GDP. A large part of the decrease in the value
of Greek equities held by foreigners is undoubtedly the result of
the drop in their market value, which decreased by about 80
percent from 2006 to the end of 2012.
Fiscal policy
Fiscal policy has been following, to a large extent, the austerity
program imposed by Greece’s international lenders (the troika)
in exchange for financing the continuing public sector deficits
and rolling over government securities when they become due.
In Figure 18, the major components of government current
expenditures, both actual and projected in accordance with
the latest forecasts from the troika, are shown. We adopt these
forecasts to form our baseline projection for fiscal policy.
6
What the troika’s austerity plan has achieved is a consid-
erable drop in most components of government expenditure,
save for those not affected by the recession (i.e., interest pay-
ments). Intermediate consumption has decreased by 5.6 billion
euros from its 2007 level; employee compensation, which con-
tinued to rise up to 2009, is now 1.2 billion euros below its
2007 level. Carefully examining the EC/IMF projections for both
variables, however, reveals a significant decline in the years
beginning in 2013, as shown in Figure 18. In addition, social
benefits, which automatically increase with unemployment and
are now 4.7 billion euros higher than in 2007, are projected to
decrease in 2013 to conform with the troika’s optimistic esti-
mates of decreasing unemployment. Interest payments on
debt are shown to have increased steadily until the “haircut”
Table 2 Greece: Foreign Assets and Liabilities (ratio to GDP)
2000 2006 2012
Assets Liabilities Net Assets Liabilities Net Assets Liabilities Net
Monetary Gold and SDRs 1.1 – 1.1 0.9 – 0.9 2.8 – 2.8
Deposits 29.4 29.7 -0.3 29.0 41.0 -12.0 51.4 103.4 -52.0
Securities: Private 12.9 3.0 9.9 28.9 2.8 26.2 49.3 1.1 48.2
Securities: Public 0.0 44.5 -44.5 0.1 68.5 -68.4 7.3 27.1 -19.8
Loans: Private 2.8 7.7 -4.9 2.5 11.6 -9.1 3.0 9.3 -6.3
Loans: Public – 7.3 -7.3 – 9.9 -9.9 – 102.6 -102.6
Shares and Other Equity 6.5 14.0 -7.6 9.3 36.3 -27.0 19.9 15.0 4.9
Other 1.9 4.4 -2.4 3.3 3.2 0.2 4.3 6.1 -1.8
TOTAL 54.6 110.6 -56.0 74.1 173.3 -99.2 138.0 264.6 -126.6
Source: Bank of Greece
Levy Economics Institute of Bard College 11
implemented in 2012, which together with the downward
interest rate adjustment reduced expenditure by 5.3 billion
euros over the previous year. Since the fiscal multiplier of gov-
ernment expenditure is much larger than what is assumed in
the troika plan, the reduction of the interest expenditure as a
share of GDP has been modest, given the large fall in output.
The major components of government current revenues,
actual and projected, are illustrated in Figure 19. Social con-
tributions respond to the business cycle; after an increase in
2008 they have been declining, although more slowly than
GDP, so that the ratio to GDP increased slightly. They are pro-
jected to grow modestly according to the EC/IMF, on the
assumption of employment growth. Revenues from indirect
taxes have also declined with the fall in output, but more
slowly than GDP. Direct taxes are the only component that has
increased against the fall in income, providing about 1 billion
euros more in revenue in comparison to 2007. Against a falling
GDP, this implies a dramatic increase in the ex post implicit
tax rate; this variable is projected to remain more or less sta-
ble up to 2016.
Other minor savings are expected from less important
components of the government balance, while public invest-
ment is projected to increase in 2013 by about 500 million euros,
and by smaller amounts in the coming years. Meanwhile, capital
transfers received by the government are expected to decline
moderately.
The implications of the troika plan for the overall govern-
ment deficit are reported in Figure 20, which shows that the
deficit, net of capital transfers, will fall considerably
7
in 2013
and continue decreasing, eventually reaching less than 4 per-
cent by 2016—provided that no further capital transfers are
put in place and, above all, that the troika’s projections for
GDP are realized. This is a result that we will strongly question
with our model simulations, to which we turn next.
Sources: ElStat; EC; IMF
Percent of GDP
0
4
6
12
16
20
24
Social Benefits
Compensation of Employees
Intermediate Consumption
Interest
201220102008
2004
2006 2016
Figure 18 Greece: Government Current Expenditure
2014
Sources: ElStat; EC; IMF
Percent of GDP
7
8
10
11
12
13
14
Social Contributions
Indirect Taxes
Direct Taxes
201220102008
2004
2006 2016
F
igure 19 Greece: Government Current Revenue
2014
9
Sources: ElStat; EC; IMF
Percent of GDP
0
4
12
16
Net Borrowing/Lending
Net of Capital Transfers
2012201020082004 2006 2016
Figure 20 Greece: Government Deficit
2014
8
12 Strategic Analysis, July 2013
Model Simulations: The Impact of Austerity
for 2013–16
In running simulations of the paths for the exogenous variables
in our LIMG model, we use the results from the analysis above.
In addition to the path for fiscal policy variables (public rev-
enues and expenditures) discussed in the previous section, we
assume that monetary policy will maintain its current stance,
so that interest rates remain at a very low level, and that no
significant changes will occur to the exchange rate of the euro.
We use the recent OECD (2013) Economic Outlook for projec-
tions of foreign output and inflation, as codeterminants of the
performance of Greek exports, and assume no price increases
in Greece but rather a moderate increase in the stock market
index (implying a stop to the rally of the past two quarters).
Baseline scenario
We begin with a baseline scenario that adopts assumptions
based on the troika’s projections for changes in government
revenues and outlays as outlined in its latest reports (EC 2013,
IMF 2013c). The main results of our econometric analysis con-
firm that the fall in net financial wealth explains the decline in
private expenditure over disposable income. Regarding the
country’s foreign sector, our analysis, which is compatible with
the Country Report issued in June by the IMF (2013d), shows
Source: Authors’ calculations
Billions of Euros
140
150
160
170
180
190
200
Baseline Scenario
Marshall Plan Scenario
GDP Target Scenario
Deficit Target Scenario
2013201220112010 2014
Figure 21 Greece: Alternative Scenarios for Real GDP
2015 2016
Source: Authors’ calculations
Thousands of Jobs
3,500
3,900
4,000
4,100
4,200
4,300
4,400
2013201220112010 20162014
Figure 22 Greece: Alternative Scenarios for Employment
2015
3,600
3,700
3,800
Baseline Scenario
Marshall Plan Scenario
GDP Target Scenario
Deficit Target Scenario
that there is a high elasticity of goods exports to the income of
Greece’s trading partners, a higher elasticity for services exports,
and no short-run impact from relative prices.
8
The implication
of our findings is that achieving growth in exports through
internal devaluation will take a very long time, and further-
more, that the declining fortunes of Greece’s major trading
partners do not bode well for the country’s exports. As men-
tioned above, some recent increases from oil refinery exports
were achieved primarily from increases in the price of oil,
which is known for its volatility. When it comes to imports,
the econometric analysis shows high income elasticity for both
goods and services imports, and a small short-run effect from
relative prices.
9
The implication of this finding is that imports
decline quickly in concert with falling income, and that import
substitution can be a slow process.
Our base-run simulations rooted in the planned austerity
program agreed to by Greece’s present government and its
international lenders show that GDP will grow more slowly,
that employment will decline further than the corresponding
troika projections, and that the deficit targets for the interme-
diate run will not be met. Our projections are depicted in black
in Figures 21–23. As Figure 21 shows, GDP continues to decline
until 2014, stabilizes in 2015, and grows slightly in 2016, reach-
ing a level of about 158 billion euros at the end of that year.
Levy Economics Institute of Bard College 13
Similarly, employment (Figure 22) declines by at least another
30,000 workers by 2014 before increasing to slightly over 3.6
million workers—an increase of about 50,000 from present
levels. The deficit-to-GDP ratio (Figure 23) worsens, reaching
7.6 percent by the end of the simulation period. Based on pre-
vious experience of the troika’s response to missed targets, it
will most likely become necessary in subsequent troika reviews
to implement additional measures—that is, spending cuts or
tax increases, more rapid privatization, or a combination of
these to meet the targets for deficit reduction and GDP
growth, unless those targets are revised downward.
1
0
Troika deficit target scenario
In this scenario, we modify our assumption as to how much
more austerity will be needed to meet the deficit-to-GDP
ratio targets. The results of this exercise and the implications
for GDP growth and employment are summarized in red in
Figures 21–22. Meeting the deficit target will put more pres-
sure on GDP, which grows more slowly than in the baseline
scenario (Figure 21), while employment declines more than in
our baseline, shedding about 90,000 jobs by the end of the
simulation period (Figure 22).
Troika GDP target scenario
Meeting a GDP target requires less austerity than currently
included in the troika agreement. In this scenario, we compute
the amount of fiscal stimulus needed to reach the GDP target
as shown in the troika’s latest projections (IMF 2013c). Naturally,
a fiscal stimulus worsens the government’s budget deficit, which
steadily increases, rising above 12 percent by mid-2016 (Figure
23), while the current account balance also worsens, with a
deficit exceeding 5 percent (Figure 24). Meeting the GDP tar-
get—requiring about 41 billion euros of fiscal stimulus—also
increases employment, by more than 160,000 jobs above the
baseline scenario by the end of the simulation period (Figure 22).
This scenario and the deficit target scenario discussed
above clearly illustrate the fundamental problem with the
troika’s projections, which, as outlined in the IMF’s May report,
contain signs of faulty thinking. In addition to the errors in the
values of the fiscal multipliers and the doctrine of “expansion-
ary austerity,” there are implicit supply-side effects emanating
from market liberalization and internal devaluation, with all
effects converging to produce higher output growth and
employment, together with lower deficit-to-GDP ratios. These
flaws help to explain why, in the absence of any level of eco-
nomic stimulus, the troika projections are so optimistic. In
other words, the troika model is still based on theoretical
Source: Authors’ calculations
Percent of GDP
0
4
6
8
10
12
14
2013201220112010 20162014
Figure 23 Greece: Alternative Scenarios for the Government
Current Deficit
2015
2
Baseline Scenario
Marshall Plan Scenario
GDP Target Scenario
Deficit Target Scenario
Source: Authors’ calculations
Percent of GDP
-12
-8
-4
0
4
8
201320122011
2010
20162014
Figure 24 Greece: Alternative Scenarios for the External
Account
2015
Baseline Scenario
Marshall Plan Scenario
GDP Target Scenario
Deficit Target Scenario
14 Strategic Analysis, July 2013
assumptions that have been proven wrong by the spectacular
failure of the austerity programs of the last three years.
“Marshall Plan” scenario
The results of the LIMG simulations of the baseline troika
plan and the alternative deficit target and GDP target scenar-
ios are not encouraging. As the evidence has shown, austerity
leads to a path of continuous recession, lower employment,
declining incomes, and higher levels of poverty.
We now turn to a plausible public spending plan and its
likely effect on the outcomes of the previous three scenarios.
We base our projections on an increase in government con-
sumption or investment using special funds from the
European Investment Bank or another EU institution. The
amount of this exogenous stimulus—which has been dis-
cussed in many eurozone meetings—is assumed to be 30 bil-
lion euros, used at a rate of about 2 billion euros each quarter
beginning in the third quarter of 2013. The results of this
rather modest stimulus are illustrated in blue in Figures
21–24. The projected path of GDP growth exceeds all previ-
ous scenarios and ultimately converges with the GDP target
scenario in mid-2016 at about 175 billion euros (Figure 21),
while employment growth is also higher than in the previous
scenarios, showing an increase of more than 200,000 jobs
above the baseline scenario (Figure 22). The government
deficit is lower than in the baseline and GDP target scenarios,
reaching a bit over 4 percent of GDP (Figure 23), while the
current account balance is above that in the baseline scenario,
reaching a surplus of close to 2 percent of GDP at the end of
the simulation period.
Conclusions
This analysis seeks answers to Greece’s continuing spiral of lost
GDP and employment and higher public deficits and debt,
which in our view is the result of foolish policy enacted by the
government in its attempt to comply with the terms of a fiscal
consolidation program imposed by its international lenders.
The simulations discussed above show clearly that any form of
fiscal austerity results in output growth and employment
falling into a tailspin that becomes harder and harder to
reverse. We have shown that a relatively modest fiscal boost
funded by the appropriate EU institutions could not only
arrest the further declines in GDP and employment but also
reverse their trend and put them on the road to recovery. A
Marshall-type recovery plan directed at public consumption
and investment is realistic and has worked in the past. Much
research in recent years suggests that fiscal stimulus has larger
effects, especially when short-term interest rates have reached
unprecedented low levels (Stehn 2012). To reduce unemploy-
ment that is destined to hit the 30 percent mark within a short
period of time, we would advocate an expanded public serv-
ice work program proven effective both in Greece and in
many other countries (see Antonopoulos, Papadimitriou, and
Toay 2011). It is inconceivable that such a large rebalancing of
the Greek economy could take place without a drastic change
in the institutions responsible for running the eurozone—a
change that would involve shedding discredited theories
together with placing less than total reliance on market forces.
Acknowledgments
We would like to extend our sincere thanks to George Argitis,
Vasilis Papadogabros, Yanis Dafermos, Maria Nikolaidi, and
the Observatory of Economic and Social Developments of the
Labour Institute, Greek Confederation of Labour, for their
help and encouragement. The financial support provided by
the European Social Fund and the Greek Ministry of Labour
and Social Insurance as part of the Development of Human
Manpower program is also gratefully acknowledged.
Notes
1. See Alesina and Ardagna (1998); Alesina, Favero, and
Giavazzi (2012); Ardagna (2004); and Giavazzi and Pagano
(1990), among others.
2. There is some evidence of additional effects of net capital
gains arising from the housing market, but they seem to
be negligible.
3. Net financial wealth of the private sector is the counterpart
of the net debt of the foreign and public sectors, as deter-
mined by the macroeconomic identity. We estimate all these
stock measures (values) at cost by cumulating the under-
lying flows—that is, private sector saving, the govern-
ment deficit, and the (reciprocal of the) current account.
Our stock measures differ from published values of net
Levy Economics Institute of Bard College 15
financial wealth at market prices because they do not take
into account net capital gains arising from fluctuations in
the market price of the components of financial wealth
(e.g., securities and equities).
4. The “official” measure can be obtained from the financial
accounts published by the Bank of Greece as the sum of the
stocks of net foreign assets and net government liabilities.
This measure is declining steadily, becoming negative in
the 2000s, and is now negative by about 50 billion euros.
5. We are referring here to gross payments, while the data in
Figure 17 reflect net payments.
6. In passim, we have noted a discrepancy between our
major consistent data source, which is the “Quarterly
Non-financial Sector Accounts” published by ElStat, and
some of the figures used by the EC in producing their
forecasts. For instance, “social benefits other than social
transfers in kind” amount to 38.8 billion euros according
to ElStat, and to 44.4 billion euros according to the EC.
The figure used by the EC for the “general government
balance” for 2011 and 2012 is a deficit of 19.6 billion
euros and 12.3 billion euros, respectively, while figures from
our source suggest 21.8 and 12.8 billion euros, respec-
tively, and net lending—that is, the government balance
including net capital transfers—at a negative 19.4 billion
euros for 2012, given a large capital transfer from the gov-
ernment to the banking sector. In our projections for fis-
cal policy we adopt the same path suggested in the EC
document for all components of government expendi-
ture and revenue, but we apply their projected changes to
our consistent data source.
7. The EC measure of the government deficit is expected to
reach 7.6 percent of GDP in 2013, while our measure net
of capital transfers should fall to 4.2 percent. The latter
value is reported in Figure 20, which shows a more opti-
mistic path than that reported by the EC. A path similar
to that of the EC is obtained from our figures using the
“Net borrowing/lending” measure, which, however, is not
consistent with the EC measure for 2012.
8. Our calculations show a long-run income elasticity of 3.2
for goods exports and a long-run elasticity of 1.4 from
relative prices.
9. Our estimations for imports show a long-run income elas-
ticity of 1.4, while short-run relative price elasticity is 0.06.
10. The deficit and GDP targets could be affected should
another large debt restructuring take place in line with
that implemented in 2012.
References
Alesina, A., C. Favero, and F. Giavazzi. 2012. “The Output
Effect of Fiscal Consolidation.” Working Paper 18336.
Washington, D.C.: National Bureau of Economic
Research. August.
Alesina, A., and S. Ardagna. 1998. “Tales of Fiscal
Adjustment.” Economic Policy 13(27): 487–545.
Antonopoulos, R., D. B. Papadimitriou, and T. Toay. 2011.
“Direct Job Creation for Turbulent Times in Greece.”
Research Project Report. Annandale-on-Hudson, N.Y.:
Levy Economics Institute of Bard College and Athens:
Observatory of Economic and Social Developments,
GSEE. November.
Ardagna, S. 2004. “Fiscal Stabilizations: When Do They Work
and Why.” European Economic Review 48(5): 1047–74.
EC (European Commission). 2013. “The Second Economic
Adjustment Programme for Greece: Second Review
May 2013.” European Economy Occasional Papers,
No. 148. Brussels: Directorate-General for Economic
and Financial Affairs. May.
Giavazzi, F., and M. Pagano. 1990. “Can Severe Fiscal
Contractions Be Expansionary? Tales of Two Small
European Countries.” Working paper 3372. Washington,
D.C.: National Bureau of Economic Research. May.
IMF (International Monetary Fund). 2013a. World Economic
Outlook: Hopes, Realities, and Risks. Washington, D.C.:
IMF. April.
———. 2013b. “Greece: Ex post Evaluation of Exceptional
Access under the 2010 Stand-by Arrangement.” Country
Report No. 13/156. Washington, D.C.: IMF. June.
———. 2013c. “Greece: Third Review under the Extended
Arrangement under the Extended Fund Facility.”
Country Report No. 13/153. Washington, D.C.: IMF. June.
———. 2013d. “Greece: Selected Issues.” Country Report
No. 13/155. Washington, D.C.: IMF. June.
Norris, F . 2013. “Seen from Greece, Great Depression Looks
Good.” The New York Times, March 16.
OECD (Organisation for Economic Co-operation and
Development). 2013. Economic Outlook, No. 1. Paris:
OECD. May.
Papadimitriou, D. B., G. Zezza, and M. Nikiforos. 2013. “A
Levy Institute Model for Greece (LIMG): Technical
Paper.” Research Project Report. Annandale-on Hudson,
N.Y.: Levy Economics Institute of Bard College. May.
Papadimitriou, D. B., G. Zezza, and V. Duwicquet. 2012.
“Current Prospects for the Greek Economy: Interim
Report.” Research Project Report. Annandale-on-
Hudson, N.Y.: Levy Economics Institute of Bard College
and Athens: Observatory of Economic and Social
Developments, GSEE. October.
Stehn, S. 2012. “The Fiscal Multiplier at the Zero Bound.” US
Economic Analyst, No. 12/13. Goldman Sachs Global
ECS Research, March 30.
Appendix: Data Sources
Bank of Greece. Data accessed June 2013,
/>Hellenic Statistical Authority (ElStat). Data accessed June 2013,
/>Organisation for Economic Co-operation and Development
(OECD). Data accessed June 2013,
/>16 Strategic Analysis, July 2013