A study on correlations in financial market
Bạn đang xem bản rút gọn của tài liệu. Xem và tải ngay bản đầy đủ của tài liệu tại đây (891.69 KB, 116 trang )
A study on correlations in financial market
Li Erhe
NATIONAL UNIVERSITY OF SINGAPORE
2012
A study on correlations in financial market
Li Erhe
Supervisor: Dr. Xia Yingcun
An academic exercise presented in partial fulfillment for
degree of Master of Science
Department of Statistics and Applied Probability
NATIONAL UNIVERSITY OF SINGAPORE
2012
Acknowledgements
Foremost, I would like to express my sincere gratitude to my supervisor Prof. Xia
Yingcun for the continuous support of my master’s study and research, for his patience,
motivation, enthusiasm, and immense knowledge. His guidance helped me in all the
time of research and writing of this thesis. I could not have imagined having a better
advisor and mentor for my study. I would like my co-supervisor for the first part of the
thesis, Prof Sun Defeng for his valuable comments and his great help in providing me
abundant data that is used in this thesis.
Besides my supervisors, I would also like to thank my fellow students with whom
I often discuss various questions about my research and their unreservedly share of
knowledge that has inspired me.
Last but not least, I would like to thank my family and my friends for their endless
support throughout my life.
Contents
I Correlations driven by market volatility/market return 7
Introduction 8
1 Nonparametric Estimation 17
1.1 Kernel estimator . . . . . . . . . . . . . . . . . . . . . . . . . . . . . . 17
1.2 Local weighted least square estimator . . . . . . . . . . . . . . . . . . 19
2 Model Description 25
2.1 Estimation of volatility . . . . . . . . . . . . . . . . . . . . . . . . . . 25
2.1.1 Parametric models . . . . . . . . . . . . . . . . . . . . . . . . 25
2.1.2 Non-Parametric models . . . . . . . . . . . . . . . . . . . . . 26
2.2 Estimation of correlation coefficient . . . . . . . . . . . . . . . . . . . 27
2.3 Asymptotic distribution . . . . . . . . . . . . . . . . . . . . . . . . . . 28
3 Empirical Evidence 31
3.1 Cross correlation between stocks . . . . . . . . . . . . . . . . . . . . . 31
3.1.1 Correlation behavior vs market volatility . . . . . . . . . . . . 31
3.1.2 Correlation behavior vs market return . . . . . . . . . . . . . . 33
3.2 Cross correlation between international markets . . . . . . . . . . . . . 37
3.2.1 Correlation behavior vs market volatility . . . . . . . . . . . . 38
3.2.2 Correlation behavior vs market return . . . . . . . . . . . . . . 41
4 Conclusion 45
4
50
II Lead-lag relationship in equity market 51
Introduction 52
5 Methodology 60
5.1 Model Setup . . . . . . . . . . . . . . . . . . . . . . . . . . . . . . . . 60
5.2 Detecting lead-lag relationships . . . . . . . . . . . . . . . . . . . . . 64
5.3 implementation . . . . . . . . . . . . . . . . . . . . . . . . . . . . . . 65
6 Monte Carlo Simulation 67
6.1 Simulation design . . . . . . . . . . . . . . . . . . . . . . . . . . . . . 67
6.2 Comparison with QMLE . . . . . . . . . . . . . . . . . . . . . . . . . 68
6.2.1 Review on QMLE . . . . . . . . . . . . . . . . . . . . . . . . 68
6.2.2 Comparison of performance . . . . . . . . . . . . . . . . . . . 70
6.3 Tuning parameters . . . . . . . . . . . . . . . . . . . . . . . . . . . . 71
7 Empirical Study 76
7.1 Data description . . . . . . . . . . . . . . . . . . . . . . . . . . . . . . 76
7.2 Empirical findings on individual stocks . . . . . . . . . . . . . . . . . . 78
7.3 Empirical findings on stock indices . . . . . . . . . . . . . . . . . . . . 87
8 Conclusion 90
Figure List 97
A Proofs of Theorem 4 in the first part 102
B Smoothing Spline 111
Part I
Correlations driven by market
volatility/market return
7
Introduction
Correlation coefficient between financial assets is an important input to portfolio selec-
tion as well as a fundamental parameter in financial risk assessment. Ever since the
beginning of the financial crisis in 2007, whether correlations between stocks and inter-
national equity markets increase during market downturns has been widely discussed
by both practitioners and academics. Some researchers have shown that cross corre-
lations between international equity markets do increase when global market becomes
highly volatile [Longin and Solnik (1995), Bernhart et al.(2011)]. Analogously, various
authors found that cross correlations only increase in strong bear market but not in bull
market [Longin and Solnik (2001), Ang and Chen (2002), Amira and Taamouti (2009)].
More detailed review will be given later. This phenomenon contradicts the basic idea of
risk diversification. This project aims to investigate the behavior of cross correlations
driven by market volatility or market return using a nonparametric approach.
To better understand the role of correlation in asset allocation, we can look at the mean-
variance portfolio selection framework developed by Markowitz in 1995. The portfolio
is defined by a weighted sum of all assets with w, the portfolio weight vector. Through
maximization of the objective function which is the expected return minus the portfolio
8
risk, the optimal weights are obtained. The objective function is written as:
max
w
w
T
µ − λRisk(w)
s.t. w ≥ 0
w
T
1 = 1
where λ is the parameter of the investor’s risk aversion and µ is the expected re-
turn. The Risk function can be defined by the portfolio variance which is var(w
T
x) =
∑
i
w
2
i
var(x
i
) +
∑
i, j
w
i
w
j
cov(x
i
x
j
). Therefore, the estimation of covariance terms is cru-
cial to determining the risk of portfolio. Suppose each individual asset has variance
σ
2
and zero cross correlation, a equally weighted portfolio will have variance equal to
σ
2
/N. This variance is much smaller than that of individual stocks. The concept of
risk diversification originates from here. However, the recent research shows that cross
correlations increase during market downturns or volatile market periods which implies
that the effect of risk diversification will be weakened during difficult times.
Kaplanis (1988) is one of the first to study correlations in financial markets. In his study,
the hypothesis of constant correlation between 10 major stock markets is not rejected.
The idea of constant correlation was also supported by some other researchers at that
time like Sheedy (1997), Tang (1995) and Ratner (1992). If the hypothesis were true,
the financial crisis in 1987 should have been prevented. King and Wadhwani (1990)
and Bertero and Mayer (1990) pointed out that cross correlations between international
markets increased during the crisis. In addition, the constant correlation was also con-
cluded as a temporary effect by King et al. (1994). Finally, in 1995 Longin and Solnik
used multivariate GARCH model to show that cross correlations between international
markets tend to increase especially during highly volatile periods.
Nowadays, time-varying correlations are widely accepted. Current research on behav-
9
ior of cross correlations during difficult time is mainly based on parametric models.
Ang and Bekaert (2002) and Bernhart et al.(2011) both used Markov-switching model
(MSM) to study the change of cross correlations in different market environments. The
advantage of (MSM) is that it groups explicitly the price data into two sets, each with
its own values of parameters. Thus, they found that the cross correlations associated
with highly volatile regime are significantly larger than those estimated during calm
periods. Moreover, Bernhart et al.(2011) also showed that within the mean-variance
framework, by considering two market regimes, better portfolio performance can be
achieved. Other studies using MSM can be found in Ramchand and Susmel (1998),
Ang and Bekaert (2002) and Chesnay and Jondeau (2001).
Unlike the conclusions of studies based on MSM, other researchers found that it is the
market return that influences the cross correlations. Erb et al. (1994) showed that the
cross correlations are higher during recessions. Longin and Solnik (2001) used extreme
value theorem and developed a new measurement named exceedance correlation, to
demonstrate that cross correlations are higher when market plunges while no significant
change in correlations is proven when market surges. Based on the same framework,
Ang and Chen (2002) tested if the impact of market return is asymmetric and they found
similar results as Longin and Solnik. Amira et al. (2009) used VAR model to investigate
the driving force of cross correlations of international markets, too. They found that the
effect of market volatility on cross correlations can be absorbed once market trend is
introduced as a regression variable as well. Therefore, they concluded that it is rather
market trend instead of market volatility that drives the correlations.
Another related topic is the contagion effect in international markets. Contagion is de-
fined (Forbes and Rigobon (2002)) as a significant increase in cross-market linkages
after a shock to one country (or a group of countries). In this study, no significant
contagion but only interdependence was showed. Interdependence means that the cor-
relations do not increase significantly but there are always strong linkages between the
10
markets. Nevertheless, Chiang et al.(2007) reconfirmed the contagion effect by study-
ing some Asian markets.
Since Engle (2002) proposed the dynamic conditional correlation (DCC) model which
belongs to the multivariate GARCH family, a lot of research has been done based on
it. Syllignakis and Kouretas (2011) used DCC to show that there is contagion effect
in markets of Central Eastern Europe countries. Similarly, Kenourgios et al. (2011)
confirmed the contagion effect in emerging markets. Despite the finding of increasing
correlation during market shocks, Gupta and Donleavy (2009) found that there are still
some potential benefits for Australian investors to diversify into international emerging
markets. Similar studies can be found in Colacito et al. (2011) and Lahrech and Syl-
wester (2011).
Instead of using correlations, Copula is also used to measure the dependence structure.
It is shown by Mashal and Zeevi (2002), Hu (2006), Chollete et al. (2006) and Ning
(2010) that market return has an asymmetric effect on the dependence structure of in-
ternational equity markets, i.e. equity markets tend to move together during recession
while no significant co-movement found in bull market.
The research papers presented here raise some interesting questions to which this thesis
also looks for the answers: Does market volatility have an impact on cross correlations?
Does market return drive the trend of cross correlations? Are the impacts based on pos-
itive and negative market returns different? Are there any applications of considering
the change of correlations based on different market environments in portfolio manage-
ment ?
In this first part of the thesis, a new nonparametric method is used to address the above
questions. The method imposes fewer assumptions on the model but requires larger
sample size. Fortunately, large amounts of data are rather accessible in financial market.
11
In addition, the asymptotic point-wise confidence interval of the correlation is derived
in chapter 2. This asymptotic confidence interval tells how confident the estimation is
with respect to the true value. The analysis of real data is performed using daily returns
of Dow Jones 30 stocks and German DAX 30 stocks. Correlations between interna-
tional equity markets are also studied which include the main equity indices in US, UK,
Germany and Japan.
When dealing with sample correlations, it should be taken into account that the returns
of a given stock or a market should be standardized before being used for estimation of
correlation. Taking the ”Dow Jones Industry Average Index” as an example, after cal-
culating the logarithmic value of the daily price index (i.e, r
i,t
= log(p
i,t
)−log(p
i,t−1
)),
the log return r
i,t
is treated as r
i,t
= µ
i
+ σ
i,t
ε
i,t
where ε
t
is a random variable with zero
mean and unit variance and σ
2
t
denotes the variance at time t. The sample correlation
estimator then can be expressed as:
ˆ
ρ
i, j
=
n
∑
t=1
ε
i,t
ε
j,t
.
However, since ε
it
is not directly observed from the price, the standardized log return
should be used instead of ε
it
, i.e. ˜r
i,t
= (r
i,t
−µ
i
)/σ
i,t
. Direct use of log returns without
standardization in the sample correlation estimator will result in data points with large
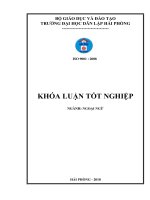
absolute values overwhelming the others. Figure 1 shows the log returns of Dow Jones
Industry Average and Figure 2 shows that after standardization. In order to standardize
the log returns, σ
t
, the time-varying volatility must be estimated. In this first part of the
thesis, a new method based on local weighted least square estimator (LWLS) is used to
estimate σ
t
and the local GARCH model is also used as a benchmark. Same as the Ker-
nel method, LWLS provides a continuous estimate of the response variable according to
the independent variable while winning over the traditional Kernel method by reducing
the asymptotic estimation bias.
12
Figure 1: Log returns of Dow Jones Industry Average
Figure 2: Standardized Log returns of Dow Jones Industry Average by GARCH model
Another important issue is pointed out by Longin and Solnik (2001) and Ang and Chen
(20002): some of the previous research that claim to show increase in cross corre-
lations based on large absolute value of market return are biased. We will explain
this in detail. Given two gaussian random variables X
1
,X
2
of constant correlation, the
estimated sample correlation conditioned on large absolute values of X
1
,X
2
, i.e. for
| X
1
|> p,|X
2
|> p, p > 0 will become larger as the threshold value p gets bigger. Nev-
ertheless, the sample correlation becomes smaller when conditioned on only large pos-
itive (or negative) values. For example, for a standard bivariate normal random sample
with constant correlation of 0.5 which contains 10000 observations, we could estimate
the empirical correlation as follows:
ρ =
∑
(x
1
(i) − ¯x
1
(i))(x
2
(i) − ¯x
2
(i))
∑
(x
1
(i) − ¯x
1
(i))
2
∑
(x
2
(i) − ¯x
2
(i))
2
(1)
We divide the observations into two sets with equal number of observations: one for
smaller absolute values, i.e. |X
i
|< 0.674 for i ∈{1,2} and the other for bigger absolute
value, i.e. | X
i
|> 0.674 for i ∈ {1,2} . The estimated correlation for the first set is
13
0.21 while it is 0.62 for the other. This effect is present whenever having a symmetric
distribution as the conditional mean is not shifted from zero. Therefore, the estimated
correlation is amplified for larger absolute values. However, if we condition only on
positive (negative) values that exceed 0.8 (-0.8), i.e. X
i
> 0.8 for i ∈{1,2} or X
i
< −0.8
for i ∈ {1,2}, the estimated correlation is 0.19 < 0.5. It is showed by Ang and Chen
(2002) that the correlation conditioned on extremely positive (negative) values con-
verges to 0 when threshold goes to infinity (negative infinity).
This problem does not apply directly to our analysis as the estimated correlations are
conditioned on an external factor: the performance of market index. However, to some
extend, the market volatility or the market return is influenced by individual stocks’ per-
formances. For correlations estimated based on market volatility, it is possible that the
highly volatile market periods are accompanied by large absolute values of individual
stocks’ returns. However, in our analysis, even if this bias is not considered, it is already
shown that no significant increase in cross correlations is present based on high market
volatility. Thus, this possible estimation bias introduced here only makes it worse.
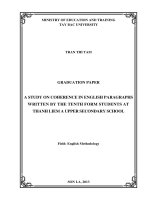
Figure 3: 150 pairwise correlation coefficient plot from DJ 30 stocks vs DJ market return.
According to the previous discussion, if constant correlation is the case, the conditional
14
correlation based on highly positive or highly negative values should have an inverse
U shape, i.e. lower sample correlation is obtained when conditioned on unidirectional
large values. In later analysis, although the conditional cross correlations between in-
dividual stocks are not conditioned on the values of the stocks themselves but on the
values of the global market index, we may still suspect a similar effect as the market
index is a weighted average of the prices of individual stocks. It is worth mentioning
that in the proposed estimator of conditional correlation, the conditional mean value
of stock return is removed from the original stock return. Thus the natural effect that
individual stocks’ prices tend to increase when market surges is eliminated before the
correlation is estimated because the mean value of individual stocks’ prices during bull
market is already removed from the raw log returns. Figure 3 shows 150 pairwise local
correlations in Dow Jones market conditioned on market returns. It can been observed
from the figure that in contradiction to the theoretical expectation of an inverse ”U”
shape, the conditional correlations show a normal ”U” shape. This suggests that there
is an increase in correlation when market return goes to extreme. This effect is not sig-
nificant on each pairwise correlation but it is confirmed by the confidence interval when
we aggregate all pairwise correlations together. The aggregated correlation based on
Dow Jones 30 stocks is given in figure 4. Moreover, in our multiple markets analysis,
we have already adjusted the bias in using US market return as both the independent
and one of the dependent variables. For cross correlations estimated among the other
three countries, this question is not a concern as the independent variable (US market
return) is not directly affected by the market returns of the other three counties.
15
Figure 4: Correlation coefficient.
Briefly, in the first part of the thesis, it is shown that:
• Market volatility seems to have little impact on cross correlations between indi-
vidual stocks or international markets. Although the estimated cross correlations
are in general higher when market is highly volatile, the point-wise confidence
interval is too large to conclude a significant difference.
• When conditional mean values are removed from the original returns of the prices,
the pairwise cross correlations of individual stocks in both US market and Ger-
man market show a ”U” shape but its significance is not confirmed by the con-
fidence interval. However, when the aggregated correlation of all pairwise cross
correlations is estimated, the ”U” shape is shown to be significant which contra-
dicts the constant correlation assumption.
• The effect of market return on cross correlations is further proven asymmetric.
The increase in cross correlation is higher when market plunges and it is smaller
when market surges.
The report is organized as follows: Chapter 1 provides the theoretical background of
the proposed estimator and Chapter 2 describes the model in details. Data description
and empirical results are presented in Chapter 3 and 4. Due to the limit of the space,
some supplementary figures are presented in the Appendices.
16
Chapter 1
Nonparametric Estimation
in this section, theoretical background of Kernel estimator and LWLS estimator will
be discussed. They both belong to the nonparametric family. They help to investi-
gate the association between the response variable and the independent variable and to
characterize the impact of independent variable on actual observations. Nonparametric
regression is the family of regression methods which are data analytic, in the sense that
it does not assume certain form of the response function as in parametric regression. In
this first part of the thesis, the local weighted least square regression (WLS) is the main
estimator used. The organization of this chapter is arranged as follows: In section 2.1,
Kernel estimator is first introduced as it can be viewed as the local weighted constant
fitting which follows the same idea as WLS while being simpler. It is followed by sec-
tion 2.2 which discusses WLS, and finally section 2.3 is focused on the selection of the
optimal bandwidth.
1.1 Kernel estimator
First of all, to consider the smoothing problem in the simplest statistical framework, it is
assumed that we have n identically and independent distributed realizations (X
1
,Y
1
), (X
n
,Y
n
).
Let (X,Y) be a generic member of the sample, whose conditional mean and conditional
variance are denoted respectively by m(x) = E(Y |X = x), σ
2
(x) = var(Y | X = x).
17
Kernel estimator is introduced here as it follows the same idea as local weighted least
square estimator while having a simpler form. Without assuming a specific form of
the regression function, a data point which is remote from x normally carries little
information about m(x). Rather than taking the local running average, a kernel function
K
h
is used to assign a weight to each data point depending on how apart the point is from
x. Usually, a kernel function is taken from a symmetric probability density function and
h is a parameter called the bandwidth. A commonly used kernel function is the gaussian
kernel, i.e. K
h
(t) = 1/hK(t/h) = (
√
2π)
−1
exp(−t
2
/2h
2
). Hence the expectation of the
dependent variable Y conditional on x with a Nadaraya-Watson’s weightis is given by [
Nadaraya (1964) and Watson (1964)]:
ˆm
h
(x) =
∑
n
i=1
K
h
(X
i
−x)Y
i
∑
n
i=1
K
h
(X
i
−x)
The consistency of the kernel estimator with Nadaraya-Watson’s weight is shown by
the proposition 1.
Proposition 1. Assume that the predictor variable X is of one dimensional and is drawn
randomly from a certain distribution and
(A1)
| K(u) | du < ∞,
(A2) lim
|u|
uK(u) = 0,
(A3) EY
2
< ∞,
(A4) n → ∞, h
n
→ 0, nh
n
→ ∞.
Thus at every point x of continuity of m(x), f (x) and σ
2
(x) with f (x) > 0,
ˆm
h
(x)
P
−→ m(x)
It is also of our interest to derive the asymptotic distribution of the kernel smoother as
it is important to construction of the confidence interval. Since kernel estimators are
essentially weighted averages, it is natural to expect that they would be asymptotically
18
normal under certain assumptions. It will be shown later that this is the same for LWLS
estimator.
Theorem 1 (Hardle(1990)). Suppose that
| K(u) |
2+η
du < ∞ for some η > 0, h ∼
n
−1/5
, m and f are twice differentiable and E{| Y |
2+η
| X = x} ≤ ∞ for some η > 0
then ˆm
h
(x
j
) converges in distribution at the k different locations x
1
,x
2
, x
k
to a normal
random vector with mean vector B and identity covariance matrix:
(nh)
1/2
{
ˆm
h
(x
j
) −m
h
(x
j
) −B
(σ
2
(x
j
)c
K
/ f (x
j
))
(1/2)
}
L
−→N(0,I)
where c
K
=
K
2
(u)du and d
K
= (1/2)
u
2
K(u)du with bias B and variance V. B =
d
K
h
2
{m
(x
j
) + 2m
(x
j
)( f
(x
j
)/ f (x
j
))} and V = σ
2
(x
j
)c
K
/( f (x
j
)nh).
1.2 Local weighted least square estimator
From a functional approximation point of view, Kernel estimator actually can be viewed
as local constant approximations. It is equivalent to
ˆm
h
(x) = argmin
m
n
∑
i=1
(Y
i
−m)
2
K
h
(X
i
−x) =
∑
n
i=1
K
h
(X
i
−x)Y
i
∑
n
i=1
K
h
(X
i
−x)
.
A natural idea to improve the estimator is to use a local polynomial approximation of
m(x) β
0
+ + β
p
(X
i
−x)
p
where β is obtained from minimizing the weighted least
square function:
n
∑
i=1
(Y
i
−
p
∑
j=0
β
j
(X
i
−x)
j
)K
h
(X
i
−x). (1.1)
Of course, we have to assume that m has (p + 1)th continuous derivatives around x.
Local weighted least square model is obtained when p = 1. The local polynomial esti-
mator for i.i.d cases has been systematically studied by Stone (1977), Cleveland (1979)
and Tsybakov (1986). Like Kernel estimator, it has nice asymptotic convergence and
asymptotic normality under some regularity conditions. However, data in financial mar-
19
ket does not satisfy the i.i.d assumptions in general. The asymptotic distribution of de-
pendent data is studied by Masry and Fan (1997) and the main results are presented here.
Before the proofs, a few definitions are given. Firstly, If a random variable X is indexed
to time, usually denoted by t, the observations X
t
are called a time series, where t is a
time index.
Definition 1. (Autocovariance function)
The autocovariance function of a time series X
t
with Var{(X
t
)}< ∞, ∀t ∈Z (where Z is
the integer set) is defined by γ
X
(s,t) = Cov(X
s
,X
t
) = E{(X
s
−EX
s
)(X
t
−EX
t
)}
Definition 2. (Stationarity or weak stationarity)
The time series X
t
with t ∈Z is said to be stationary if E{(X
t
)
2
}< ∞ ∀t ∈ Z, E{(X
t
)}=
µ ∀t ∈ Z and γ
X
(s,t) = γ
X
(s + h,t + h) ∀s,t,h ∈ Z.
Let F
k
i
be the σ algebra of events generated by the random variables {X
j
,Y
j
,i ≤ j ≤
k} and L
2
(F
k
i
) be the collection of all second-order random variables which are F
k
i
measurable.
Definition 3. (Strongly mixing)
The stationary time series X
t
with t ∈Z is said to be strongly mixing if
sup
A∈F
0
−∞
,B∈F
∞
k
| P(AB) −P(A)P(B) |= α(k) → 0 as k → ∞.
Definition 4. (ρ mixing)
The stationary time series X
t
with t ∈Z is said to be ρ mixing if
sup
A∈L
2
F
0
−∞
,B∈L
2
F
∞
k
| cov(A,B) |
var
1/2
(A)var
1/2
(B)
= ρ(k) → 0 as k → ∞.
We also have that ρ mixing process implies strong mixing process by α(s
n
) ≤ρ(s
n
)/4.
Now we are ready to look at the problem. The solution of the problem 1.1 is
ˆ
β(x) =
20
(X
T
W X)
−1
X
T
Wy with W = diag(K
h
(X
i
−x))
X =
1 (X
1
−x) (X
1
−x)
p
.
.
.
.
.
.
.
.
.
.
.
.
1 (X
n
−x) (X
n
−x)
p
,Y =
Y 1
.
.
.
Y
n
The (X
T
W X) matrix is positive definite as long as there are at least p+1 local effective
design points. We rewrite that:
s
n, j
=
1
n
n
∑
i=1
(
X
i
−x
h
)
j
K
h
(X
i
−x) , t
n, j
=
1
n
n
∑
i=1
(
X
i
−x
h
)
j
K
h
(X
i
−x)Y
i
and
S
n
=
s
n,0
s
n,p
.
.
.
.
.
.
.
.
.
s
n,p
s
n,2p
,t
n
=
t
n,0
.
.
.
t
n,p
The solution to 1.1 can be expressed as [Fan and Gijbels (1995)]
ˆ
β(x) = diag(1,h
−1
, ,h
−p
)S
−1
n
t
n
.
To simplify the notations, let’s write:
µ
j
=
∞
−∞
u
j
K(u)du , v
j
=
∞
−∞
u
j
K
2
(u)du.
Thus we define:
S =
µ
0
µ
p
.
.
.
.
.
.
.
.
.
µ
p
µ
2p
,
˜
S =
v
0
v
p
.
.
.
.
.
.
.
.
.
v
p
v
2p
, µ =
µ
p+1
.
.
.
µ2p + 1
Thus in the i.i.d case, it can be shown by conditioning on (X
1
, X
n
)
ˆ
β
∗
(x) = E{
ˆ
β(x)|X
1
, ,X
n
}=
(X
T
W X)
−1
X
T
W (m(X
1
),m(X
2
), ,m(X
n
))
T
. Since the regression is done locally within
21
an interval of width h, by Taylor’s expansion, we have
m = (m(X
1
),m(X
2
), ,m(X
n
))
T
= Xβ(x) +
m
p+1
(x)
(p + 1!)
diag((X
1
−x)
p+1
, (X
n
−x)
p+1
)
T
+o
p
h
p+1
where β(x) = (m(x), ,m(x)
p
)
T
. Thus, by substituting this into the above equation,
using the fact that s
n, j
→
P
f (x)µ
j
, we obtain that
ˆ
β
∗
(x) = β (x) +
m
(
p + 1)(x)
(p + 1!)
diag(h
p+1
, h)S
−1
µ + o
p
(1).
Therefore, it can be easily seen that
ˆ
β is an asymptotically unbiased estimator of β. This
could not be done so easily for dependent data, so we will first look at the asymptotic
bias and variance of
ˆ
β for mixing process.
Condition 1. (a) The kernel function K is a bounded density function on a compact
set.
(b) f (u,v; l) ≤ M < ∞,∀l ≥1, where f (u,v; l) denotes the density of (X
0
,X
l
).
(c) Processes X
j
,Y
j
are either ρ mixing with
∑
ρ(l) < ∞ or strongly mixing with
∑
l
a
[α(l)]
1−2/δ
< ∞ for some δ > 2 and a > 1 −2/δ. In the latter case, we
assume further u
2δ p+2
K(u) → 0 as | u |→ ∞.
Theorem 2. Under condition 1 and the assumption that h
n
→0, nh
n
→∞ as n →∞, we
have at every continuity point of f : Es
n, j
→ f (x)µ
j
, nh
n
var(s
n, j
) → f (x)v
2 j
for each
0 ≤ j ≤2p and S
n
→ f (x)S which means that each element converges in mean square
sense.
To study the joint asymptotic normality of
ˆ
β(x), we need to center the vector t
n
by
replacing Y
i
with Y
i
−m(X −i) in the expression of t
n, j
. Thus
t
∗
n, j
=
1
n
n
∑
i=1
(
X
n
−x
h
)
j
K
h
(X
i
−x)(Y
i
−m(X
i
)).
22
Once again, we could expand m(x) by Taylor expansion and using the fact that s
n, j
→
P
f (x)µ
j
from theorem 1, we get
S
−1
n
t
∗
n
= S
−1
n
t
n
−diag(1, h
p
n
)β(x) −
h
p+1
n
m
p+1
(x)
(p + 1)!
S
−1
µ + o
p
(h
p+1
n
)
= diag(1, h
p
n
)[
ˆ
β(x) −β (x)] −
h
p+1
n
m
p+1
(x)
(p + 1)!
S
−1
µ + o
p
(h
p+1
n
)
from which we could derive the asymptotic bias of
ˆ
β(x). By modifying slightly the
conditions, we could have the asymptotic variance covariance matrix of t
∗
n
then for
ˆ
β.
Condition 2. (a) The kernel function K is a bounded density function on a compact
set.
(b) f (u,v; l) ≤ M
1
< ∞ and E{Y
2
1
+Y
2
l
| X
1
= u, X
l
= v} ≤ M
2
∀l ≥1.
(c) In addition to (c) of condition 1, we add EY
2
0
< ∞ and E{|Y
0
|
δ
|X = u}≤M
3
< ∞
for u in a neighborhood of x.
Theorem 3. We write Var(Y | X = x) = σ
2
. Under condition 2 and the assumption that
h
n
→ 0, nh
n
→ ∞ we have at every continuity point of f,σ
2
:
nh
n
cov(t
∗
n
) → f (x)σ
2
(x)S
where cov(t
∗
n
)denotes the covariance matrix of t
∗
n
.
Now we are ready to state the theorem of joint normality. As before, we need to add
some new assumptions.
Condition 3. (a) we assume that there exists a sequence of positive integers satisfy-
ing s
n
→ ∞ and s
n
= o((nh
n
)
1/2
) such that as n → ∞,
(n/h
n
)
1/2
ρ(s
n
) → 0 and (n/h
n
)
1/2
α(s
n
) → 0.
23
(b) the conditional distribution G(y | u) of Y given X = x is continuous at the point
u = x.
Theorem 4. Under condition 1-3, we have the following asymptotic normality as n →
∞:
(nh
n
)(diag(1, h
p
m
)[
ˆ
β(x)−β(x)]−
h
p+1
n
m
p+1
(x)
(p + 1)!
S
−1
µ) →
D
N(0,σ
2
S
−1
˜
SS
−1
/ f (x))
at continuity points of σ
2
, f .
The proofs of this section are given in the appendix.
24
Chapter 2
Model Description
As volatility and correlation are not directly observed from the price, estimation meth-
ods are employed for statistical inference. Section 2.1 presents the method of volatility
estimation using GARCH model and local WLS. Section 2.2 discusses the estimator
of correlation and finally in section 2.3, the asymptotic distribution of the correlation
estimator is derived.
2.1 Estimation of volatility
Since there is not yet a best model for estimation of volatility, three different models are
implemented to estimate the local volatility in order to test the robustness of the results.
The first two volatility indices are modeled either by parametric (GARCH) model or
nonparametric (LWLS) model. The last one is the S&P 500 VIX which is an official
volatility index given for S&P 500 and very often, it is regarded as the representative
volatility index of the US market.
2.1.1 Parametric models
GARCH model introduced by Bollerslev (1986), is one of the common models to esti-
mate volatility. It’s defined as:
r
i,t+1
= µ
i
+ σ
i,t+1
ε
i,t+1
25