Bài giảng topic 3 applications of d s
Bạn đang xem bản rút gọn của tài liệu. Xem và tải ngay bản đầy đủ của tài liệu tại đây (370.99 KB, 24 trang )
Applications of Demand
and Supply
Topic 3
So far…
Demand & Supply
Equilibrium determined
by market forces
Equilibrium maintained
by market forces
Price Controls
Some cases market forces are not allowed to
determine equilibrium price and quantity
Intervention by authorities (Govt.)
Price Ceilings
Price Floors
Taxes
on Producers
on Consumers
fig
P
Q
O
P
e
S
D
Maximum
pric e
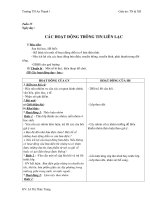
“A
price ceiling
is the maximum legal price a seller
may charge for a good or service” (Jackson page 160)
Price Ceilings
Govt. sets the price LOWER than the
equilibrium.
Why would they do this?
What is the result?
Who benefits? Who loses?
What is likely to happen?
Why would they do it?
To keep the price down to an acceptable level.
During wartime price controls may be imposed on
essential items such as petrol, rice etc.
To help the poor & the disadvantaged
fig
P
Q O
P
e
Q
d
Q
s
S
D
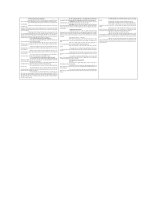
shortage
maximum
pr ice
What are the results?
What are likely to happen?
Effects:
dealing with resulting shortages
=> rationing
black markets
fig
P
Q
O
P
b
P
g
P
e
Q
s
Q
d
D
S
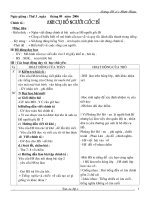
Effect of price control on black-
market prices
Price ceiling
Blackmarketeers’
profits
Gainers & Losers?
Gainers
Consumers who are
able to obtain supplies
at the price ceiling
Losers:
Consumers who cannot
obtain supplies
(even though they are
willing to purchase at
the equilibrium price )
Price Controls- Consumer
Surplus & Producer Surplus
Originally
CS = A+B
PS = C+E+F
After Price ceiling
CS = A+C
PS = F
What about B & E?
net loss in total
surplus
Price Floors
A
price floor
is the minimum price set by the gov’t for
a good or service
Govt. sets the price
floor HIGHER than
the equilibrium
Why would they do
this?
What is the result?
Who benefits? Who
loses?
What is likely to
happen?
Why does the government do it?
To support prices (income) in important sectors
of the economy (eg. Agriculture).
To protect workers (eg. minimum wages)
fig
P
Q O
P
e
minim um
price
Q
d
Q
s
S
D
surplus
What is the impact?
Gainers & Losers?
Gainers
Suppliers who receive
higher price per unit
and probably, higher
income.
Workers who are in job
receive a higher wage
Losers:
Consumers who have to
pay higher prices for
the goods.
Workers who were
previously working, are
now unemployed
Price Controls, CS & PS (contd.)
Originally
CS = A+B+C
PS = E+F
After Price floor
CS = A
PS = C+F
What about B & E?
net loss in total
surplus
Taxes on Producers
Supply curve shifts up
vertical shift = amount of
tax
Equilibrium price
increases, equilibrium
quantity decreases
Notice the difference in
amount of tax and
increase in price.
As elasticity of demand
and supply vary, the
burden changes
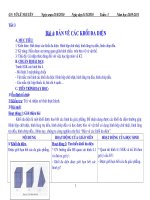
Taxes on Producers
Effects of imposing tax on producers:
S
o
S
1
Q
P
E
0
E
1
Q
0
Q
1
Consumers’ tax burden
Tax
D
Consumers’ tax burden >
Producers’ tax burden if
Demand is relatively
inelastic
Producers’ tax burden
Taxes on Producers
Taxes on Producers
Taxes on producers
Taxes on Producers
Taxes on Consumers
Demand curve shifts down
vertical shift = amount of
tax
Equilibrium price
decreases, equilibrium
quantity decreases
Notice the difference in
amount of tax and
decrease in price.
As elasticity of demand
and supply vary, the
burden changes
Elasticity and Tax burden
- Summary
Elastic Inelastic
Demand Producer Consumer
Supply Consumer Producer
So, the burden of tax is not affected by who it is levied on
(producer or consumer).
It is affected by the elasticities of demand & supply