Analysis of crash severity using hierarchical binomial logit model
Bạn đang xem bản rút gọn của tài liệu. Xem và tải ngay bản đầy đủ của tài liệu tại đây (270.14 KB, 69 trang )
ANALYSIS OF CRASH SEVERITY USING HIERARCHICAL
BINOMIAL LOGIT MODEL
VU VIET HUNG
(B.Sc. in CIVIL Eng., HCMUT)
A THESIS SUBMITTED
FOR THE DEGREE OF MASTER OF ENGINEERING
DEPARTMENT OF CIVIL ENGINEERING
NATIONAL UNIVERSITY OF SINGAPORE
2009
Acknowledgement
ACKNOWLEDGEMENTS
I would like to express my deep and sincere thanks and gratefulness to my supervisor,
Associate Professor Chin Hoong Chor for his invaluable advice, patient guidance,
exceptional support and encouragement throughout the course of this research work.
I gratefully acknowledge the National University of Singapore for giving me a chance
to study and do a research.
Special thanks are extended to Mdm. Theresa, Mdm. Chong Wei Leng and Mr. Foo for
their kind assistance during this study period.
My heartfelt thanks and appreciation goes to my colleagues and friends namely, Ms.
Tuyen, Mr. Ashim, Mr. Shimul, Ms. Sophia, Mr. Habibur, Ms. Duong, Mr. Thanh and
Ms. Qui for their nice company, help, and cooperation thereby making my stay in
Singapore, during my research period, a memorable experience.
Finally, the author wishes to dedicate this work to his parents and his sisters for the
many years of endless love and care.
Vu Viet Hung
National University of Singapore
August 2009
National University of Singapore
i
Summary
SUMMARY
Crash severity is a concern in traffic safety. To propose efficient safety strategies to
reduce accident severity, the relationship between injury severity and risk factors
should be insightfully established. The purpose of this study is to identify the effects of
factors of time, road features, and vehicle and driver characteristics on crash injury.
This study on the severity of accidents at signalized intersections is investigated
because the numbers of these crashes are the highest of total accidents and result in a
variety of injured drivers.
To establish the relationship between injury severity and the risk factors and to solve
multilevel data structures in the dataset, hierarchical binomial logit model is selected
for the study. The reported accident data in Singapore from year 2003 to 2007 are used
to calibrate the model. From twenty-two pre-selected variables, the significant factors
in both fixed and random part are identified by using 95% Bayesian Credible Interval
(BCI). In addition, Deviance Information Criterion (DIC) is also employed to find the
suitable model.
The result indicates that ten variables are identified as significant factors. Crashes at
night, with high speed limit or at intersection with presence of red light camera vitally
increase the severity while a variable, wet road surface, reduces the injury. Vehicle
movement also significantly affects the crash severity. This study also finds that
Honda manufacture is safer than other vehicle makes. With driver characteristics,
driver gender and age are also associated with crash severity, while involvement of
offending party positively affects crash severity.
National University of Singapore
iv
Table of contents
TABLE OF CONTENTS
ACKNOWLEDGEMENT ................................................................................................ i
TABLE OF CONTENTS................................................................................................. ii
SUMMARY.................................................................................................................... iv
LIST OF FIGURES ......................................................................................................... v
LIST OF TABLES.......................................................................................................... vi
LIST OF ILLUSTRATIONS......................................................................................... vii
LIST OF SYMBOLS .................................................................................................... viii
CHAPTER 1: INTRODUCTION
1.1
Research background ............................................................................... 1
1.2
Objective and scope of this study ............................................................ 3
1.3
Outline of the thesis ................................................................................. 4
CHAPTER 2: REVIEW OF ACCIDENT SEVERITY MODELS
2.1
Introduction.............................................................................................. 5
2.2
Review of statistical models .................................................................... 6
2.2.1
Binary logit and probit model .................................................................. 6
2.2.2
Multinomial logit model ........................................................................ 10
2.2.3
Ordered logit model ............................................................................... 12
2.3
Identified problem.................................................................................. 16
2.4
Summary ................................................................................................ 17
CHAPTER 3: DEVELOPMENT OF HIERARCHICAL BINOMIAL LOGIT
MODEL WITH RANDOM SLOPE EFFECTS FOR CRASH SEVERITY
3.1
Introduction............................................................................................ 19
3.2
Model specification................................................................................ 22
National University of Singapore
ii
Table of contents
3.2.1
Hierarchical binomial logit model ......................................................... 22
3.2.2
Estimation .............................................................................................. 24
3.3
3.3.1
Model evaluation ................................................................................... 25
Bayesian credible interval and deviance information criterion ............ 25
3.4
Pre-selection of variables in accident dataset ........................................ 30
3.5
Summary ................................................................................................ 34
CHAPTER 4: APPLICATION OF HIERARCHICAL BINOMIAL LOGIT MODEL
FOR ACCIDENT SEVERITY AT SIGNALIZED INTERSECTIONS
4.1
Introduction............................................................................................ 35
4.2
Accident data ......................................................................................... 35
4.3
Model calibration and validation ........................................................... 39
4.3.1
Model calibration ................................................................................... 39
4.3.2
Model validation .................................................................................... 42
4.4
Discussion of significant risk factors..................................................... 42
4.5
Summary ................................................................................................ 48
CHAPTER 5: CONTRIBUTIONS, DISCUSSIONS, RECOMMENDATIONS AND
CONCLUSIONS
5.1
Reseach contributions ............................................................................ 50
5.2
Discussions and Recommendations....................................................... 51
5.3
Conclusions............................................................................................ 53
REFERENCE............................................................................................................... 54
CURRICULUMVITAE............................................................................................... 52
National University of Singapore
iii
List Of Figures
LIST OF FIGURES
Figure 2.1: Mapping of latent variable to observed variable ........................................ 13
Figure 2.2: A hierarchy of severity at level 1, within accidents at level 2.................... 17
National University of Singapore
v
List Of Tables
LIST OF TABLES
Table 3.1: Risk factors related to crash severity at signalized intersections ................. 31
Table 4.1: Covariates used in the model ....................................................................... 38
Table 4.2: Estimate of Deviance Information Criterion (DIC) ..................................... 40
Table 4.3: Estimate of fixed part and random part ....................................................... 41
National University of Singapore
vi
List Of Illustrations
LIST OF ILLUSTRATIONS
AIC
Akaike Information Criterion
BCI
Bayesian Credible Interval
BIC
Bayesian Information Criterion
BL
Binary Logit Model
DIC
Deviance Information Criterion
GLMs
Generalized Linear Regression Models
GVE
Generalized Extreme Value
HBL
Hierarchical Binomial Logit Model
IIA
Independence of Irrelevant Alternatives
MCMC
Markov Chain Monto Caelo algorithm
O.R.
Odds Ratio
S.D.
Standard Deviation
National University of Singapore
vii
List of symbols
LIST OF SYMBOLS
A vector of coefficients; 0 is the intercept; i is the coefficient for xi
0 j
The intercept term of jth crash in individual level model of HBL
pj
The pth regression coefficients jth crash in individual level model of
HBL
00
The intercept term for regressing 0 j in the crash level model of HBL
p0
The intercept term for regressing pj in the crash level model of HBL
0q
The qth regression coefficients for regressing 0 j in the crash level
model of HBL
pq
The qth regression coefficients for regressing pj in the crash level
model of HBL
Random error term in the ordered logit/probit model
(.)
The cumulative distribution function for the standard normal
distribution
i
The probability of Yi=1 in Binomial distribution
M
The threshold or cut point for the ordered logit/probit model
02
The variance of random effects U0j
2p
The variance of random effects Upj
n
(.)
Summation of a given function from 1 to n observation
i
The index for observation individual
i 1
National University of Singapore
viii
List of symbols
Logit (i )
Logi 1 i
N
The total number of observation
p
Probability of success in Bernoulli trial
Probit ( i )
The inverse of the cumulative standard normal distribution ( i )
U0 j
Within-crash random effects of 0 j
U pj
Within-crash random effects of pj
Xi
A row vector of independent variables for the ith observation; the ith row
of x
X pij
The pth covariate for ith driver-vehicle unit in the jth crash in level 1
Yij
Binary severity variable for the ith driver-vehicle unit in the jth crash
y*
The latent dependent variable
Z qj
The qth covariate of the jth crash in level 2
National University of Singapore
ix
Chapter One: Introduction
CHAPTER 1: INTRODUCTION
1.1
RESEARCH BACKGROUND
Road systems both satisfy transportation demand and provide transportation supply
efficiently. Road safety is one of the most important concerns of transportation supply.
Therefore, reducing crash frequency and severity not only ameliorates safety but also
saves a lot of money as well as improves transportation. To propose efficient safety
strategies, several studies have been trying to fully identify how accident severity
varies. In Singapore, although crash severity decreases, based on some studies’
findings such as (Quddus et al. (2002) and Rifaat and Chin (2005), accident rate and
severity are still high in recent years. For instance, accident data show that the numbers
of drivers are 2661, 2923, 2255, 2516, and 2933 from year 2003 to 2007, respectively.
Thus, clearly understanding the relationship between the injury severity and risk
factors is necessary for developing safety countermeasures.
Statistical models have been developed for road safety and applied for predictions of
accident severity in specific situations. Firstly, several researchers have improved
crash severity prediction models in order to take into account the severity levels. For
example, some studies have applied some generalized linear models (GLMs) to
classify nominal categories. Binary probit or logit models have been employed when
the severity levels are classified as two levels: injury and non-injury. In addition,
multinomial probit and logit have been used in order to explore the important factors
affecting severity, categorized as multinomial states. On the other hand, one of the
most common models used for categorizing the severity levels is ordered probit or
National University of Singapore
1
Chapter One: Introduction
logit model. The advantage of this model is to take into account the ordered nature of
severity levels from the lowest severity to the highest severity such as no injury,
possible injury, evident injury, disabling injury, and fatal. Secondly, other studies have
examined and focused on specific effects, such as driver age and gender, vehicle type,
mass, and size, collision type and others, on degree of severity. For instance, (Islam
and Mannering (2006); Lonczak et al. (2007); Ulfarsson and Mannering (2004)
separated driver gender and driver age to evaluate how difference between male and
female affects severity and examine how different age groups influence fault and crash
injury. In addition, (Gray et al. (2008) and Yannis et al. (2005) concentrated on young
(or old) drivers to find countermeasures that reduce the severity of specific groups. On
the other hand, vehicle type, mass, and size have been studied by several researchers
(Chang and Mannering 1999; Evans and Frick 1992; Evans and Frick 1993; Fredette et
al. 2008; Islam and Mannering 2006; Khorashadi et al. 2005; Kim et al. 2007b;
Langley et al. 2000; Savolainen and Mannering 2007; Ulfarsson and Mannering 2004)
because they are directly associated with the increase of severity. Moreover, a series of
studies (Kim et al. 2007a; Kockelman and Kweon 2002; Pai ; Pai and Saleh 2008a; Pai
and Saleh 2008b; Preusser et al. 1995; Wang and Abdel-Aty 2008) have centered on
evaluating the relationship between severity and crash types. Last, but not least,
previous studies (Abdel-Aty 2003; Abdel-Aty and Keller 2005; Huang et al. 2008;
Kim et al. 2007a; Milton et al. 2008; Obeng 2007; Pai and Saleh 2008a) have also
investigated severity of accident at specific locations. All of the studies mentioned
above provided us with the knowledge to both understand various severities and
suggest efficient countermeasures so that accident severity is decreased.
National University of Singapore
2
Chapter One: Introduction
Selection of suitable statistical models is dependent on some assumptions made in
these models. It also depends on how accident data confirm these assumptions. For
example, generalized linear regression models (GLMs) that are used for predicting
severity assume that all samples in the dataset are independent of one another.
However, when this assumption is violated, the estimation of parameters and standard
errors is incorrect. As a result, conclusions that the factors are significant are not
correct. In fact, (Jones and Jørgensen (2003)
clearly explored the existence of
dependence between samples such as samples of vehicle. Casualties within the same
vehicle would have the same probability of survival. However, in reality, some
casualties are killed and others are survived even though all of them travel in the same
vehicle. Therefore, the assumption of independence may not hold true. The model
without overcoming this problem, especially when there is clearly an existence of
dependence between samples, would lead to inaccurate estimates of parameters and
standard errors. Although some previous researches (Huang et al. 2008; Jones and
Jørgensen 2003; Kim et al. 2007a) developed approaches to solve this problem which
is also called multilevel data, these models are not fully developed; thus, resulting in
the fact that some conclusions are incorrect. Therefore, this study continues to improve
the hierarchical models with the purpose of better and more clearly taking into account
the impacts of risk factors on crash severity at signalized intersection in Singapore.
1.2
OBJECTIVE AND SCOPE OF THIS STUDY
The main purpose of this study is to examine how accident severity is affected by risk
factors. The severity of road accidents at signalized intersections is chosen in this
analysis. This is because the numbers of collisions at signalized intersections are the
National University of Singapore
3
Chapter One: Introduction
highest (20% of total accidents) and the numbers of drivers and vehicles increase from
2003 to 2007, based on accident data provided by Traffic Police in Singapore.
In order to obtain this objective, the hierarchical logit model with random slope effects
has been developed for analyzing occupant severity. Moreover, accident data are used
to explore the relationship between the crash severity and several factors such as
general factors, road features, and vehicle and casualty characteristics. The model
calibration and validation are then estimated to prove the appropriateness of
hierarchical logit model compared with another model.
1.3
OUTLINE OF THE THESIS
The organization of this thesis contains five chapters and is presented as follows.
Chapter 1 provides the research background in which the limitations of statistical
models are identified. The objective and scope of this study are also mentioned in this
chapter. The outline demonstrates the organization of this thesis.
Chapter 2 presents the literature reviews of the severity models in recent year. The
problem of statistical models is also identified.
Chapter 3 describes the formulation and assessment of the hierarchical logit model.
Chapter 4 demonstrates the application of hierarchical logit model for crash severity at
intersections. The parameter estimation, model calibration and validation, and
explanation of significant covariates are also given in this chapter.
Finally, conclusions of analyzing severity are discussed in Chapter 5. Besides, research
contributions and recommendations are presented.
National University of Singapore
4
Chapter Two: Review of CSMs
CHAPTER 2: REVIEW OF CRASH SEVERITY MODELS
2.1
INTRODUCTION
Reducing accident severity is a target of traffic safety. Before proposing
countermeasures to improve road safety, experts and engineers have to establish the
relationships between risk factors and the crash severity or crash frequency. Therefore,
a number of researchers have been interested in developing and improving statistical
approaches in order to clearly and correctly explore how the response variables are
dependent on the explanatory variables, such as road features, traffic factors, and
vehicle and driver characteristics. In addition to using count models such as Poison and
Negative binomial models to predict accident frequency, generalized linear regression
models (GLMs) have been broadly employed for investigating crash severity. Since
the injury severity variable is discrete, sporadic and nominal, at least three types of
GLMs: binary logit/probit models, multinomial logit/probit model, and ordered
logit/probit models are suitable for taking into account the severity level. Previous
studies (such as Factor et al. 2008; Obeng 2007; Pai 2009 and Simoncic 2001)
successfully used binary logit/probit models to overcome the severity levels, which are
categorized as less and high injury, and find several risk factors that significantly
influence the severity. On the other hand, when data contain the severity variables
classified as more than two states and nominal categories, multinomial logit/probit
models are employed so that estimates of parameters, standard errors, and
significances are more accurate. Some researchers such as (De Lapparent (2006); Kim
et al. (2007b); Savolainen and Mannering (2007); Shankar and Mannering (1996);
Simoncic (2001); Ulfarsson and Mannering (2004) did some of these studies.
National University of Singapore
5
Chapter Two: Review of CSMs
Moreover, a lot of accident data commonly contain crash severity that is ranked from
the lowest severity to the highest severity. Consequently, several studies (Abdel-Aty
2003; Kockelman and Kweon 2002; Lee and Abdel-Aty 2005; O'Donnell and Connor
1996; Pai and Saleh 2008a; Pai and Saleh 2008b; Quddus et al. 2002; Rifaat and Chin
2005; Zajac and Ivan 2003) employed ordered logit and probit models to explain and
overcome the ordinary outcomes of the severity.
This chapter presents a literature review of GLMs. In addition, mathematical
formulations, general forms, assumptions, and limitations of GLMs such as binary,
multinomial, and ordered logit/probit models are provided in this chapter. Based on the
information, a potential problem is also identified.
2.2
2.2.1
REVIEW OF STATISTICAL MODELS
BINARY LOGIT AND PROBIT MODEL
In the studies of accident severity, logit and probit models are appropriate to
investigate the fact that crash severity is a binomial or multinomial outcome. Binary
logit and probit models are employed when the response variable has two states such
as injury or non-injury, hit-and-run or not-hit-and-run crash, or at-fault or not-at fault
case. In these models which are applied for predicting the injury, the crash severity is a
binomial distribution. So, the response variable Yi for the ith observation can take one
of two values: Yi= 0 or 1, where Yi=1 presents the first state such as injury and Yi=
presents the other state: non-injury. The probability of Yi is denoted by i Pr(Yi 1) .
The logit transformation of the probability i of a crash being injured is given by
National University of Singapore
6
Chapter Two: Review of CSMs
Logit ( i ) log i
1 i
(2.1)
Besides, the logit transformation is linked to the linear predictor, presented as follows
Logit ( i ) X i
(2.2)
Thus, the logit models are obtained and given by
Log i
1 i
X i
(2.3)
Based on Equation (2.3), the probability i of a crash being injured is solved by
i Pr(Yi 1)
exp(X i )
1 exp(X i )
(2.4)
where, Xi is a vector of explanatory such as road features, traffic factors, and vehicle
and driver characteristics which may have influences on crash severity. Besides, is
the coefficient regression vector of the independent variables, presenting how each
independent variable affects the increase or decrease of injury.
Binary probit models are similar to binary logit models. The difference between them
is the error distribution. In the binary logit models, the errors are assumed to have a
National University of Singapore
7
Chapter Two: Review of CSMs
standard logistic distribution with mean 0 and variance , while the errors in binary
3
probit models have an assumption that the error distribution has mean 0 and variance
1. Therefore, the establishment of the probit models is the same as that of the logit
model and described as follows.
The probit transformation of the probability i is given by inverse of standard
cumulative normal distribution function and written as
Pr obit ( i ) 1 ( i )
(2.5)
where (.) is the cumulative distribution function of standard normal distribution.
In addition, the probit transformation is linked to the linear predictor, described as
Pr obit ( i ) X i
(2.6)
Consequently, the probit models are obtained and given by
1 ( i ) X i
(2.7)
Based on Equation (2.7), the probability i of a crash being injured is solved by
i Pr(Yi 1) (X i )
(2.8)
where the explanations of , Xi and (.) are mentioned above.
National University of Singapore
8
Chapter Two: Review of CSMs
Both binary logit and probit model have been broadly used in traffic safety. For
instance, (Simoncic (2001), who applied binary logit model to overcome injury
severity of collisions between a pedestrian, bicycle or motorcycle and a car, found that
some variables, including no use of protective devices, older age, intoxication of
pedestrians, cyclists, motorcyclists or car divers, and accidents at night, on motorway
or at weekend significantly influence the increase of participants’ injury. Moreover,
Haque et al. (2009) identified time factors, road features (such as wet surface, lane
position, and speed limit) and driver-vehicle characteristics (such as driver age and
license, and vehicle capacity and registration) that contribute to the fault of
motorcyclist in crashes at specific locations by applying binary logit model.
Furthermore, (Tay et al. (2008) employed a logit model to analyze hit-and-run
accidents on which the roadway, environmental, vehicle, crash, and driver
characteristics have influences.
Although binary logit and probit models have little difference on the error distribution,
binary logit models are always chosen in previous studies. This is because the
probability density function (pdf) and cumulative distribution function (cdf) of logit
models are simpler than those of probit models. Especially, it is easy for the logit
model to interpret log-odds ratio which probit models cannot estimate. Due to the
advantages of logit models, the following sections focus on demonstrating multinomial
logit and ordered logit models.
National University of Singapore
9
Chapter Two: Review of CSMs
2.2.2
MULTINOMIAL LOGIT MODEL
Multinomial logit models can be thought of as an extension of the binary logit models.
For the multinomial response variable, multinomial logit models are most frequently
chosen in order to analyze the crash severity because accident datasets contain multiple
severity levels and binary logit models are unable to solve more than two levels of
severity. Another reason is that multinomial logit models’ mathematical structure and
estimation are simple and easy respectively. (MacFadden (1973) demonstrated the
multinomial logit models as the most widely-used discrete choice model. This discrete
choice model is based in the principle that an individual chooses the outcome that
maximizes the utility gained from that choice. Based on this principle and assumption
that the error term is generalized extreme value (GVE) distributed, (MacFadden (1981)
derived the simple multinomial logit model. The final formulation of the models is
written as
i ( y i j)
exp( j X i )
exp( X )
j
(2.9)
i
J
where i ( y i j) is the probability of individual i having alternative j in a set of
possible choice categories J. Xi is a vector of measurable characteristics that determine
alternative j. j is a vector of statistically estimable coefficients.
However, the multinomial logit model has the limitation of independence of irrelevant
alternatives (IIA) (Ben-Akiva and Lerman 1985), such that the odd of m versus n
(m, n 1..J ) is not affected by other alternatives, i.e.
National University of Singapore
10
Chapter Two: Review of CSMs
i ( y i m)
exp(X i [ m n ])
i ( y i n )
(2.10)
This expression is only a function of the respective utilities of alternatives m and n,
and is not affected by the introduction/removal of other alternatives. This analytical
feature implies that the relative shares of the two given alternatives are independent of
the composition of the alternative set.
The limitation of independence of irrelevant alternatives in multinomial logit model
was also identified by (Chang and Mannering (1999); Lee and Mannering (2002);
Shankar et al. (1996) in their studies on accident severity. (Shankar et al. (1996)
classified severity of an accident to be one of five discrete categories: property
damage, possible injury, evident injury, disabling injury and fatality. However,
according to them, property damage and possible injury accidents may share
unobserved effects such as internal injury or effects associated with lower-severity
accidents. However, the basic assumption in the derivation of the multinomial logit
model is that error terms or disturbances are independent from one accident severity
category to another. (Shankar et al. (1996) suggested that if some severity categories
share unobserved effects (i.e. have correlated disturbances), the model derivation
assumptions are violated and serious specification errors will result.
On the other hand, according to (Long (1997), a significant advantage of multinomial
probit models is that the errors can be correlated across choices, which eliminates the
IIA restriction. However, computational difficulties make multinomial probit models
impractical.
National University of Singapore
11
Chapter Two: Review of CSMs
2.2.3
ORDERED LOGIT MODEL
According to (Long (1997), when the response variable is ordinal in nature and models
for nominal variables are used, there will be loss of efficiency due to information being
ignored. Therefore, multinomial logit model cannot handle ordinal dependent
variables. One way to deal with this problem is to use ordered logit models instead of
multinomial logit ones. Ordered logit models are usually motivated in a latent (i.e.,
unobserved) variables framework. The general form of the model is given by
y *i x i i
(2.11)
where, y *i is a latent, unobservable and continuous dependent variable; x i is a row
vector of observed non-random explanatory variables; is a vector of unknown
parameter; i is the random error term which is assumed to be logistically distributed.
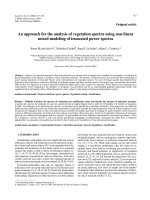
According to (Long (1997), ordered logit models can be derived from a measurement
model in which a latent variable y *i ranging from to is mapped to an observed
ordinal variable y. The discrete response variable y is thought of as providing
incomplete information about an underlying y *i according to the measurement
equation:
1 if 0 y *i 1 (the lowest injury)
...
y i m if m-1 y *i m
...
M if M-1 y *i M (the highest injury)
National University of Singapore
(2.12)
12
Chapter Two: Review of CSMs
where, the threshold values ' s are unknown parameters to be estimated. The extreme
categories, 1 and M, are defined by open-ended intervals with 0 and M .
The mapping from the latent variable to the observed categories is illustrated in Figure
2.1 below:
y*
1
1
2
2
3
3
τm
M
y
Figure 2.1 Mapping of latent variable to observed variable
Since the distribution of i is specified as standard logit distribution with mean 0 and
variance , the probabilities of observing a value of y given x i can be computed. The
3
final formulation of the probabilities of observing value of y=m given x i is described
as follows
Pr( y i m x i ) F( m x i ) F( m 1 x i )
(2.13)
where, F(.) is the cumulative distribution function of standard logistical distribution;
x i , , and m are mentioned above.
Since accident data usually contain severity levels that are ordered from the lowest to
the highest severity such as slight injury, serious injury, and fatality, the ordered logit
National University of Singapore
13
Chapter Two: Review of CSMs
and probit models are most commonly applied. These models are also proved to be
appropriate for analyzing road accidents by several previous studies. For example,
(O'Donnell and Connor (1996) used two models of multiple choice; the ordered logit
and probit models, to examine how variations of road-user attributes result in
variations in the probability of motor vehicle accident severity. In this study, several
factors that significantly affected injury include driver’s characteristics such as the age,
seating position, and blood alcohol level, vehicle features such as vehicle type and
make, and others such as type of collision. This study also indicated that the results
from the ordered probit and ordered logit models are similar. Moreover, (Quddus et al.
(2002) indentified that time factor such as driving at weekends and time of day, road
factors including location, traffic type, surveillance camera, road surface, and lane of
nature, driver’s factors consisting of nationality, at-fault drivers, gender, and age
group, vehicle’s features such as engine capacity and headlight not turned on during
daytime, and the collision types contribute to both various motorcycle injury and
vehicle damage severity by using the ordered probit models. Furthermore, (Kockelman
and Kweon (2002) employed the ordered probit models for all crash types, two-vehicle
crashes, and single-vehicle crashes to estimate the probability of crash severity. The
results analyzed from an application for all crash types showed the significances of
gender, violator and alcohol, vehicle type as well as crash type on the severity level.
On the other hand, some variables, including the same factor in all crash type case and
other factors such as age, are found to importantly affect injury severity in two-vehicle
crashes and single-vehicle crashes. Besides, driver severity levels at multiple locations,
such as roadway sections, signalized intersections, and toll plazas, are solved by
(Abdel-Aty (2003), using the ordered probit models. The findings indicated that
driver’s age, gender, seat belt use, and vehicle speed and type are significant on all of
National University of Singapore
14
Chapter Two: Review of CSMs
the locations. This study also found other variables that have effects on injury in
specific cases. For example, while a driver’s violation influences injury severity at
signalized intersections, alcohol, lighting conditions, and horizontal curves contribute
to the likelihood of injury at roadway sections, and vehicle equipped with Electronic
Toll Collection has an effect on the probability of injury. In addition to studies
mentioned above, the ordered logit and probit models have been applied by several
other researchers (Abdel-Aty and Keller 2005; Gray et al. 2008; Lee and Abdel-Aty
2005; Pai and Saleh 2008b; Rifaat and Chin 2005; Zajac and Ivan 2003) to deal with
the injury severity of overall and specific crashes at signalized intersections, young
male drivers, vehicle-pedestrian crashes at intersections, various motorcycle crash
types at T junctions, single-vehicle crashes, and motor vehicle-pedestrian collisions,
respectively. Based on several above-mentioned applications of the ordered
approaches, it is worth mentioning that these approaches contributed good
explanations about ordinal discrete measure of severity levels to appropriately
modeling and solve the crash severity.
However, ordered logit and probit models still have some limitations. (Eluru et al.
(2008) gave a good example to explain a problem of the ordered model. In this paper,
the crash severity was categorized as the ordinal response variable including no injury,
possible injury, non- incapacitating injury, incapacitating injury, and fatal injury. The
ordered models were applied to compute the threshold values which were fixed across
five crash groups. However, this did not correctly describe the fact that the effects of
some independent variables may have no difference between two crash groups. This
can lead to inconsistent estimates of the effects of variables. Besides, other studies
such as (Jones and Jørgensen (2003) found that accident data are multilevel. This
National University of Singapore
15