The impact of exporting modern services on economic development
Bạn đang xem bản rút gọn của tài liệu. Xem và tải ngay bản đầy đủ của tài liệu tại đây (1.17 MB, 33 trang )
The Impact of Exporting Modern Services on
Economic Development:
A Potential Growth Strategy for Low Income Countries
Bachelor Thesis
Erasmus Universiteit Rotterdam
August 2015
Author: Marijke van Neck
Student number: 377923
Supervisor: Jan-Jelle Witte
Abstract
Technology has made it possible to export many services in a similar manner to goods. The focus in
this thesis is on modern services, therefore traditional service exports like travel and tourist services,
are not included. Examples of modern services that can be exported are financial, IT and
communication services. The export of these modern services has grown drastically in the past 25
years. Developing countries are also supplying these services internationally, a well-known example
being India’s IT sector. In this thesis a panel study using data from the World Data Bank on 214
countries is performed. The fixed effects model is used to see if and how the value of modern service
exports influences GDP per capita growth, controlling for other determinants of economic growth.
The results show that there is a significant positive effect of modern services exports on GDP per capita
growth.
1
Table of content
1. Introduction ............................................................................................................................. 3
2. Literature review ...................................................................................................................... 6
2.1. Concepts............................................................................................................................ 6
2.2. Services sector and GDP...................................................................................................... 7
2.3. Productivity growth ............................................................................................................ 8
2.4. Modern services and tradability of services.......................................................................... 9
2.5. Export as an engine of growth........................................................................................... 10
2.6. Comparative advantages in services .................................................................................. 10
2.7. Entry into services ............................................................................................................ 11
2.8. Sophistication of service exports ....................................................................................... 12
2.9. Hypothesis....................................................................................................................... 12
2.10. Economic growth determinants....................................................................................... 13
3. Data ....................................................................................................................................... 14
3.1. Data sources .................................................................................................................... 14
3.2. Variables of interest ......................................................................................................... 14
3.3. Control variables and interaction variables ........................................................................ 14
3.4. Descriptive data ............................................................................................................... 15
4. Empirics ................................................................................................................................. 17
5. Results ................................................................................................................................... 19
5.1. Panel model results .......................................................................................................... 19
5.2. Lagged variables............................................................................................................... 21
5.3. Low and middle income countries ..................................................................................... 22
6. Conclusion and discussion ....................................................................................................... 24
7. References ............................................................................................................................. 26
8. Appendices............................................................................................................................. 30
Appendix A............................................................................................................................. 30
Appendix B ............................................................................................................................. 31
Appendix C ............................................................................................................................. 32
2
1. Introduction
Since the 1980s, trade of services has grown faster than trade in goods. The trade in services is a
relatively new phenomenon, where a service can be supplied to a consumer, without the need for
physical proximity to the producer. Globalization of services has also made it possible for developing
countries to supply services on an international level, which could potentially work as a source of
growth (Ghani, 2009). This thesis focuses on the export of service as an economic growth strategy for
developing countries, as alternative to the traditional economic growth strategy of industrialising and
exporting manufactured goods. Creating a large exporting service sector could be a viable growth
strategy towards employment opportunities and economic prosperity.
In developed countries the large majority of the workforce is employed in the service sector. Services
generate over 70 percent of the GDP (gross domestic product) in OECD countries (Hoekman & Mattoo,
2008). This is in contrast to countries in the early stages of economic development, where a great
share of the workforce is employed in the agriculture sector. The agriculture sector loses its share
when industrial production starts to expand (Henderson, 2002; Soubbotina, 2014). Many developing
countries have experienced economic development by exporting manufactured goods and products.
Traditionally, when the manufacturing sector is matured, deindustrialisation takes place and a shift
towards the service sector is visible (Noland, Park & Estrada, 2012; Park & Chen, 1989). Statistics show
that more developed economies have a higher share of services in GDP and that there is a positive
correlation between share of the service sector and per capita income (Bear & Samuelson, 1981).
Contrary to the mature manufacturing sector, services are likely to be labour intensive. The growth of
the service sector can lead to many jobs and therefore inclusive growth. A productive service sector
can have positive effects on manufacturing. An entire economy can benefit from advances in ICT and
effective transportation. According to Noland et al. (2012) middle income countries could benefit from
business services and a strong modern service sector, moving up the value chain and therefore
escaping the much-feared middle income trap (Noland, Park & Estrada, 2012).
As mentioned, there is increasingly cross-border trade in services where there is no longer a need for
actual proximity. This is the result of many advances in the information and communication
technology. Telecom networks and Satellite make it possible to electronically transport services
internationally (Hoekman & Mattoo, 2008; Ghani, Goswami & Kharas, 2011). Services that can be
exported are mostly modern services, like financial, legal, communication, computer, technical,
advertising and business services. Historically, services were supplied primarily for domestic
consumption, however services now contribute to a large share of global trade (Bradford Jensen,
Kletzer, Bernstein & Feenstra, 2005). According to Ghani (2009) personal services, which require face
to face interaction, have turned into impersonal services that can be delivered electronically over long
distances, without or with little degradation in quality. Technology has influenced the proximity,
location and time requirements, making them redundant. More and more types of businesses are
being digitized and globalized. However, Storper & Venables (2003) mention quite the opposite,
stating that face-to-face contact is still very important, even though transport costs have drastically
declined. Technology might make long distance communication possible, but often face to face
interaction is still needed for the successful transmission of a message.
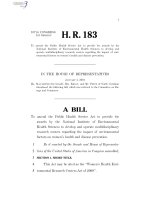
Figure 1 shows the increasing value of service exports in the world and of lower and middle income
countries.
3
Billions
Figure 1. Service exports
$6.000,00
$5.000,00
$4.000,00
$3.000,00
$2.000,00
$1.000,00
$2005
2006
2007
2008
2009
2010
Low & middle income countries
2011
2012
2013
World
The value of the world’s service exports has grown enormously between 2005 and 2013. There is a
little dip visible around the time of the economic crisis in 2008-2009, but apart from that there has
been a steady increase in service exports. Lower and middle income countries also show increasing
service exports, more than doubling their value between 2005 and 2013.
Because of the new tradability of services across borders, developing countries can also produce them,
even though a strong domestic demand is lacking. Prime examples of developing countries who are
exporting services are India, Pakistan, Sri Lanka and Nepal, who provide services in the software
industry and via callcenters (“The service elevator,” 2011; Noland Park & Estrada, 2012). The success
of some countries in trading services seems to be unrelated to their industrial development or to their
performance in exporting in goods (Goswami, Mattoo, & Sáez, 2012). In 2010, the size of the
international services market has been estimated at 252 Billion US$ (UNCTAD, 2013). Developing
countries have high growth rates in business service exports, leading to their share taking up 22
percent of global trade. Moreover, large amount of foreign direct investment have gone to the service
sector, shifting away from the manufacturing sector (Hoekman & Mattoo, 2008; Banga, 2005; Mishra,
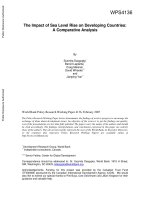
Lundstrom & Anand, 2011). In figure 2 the modern services as percentage of service exports is
presented. 1
1
In section 3 the types of service exports included in calculations can be found.
4
Figure 2. Modern services (% of service exports)
Percentage of service exports
60
50
40
30
20
10
0
2005
2006
2007
2008
2009
2010
Low & middle income countries
2011
2012
2013
world
Not only service exports have clearly grown, the percentage of modern services in service exports has
also slightly grown in the period 2005-2013. This is also visible for low and middle income countries
where the modern services make up almost 50 percent of the total service export in 2013.
The growth of service exports and modern service exports is an interesting development. Research by
Mishra, Lundstrom and Anand (2011) shows that there is a positive relationship between GDP growth
per capita and service export sophistication. The relative comparative advantage and share in total
service exports are used to compile sophistication. In this thesis the aim is to research whether a
simpler model, only looking at the export of modern services, will have a positive influence on the
GDP growth per capita as well. The research question will therefore be:
“What is the impact of exporting modern services on economic growth for developing economies?”.
The effect of education, computer access and English proficiency on the exporting of services will also
be looked into. The structure of this thesis is as follows: first the current literature concerning the
service sector and export will be discussed in section 2, next the data and empirics, showing the data
and the fixed panel data model used for this research in section 3 and 4. Then the results will be
discussed in section 5, and a conclusion will follow in section 6.
5
2. Literature review
Even though the service sector makes up the greatest share of the economy there is not a large
amount of research done on the service sector. A great number of research about services and
development has been done on the South Asia region, especially on India. This is not surprising since
India’s service sector grew rapidly and India exports a lot of services, most notably in the IT sector.
Before reviewing the literature, concepts regarding the service sector will be explained to gain some
insight into the sector. The link between GDP and the service sector will be discussed, as well as
describing the influence of services on productivity growth. Then the tradability and effects of export
will be reviewed. Lastly, the hypothesis will be drawn and several determinants of growth that could
be added as control variables will be described.
2.1. Concepts
According to Hoekman and Mattoo (2008) services have unique features that affect their tradability.
The typical characteristics include:
(i)
(ii)
(iii)
(iv)
intangibility – this makes it hard to observe and tax international transactions in services;
non-storability – services cannot be stored, hence consumption and production often
must occur at the same time and place;
differentiation – services are often different for every customer; and
joint production, which means that clients have to participate in the production process.
Services can be divided into two categories, modern services (or modern impersonal services) and
traditional personal services. Traditional personal services often require face to face contact like trade,
hotel, restaurant, education, beauty shops, barbers, health services, public administration and
defence. They require the physical proximity of the customer. The share of traditional services in GDP
tends to fall in more advanced economies. Modern services have benefitted from technological
advancement and can now be stored and traded digitally through satellite and telecom networks.
Modern services are ICT intensive and are no longer restricted by time and space. Examples are
communication, call centres, insurance, banking, business-related services, remote access services,
transcribing medical records, and computer services. Their share in GDP has risen with per capita
income (Mishra, Lundstrom & Anand, 2011; Ghani, 2009; Ghani, Goswami & Kharas, 2011; Banga,
2005; Eichengreen & Gupta, 2011).
The General Agreement on Trade in Services (GATS) defines four modes of supply for trade in services:
Mode 1 Cross-border: trade of services across borders. Similar to trade in goods, supplied from
one country into another country, without physical interaction.
Mode 2 Consumption abroad: a supply of services where the consumer travels to the country
of the provider, like tourism.
Mode 3 Commercial presence: a provider supplying services in another country by establishes
a facility in that country, like FDI.
Mode 4 Presence of natural persons: the temporary movement of a person into another
country to supply the service.
(Noland, Park & Estrada, 2012; McGuire, 2002; Hoekman & Mattoo, 2008; WTO, 1994)
In this thesis the focus will be on the export of modern services, and exports conducted via mode 1.
6
2.2. Services sector and GDP
In developed economies the share of the service sector is large. Many papers find that the share of
the service sector rises as GDP grows. Bear & Samuelson (1981) did a cross-section revealing a positive
correlation between per capita income and the service sector share of product. Noland et al. (2012)
find the same correlation, as well as a positive correlation for employment in services and per capita
income. Using panel data for Asian developing economies they demonstrate that the growth of
services is correlated with the rise in income and achieving education over ti me. Moreover they find
that service growth is significantly correlated with poverty reduction. Gordon and Gupta (2004) also
find that countries with higher per capita income have a larger share of services in GDP. They show
that factors such as increased use of services by other sectors and high income elasticity of demand
have played an important role in the growth of the service sector. This means that as income rises the
demand for services grows faster than the demand for other goods and commodities. Business
processes that were previously done internally by individual firms now are being outsourced. This
leads to an increase in the demand for services from the industrial sector. Accounting, legal, and
security services are examples of provided services that were previously done by firms themselves.
Economic reforms and the growth in foreign demand for services have also played a part in enlarging
services growth. Business and telecommunication services are very popular domestic and foreign
investment destinations, after being liberalized. In India the modern services attract most of the FDI
inflows. Ghani (2009) used a plot to show the relationship between GDP growth and the service and
manufacturing sector value-added growth for 134 countries. Both sectors are positively associated
with GDP growth. But the relationship between GDP growth and service output growth is steeper in
comparison to the relationship between GDP growth and manufacturing output growth. In a cross country growth regression the paper shows that the service sector has a stronger association with
overall growth than the manufacturing sector, controlling for initial real GDP per capita. Both
coefficients are statistically significant. This means that both the service sector and the manufacture
sector are associated with growth, but the service sector has a higher coefficient. In developing
countries services contributed more to growth than in developed countries . For a sample of 50
developing countries the paper finds that growth in the service sector is more correlated with poverty
reduction than growth in agriculture and manufacturing. Both manufacturing and the service sector
are negatively related to growth in poverty. The slope for the service sector is steeper. With change
in poverty as the dependent, growth in the service sector is significant (Ghani, 2009; Ghani Goswami
& Kharas, 2012).
Although it is clear there is a strong correlation between economic development and the share of the
service sector, there is no strong proof for causality, indicating that enlarging the service sector would
lead to GDP growth. Eichengreen and Gupta (2009) shed some light on the nature of the association.
They have analysed the share of service in GDP in the course of economic development. In their
research they use the percentage of services in GDP as dependent. They found evidence for the two
waves of service growth. The first wave appears to be made up primarily of traditional services, and
already occurs at relatively low levels of income per capita. Park and Chen (1989) find that the service
sector employment even tends to grow faster than the manufacturing sector in the early stages of
economics development. Mainly as a result of rapid migration from rural to urban areas. When income
starts to grow relatively more industrial goods and services are demanded, as opposed to necessities
such as food and shelter (Bear & Samuelson, 1981). The second wave includes the modern services.
They find that after 1990 the second wave, of modern services, starts at lower levels of income than
7
before. This means that the share of service sectors shows a growth in earlier economic development
phases. The first wave of service sector growth starts more or less as it did in the pre-1990 period. The
second wave is most evident in democracies, in countries that are close to major financial centres, and
in economies that are relatively open to trade.
2.3. Productivity growth
Just like in some high-growth industries in the manufacturing sector, there is a strong productivity
growth visible in several modern service industries. Information and communication technology,
trade, competition, and increasing returns to scale lead to the high productivity growth rates (Baily
and Gordon, 1988; Ghani, 2009; Triplett and Bosworth, 2004). Ghani (2009) uses a cross-country
regression with the growth of national labour productivity as the dependent variable. As controlling
variables he uses initial GDP per capita, average annual growth rate in agriculture, manufacturing, and
service output. He finds that the coefficient from agricultural output growth is negative and significant.
Service and manufacturing output both have a statistically significant and positive effect on the
national labour productivity. Ghani suggests that service is a bigger contributor to labour productivity
growth than manufacturing, since the coefficient on service output growth is more than double that
of manufacturing. He further implies that the service sector in South Asia has behaved like the
manufacturing sector in East Asia. GDP growth in South Asia has benefited from the expanding service
sector, caused by the high productivity rates.
Park and Shin (2013) take a different approach than Ghani (2009) using labour productivity growth in
the service sector as the dependent variable. They use trade in services as an explanatory variable. In
a panel study the coefficient of trade in services as a percentage of GDP is positive and statistically
significant. Growth of labour productivity in the service sector benefits from trade in services.
Domestic firms are being exposed to foreign competition from imported services. This forces firms to
become more efficient. Likewise, when a firm wants to export services it need to be able to compete
in foreign markets (Park & Shin, 2013; Freckleton, 2013). 2 The export in services improves the
productivity, which could lead to a higher GDP.
Eichengreen & Gupta (2011) also show that productivity in the service sector has grown. The highest
productivity growth has been in the modern services, although there has also been productivity
growth in tradition services like wholesale and retail, where internet often can be used (selling via
webshops for example). The traditional personal services such as restaurants, hotels, beauty shops,
barbers, education and health benefit not as much from technological changes and ICT (Ghani, 2009;
Eichengreen & Gupta, 2011). It is explained that the mix of skilled and unskilled workers in services is
increasingly similar to that of the manufacturing sector. This means that the modern services are not
only a suitable place for highly skilled workers, but also for lower skilled workers. Lower skilled workers
are not deemed to work in the manufacturing sector (Eichengreen & Gupta, 2011).
Gordon and Gupta (2004) also find that in the fast growing service sectors in India, like
communications, banking services, business services and community services there are significant
productivity gains, which leads to lower relative prices.
2
For empirics and results see “Developing the Service Sector As an Engine of Growth for Asia” by the Asian
Development Bank, p. 70-72.
8
2.4. Modern services and tradability of services
Hoekman & Matoo (2008) note that in developing countries the share of busin ess and producer
services have been growing at the expense of travel and transport services 3 . International trade in
services has grown tremendously because of technological changes. Between 1995 and 2005
developing countries have expanded their business services exports nearly four-fold. The most
notable service exporting developing country is India, which is not only supplying simply service tasks
like data entry, but is also successful in providing more advance services in fields such as product
development customer care, and human resource management. Exporting knowledge intensive
services (the type of products developed countries export) may sustain higher growth rates than
exporting lower-skill goods according to Ghani (2009). A cross-country regressions shows that
economic growth is about one percentage point higher in countries that have an open
telecommunications and financial sector. (Arnold, Mattoo & Narciso, 2006). Liberalisation can help
the service sector. As found by Banga (2005) growth in services in India has improved after gradually
opening up. Reducing barriers to trade and allowing foreign direct investment have increased the
demand in services. FDI brings capital and technology and can help increase exports and economic
growth (Seyoum, 2007). Bosker & Garretsen (2009) find that in South Asia the majority of the tradable
services are not produced for the local market. For example the domestic demand for software in
South Asia is low, but software exports increased to US$ 23 billion in 2006. The foreign demand can
help small developing countries. International exchange of services could be an opportunity for export
diversification. By exporting a wide range of services, countries become less vulnerable, and can
experience economic growth (Freckleton, 2013). McGuire (2002) shows that economies with more
restrictions tend to have a lower GDP per capita. He estimated that the real income gains for
developing economies by liberalizing services are US$ 130 billion. Those economies with the greatest
restrictions will have the greatest benefits.
In another paper by Eichengreen & Gupta (2011) they estimate growth in value added of different
services in India, for the period 1980-2007. 4 Some of the independent variables to explain the growth
are the tradability of the service, whether the sector has been liberalized, its skilled-labour intensity,
and per capita income. The increase of the value added in services grows with income per capita.
Moreover the results show that tradability has a positive effect on growth, growing four percentage
point faster than non-tradable services. As described previously by Banga (2005) and Arnold, Mattoo
& Narciso (2006) the paper also finds that liberalization has a significant positive effect on the growth
of services. Eichengreen & Gupta (2011) state that exporting financial, IT, business and communication
services could possibly lead to economic growth.
Saez and Goswami (2010) show that it is not just India that is exporting services. Professional and
information technology related services are exported by countries like Uruguay, Costa Rica and Brazil,
while Mexico trades in communication and distribution services. The paper finds that export of
business services tends to be highest in countries where the population has more schooling. Human
capital is very important for service exports.
3
This is also visible in figure 2, modern services include business and producer services, for the full list of
included services see section 3, data.
4 The different services include trade, hotels and restaurant, transport and storage, communication, banking
and insurance, business services, public administration and defence, and education and health.
9
According to Ghani, Goswami and Kharas (2011) modern services are emerging rapidly because of
growing tradability, reduced transport costs, and more sophisticated technology, which includes offshoring, scale economies and specialisation. Not only the value of export of services has grown (as can
be seen in figure 1) but also its share in total value added. This share is higher for developing
economies. Services do not have to deal with logistical barriers like customs, decreasing the transport
costs and making it a genuine opportunity for poor countries. Because of technology the location of
countries is less important. There is no need for proximity to more developed countries or to be close
to the sea. Manufacturing on the other hand depends on hard infrastructure for delivering goods, like
ports, roads, ships and airports. Export of services relies on telephone lines and IT (Ghani, 2009). Timezone differences between developing and develop countries make 24 hours a day business possible
(Goswami, Gupta & Mattoo, 2012).
2.5. Export as an engine of growth
In the previous subsection some of the advantages of trade and export already have been mentioned.
Many developing countries have had economic development by exporting manufactured goods and
products. Numerous studies have found a positive correlation between exports and GNP growth.
Export orientated policies have resulted in enhanced productivity and an optimal allocation of
resources (Lal & Rajapatirana, 1987).
Almost US$ 2.5 trillion worth of manufactures was exported by developing countries in 2005. East
Asia is a prime example of export-led growth by producing manufactures (UNIDO, 2009). Hong Kong,
Korea, Taiwan and Singapore are open to trade and are outward-oriented. They all have reached high
economic growth rates. The export-led growth hypothesis says export expansion is one of the main
determinants of growth. Export expansion can lead to many advantages. For example by exporting
the capacity is better utilized, exports make economies of scale possible and can lead to technological
progress. Moreover they increase the labour productivity and create employment (Medina-Smith,
2001). Marin (1992) found, using a Granger causality test, that in the United States, United Kingdom,
Japan and Germany exports cause productivity, confirming the export-led growth theory.
However Henriques and Sadorsky (1996) find that the opposite is true for Canada, where no evidence
is found for the export-led growth theory. In their Granger causal test they find that GDP growth
proceeds exports. Moreover research in China indicates that export-led growth theory doesn’t apply
everywhere. Time series data shows that there is a bidirectional causality between real industrial
output and exports. Shan and Sun (2010) mention that output and export have a positive influence
on each other, rather than a one-way effect.
As mentioned in subsection 2.3 there is also productivity growth in the service sector which can be
linked to trade. It is possible that exporting services could behave in the same way as manufacturing
output and potentially lead to productivity, output and GDP growth. The export-led growth theory is
somewhat ambiguous, and it is not clear if services behave in the same manner as goods and products.
2.6. Comparative advantages in services
McGuire (2002) states trade between countries and specialization are very important for the modern
economy. Gains from trade can be explained by the comparative advantage theory. According to this
theory a country should produce and export the services in which it has a relativ e advantage, and
import those in which it has a relative disadvantage. Thus the services are supplied by the relatively
10
lowest cost producer, and the optimal quantity of services will be consumed. As mentioned in
subsection 2.4 opportunities for developing countries arise from liberalization. They can gain market
access and export the services in which they have a relative strength or comparative advantage.
Hence, they can improve their export earnings and generate employment, as well as increasing their
efficiency. As explained by Park & Shin (2013) in section 2.3 being exposed to foreign competition
forces domestic firms to be more efficient.
People temporary working abroad in foreign services markets can develop a new range of skills and
knowledge. Upon return they can share this new information and skills in the domestic economy. This
way human capital can be improved (McGuire, 2002). In South Asia for example over 22 million people
(1.5 percent) live outside their home country (Ghani, 2009). With these acquired skills developing
countries can improve the quality of their services. India has a comparative advantage in many services
because of their cheap and skilled labour (also, a large share of the population is fluent in English).
Many developing countries are characterized by their low cost labour. If they can offer similar quality
as developed countries services can substantially lead to new employment. The tradability of services
has led to firms looking for countries where these services can be produced at much lower costs. Firms
strive to reduce fixed overhead by outsourcing routine functions ((Bosker & Garretsen, 2009; Gordon
& Gupta, 2004; McGuire, 2002; Seyoum, 2007).
A number of developing countries have a comparative advantage in modern service s. Not only India,
but also countries like Israel, Costa Rica and Sri Lanka have a high relative comparative advantage
(RCA) index in computer and information services. Indonesia, Venezuela and Colombia have an
advantage in communications services, while Mexico, Peru and Bolivia have high RCA in insurance
services. Colonial history, common language, and legal systems are important contributors to these
advantages, and increase service exports (Goswami, Gupta, Mattoo & Sáez, 2012; UNCTAD, 2013). For
example, India’s large service sector is partly due to their colonial history. India is a former colony of
Great-Britain, explaining their proficiency in English.
2.7. Entry into services
UNCTAD (2013) states four reasons why exporting services is a good possibility for developing
countries to implement.
1. Services don’t require countries to have natural resources, like petroleum reserves or
commodities.
2. The geographic location is not important. The costs of transporting services across borders
are very low. Distance does not play a big role in offshore service decisions. However time
zones could influence the suitability of the developing country.
3. Governments can create a comparative advantage. In services human capital plays a big role.
Education can influence the countries abilities. English and information technology skills can
be very important.
4. Services don’t depend on economies of scale like goods. Labour productivity, skills and
innovation affect the price of services more than quantity. Governments could help to create
the conditions that are necessary to enter global trade in services.
There is a positive association between human capital and service exports, as well as between service
exports and electronic infrastructure. Governments could create special economic regimes, such as IT
11
parks of software technology parks. Hence the number of computers per capita doesn’t need to be
high to be able to compete in transferable services (Goswami, Mattoo, & Sáez, 2012).
2.8. Sophistication of service exports
Mishra, Lundstrom and Anand (2011) performed a panel study indicating a positive association
between higher sophistication of service exports and growth in per capita income. Sophistication aims
to capture the productivity level associated with a country’s production. It measures the increasing
improvements in technology and ICT as well as countries exporting the high value services. For this
research Mishra et al. (2011) develop a new service exports sophistication index. They use the
revealed comparative advantage in specific services, and values of services exported by a country. This
is used to predict the dependent variable, GDP growth per capita. In their GDP growth model four
other determinants of economic growth are added; initial income level, rates of physical and human
capital accumulation, trade openness and institutional quality. The service sophistication coefficient
is positive and significant, which implies that higher GDP per capita growth is associated with higher
export sophistication.
2.9. Hypothesis
Trading and exporting services can have a positive influence on economic growth. Being open to
service trade can help productivity growth and lead to extra foreign demand. Mishra et al. (2011)
showed service exports sophistication is positively associated with economic growth. A simpler model,
only looking at the value of modern service exports will be conducted. To answer the research
question hypotheses 1 is conducted.
Hypotheses 1: The export of Modern services is positively associated with GDP per capita growth,
controlling for other determinants of growth.
Human capital is not only important for economic growth, but also to be able to produce modern
services. Goswami, Mattoo & Saez (2012) found a positive correlation, taking tertiary school
enrolment as a variable for human capital. It can be presumed that in order to complete service
exporting tasks you’ll need at least some basic education Eichengreen & Gupta (2011) on the other
hand found that the modern service sector is also a suitable place for low-skilled workers.
Hypotheses 2: Human capital is essential for modern service to lead to economic growth.
In order to trade services internationally electronic infrastructure is essential. IT related services are a
large share of modern services export. According to UCTAD (2013) information technology skills are
crucial. It could be expected that higher usage of the Internet would mean the population is more
skilled in IT which is an advantage when producing services. As mentioned in subsection 2.7. Goswami,
Mattoo, and Sáez (2012) stated that a high internet rate itself it not necessary as long as there are
enough opportunities to access the internet, in science parks for example.
Hypotheses 3: Internet access is important to successfully export modern services.
As mentioned by UNCTAD (2013) common language gives service exporting countries an advantage.
One of the factors contribution to India’s success in the service sector is the ability to speak English.
Proficiency in English is necessary for certain service tasks. This leads to the following hypotheses:
12
Hypotheses 4: English proficiency is needed to successfully export modern services.
The main aim is to investigate if exporting modern services can be a growth strategy for developing
countries. That why the first hypotheses will also be tested exclusively on lower and middle income
countries.
Hypotheses 5: Using a dataset only including lower and middle income countries does not change the
results.
The location of a country affects its ability to successfully export certain services. Eichengreen and
Gupta (2009) find that countries close to major financial centre have a more evident modern service
sector. Ghani (2009) and UNCTAD (2013) on the other hand states that in exporting services location
is not an important factor. Landlocked countries can also operate efficiently in services. Time-zones
play a role in international business. For some types of business it is crucial to be in the same timezone in order to collaborate, but for others types differences in time -zones are used to achieve 24
hours a day long services. If a country has a favourable location depends on the service. Including the
location of a country therefore goes beyond the scope of this thesis.
2.10. Economic growth determinants
In order to test the hypothesis using a GDP growth model some control variables are needed. Several
variables can contribute to economic growth. The initial development level contributes to t he
economic growth rate. The convergence theory describes that poorer countries grow faster than rich
countries, closing the gap between the two economies. (Dewan & Hussein, 2001; Durlauf, Kourtellos,
& Tan, 2005).
One of growth determinants is the share of investments in GDP (Durlauf, Kourtellos, & Tan, 2005).
Investments have a positive effect on efficiency and productivity. Investments provide a constant
capital/labour ratio, and cover physical depreciation. The rate of accumulation of physical capital is a
major factor in determining GDP per capita (Bassanini & Scarpetta, 2001). Another determinant is
human capital. Human capital comprises a highly trained and skilled workforce. A higher skilled
workforce enables countries to perform better in research and development and technical
improvements (Bassanini & Scarpetta, 2001). Durlauf et al (2005) also find that human capital, defined
as secondary school education and life expectance may be robust. Mishra et al (2011) also included
human capital as a variable in their research.
Inflation also often added as control variable. Lower and more stable inflation rates can reduce the
level of uncertainty (Bassanini & Scarpetta, 2001). If the inflation is uncertain, long-term contracts are
discouraged and the relative price variability is increased (Dewan & Hussein, 2001). Prices and inflation
can affect the GDP growth strongly, without there being actual economic growth.
13
3. Data
3.1. Data sources
To research the economic impact from service export for developing countries data from the World
Bank used. The World Development Indicators database gives 214 countries. 135 of them are lower
and middle income countries, meaning in 2013 their GNI per capita was $12,745 or less. Data
indicating if a country has English as an official language is retrieved from a list composed by
Wikipedia. The data covers 10 periods, from 2005 to 2014, since before 2005 there is no data available
for the service variables at the World Bank Database
3.2. Variables of interest
The variables communications, computer and other services (as percentage of service exports) and
insurance and financial services (as percentage of service exports) are included in the database. The
communications, computer and other services together with the insurance and financial services will
be taken as a variable for modern services. Services in the World Bank database are defined as the
economic output of intangible commodities that may be produced, transferred, and consumed at the
same time. The communications, computer and other services include: Telecommunications,
computer data, news-related service transactions between residents and non-residents, construction
services, royalties and license fees, miscellaneous business, professional and technical services,
manufacturing services on physical inputs owned by others, personal, cultural and recreational
services. The insurance and financial services variable includes insurance, financial intermediary and
auxiliary services between residents and non-residents. The modern services variable leaves out the
transport and travel share of the service exports, which can be viewed as the more traditional kind of
services. In the model modern services export is expressed as percentage of GDP. This modern services
variable primarily uses mode 1 of the GATS defines models for trade in services.
Economic growth is defined by GDP growth per capita. This is measured in constant 2005 US$ (The
World Bank, n.d.).
3.3. Control variables and interaction variables
Several control variables are added to the model.
Initial development level: To control for differences in development stadia the current GDP per capita
is included.
Investment: To include investment as a determinant of growth, the variables foreign direct
investment and gross capital formation are added. Foreign direct investments are the direct equity
flows coming in to the country. Gross capital formation covers additions to the fixed assets of the
economy plus net changes in the level of inventories. This can be viewed as the domestic investments
(The World Bank, n.d.). Foreign direct investment and gross capital formation are in percentage of
GDP, to be able to compare between the different economy sizes.
Human capital: The enrolment ratios of primary and secondary education are used to include human
capital. Secondary enrolment rate is also used as an interaction effect for education. The ratio is
conducted using the total enrolment and the population of the age group that would corres pond to
the level of education (The World Bank, n.d.).
14
Inflation: Inflation shows the price change in the economy as a whole , which could also influence the
GDP growth (The World Bank, n.d.).
The value added of services and agriculture will also be added as control variables to prevent from
miscalculating and overestimating service export coefficients.
English as official language, internet access and secondary education are used to include an interaction
effect.
English official language: English is considered an official language, if it is used in interactions between
citizen and government officials (Wikipedia, 2015).
Internet access: This variable indicates the number of individuals per 100 people who haves used the
internet in the last 12 months. (The World Bank, n.d.).
3.4. Descriptive data
The extreme outcomes in the GDP per capita growth are both from Libya, which had a decrease in
GDP of 62% in 2011, and an increase of 103% a year later. Luxembourg has the highest modern service
export as percentage of GDP, with a value of 131% in 2013, whereas Iraq held the lowest value in
2006, with 0,00798% of the GDP.
Table 1: Descriptive values
Variable
GDP PC growth
Observations
1916
Mean
2.416643
Std. Dev.
5.401384
Min
-62.46503
Max
102.7794
Modern Services (% GDP)
1461
5.123525
10.39123
.0079828
131.4571
FDI (% GDP)
1765
6.304774
17.63698
-57.42675
466.5622
Gross capital formation (%
GDP)
GDP PC Current
1695
24.27608
8.744625
1.525177
81.9403
1940
14414.05
22372.97
143.7839
193892.3
Inflation
1916
6.339716
8.707247
-30.61347
103.8228
Service value added (%
GDP)
Agriculture value added
(% GDP)
School enrolment rate
primary
School enrolment rate
secondary
1678
58.15489
14.9919
2.428377
93.75511
1678
12.80547
12.52616
0
61.57867
1387
103.9108
13.1117
29.19822
165.1877
1263
80.19832
27.51717
7.35183
165.5813
A correlation matrix can be found in appendix A. The correlation between primary and secondary
school enrolment rate is not very high, so both are included in the model. Extreme values in the
dataset could possibly distort estimates of coefficients in the regression. Therefore a plot of the
leverage is made. It shows that Luxembourg (and Malta) has a leverage that is higher than average.
Libya on the right has very large residuals, meaning that the true value is very different than the
predicted value. If a case would be in the upper right corner it would be a problematic case. To check
if any observation should be left out a Cook’s distance test is performed. This measures the aggregate
15
change when the observation is not used in the model. When Cook’s distance is higher than 4/N it
may be problematic (Williams, 2015). Libya had a Cook’s distance of 0,174. Because it is logical that
Libya’s extreme values cannot be explained by the variables in the model, but are caused by extern
factors like war and civil conflict, Libya is deleted from the dataset.
Figure 3: Leverage and normalized residual squared
.1
Luxembourg
.08
Luxembourg
.06
Luxembourg
Luxembourg
Malta
Malta
Luxembourg
.04
Luxembourg
.02
Ireland
Ireland
Ireland
Lebanon
Ireland
Malta
Malta
Ireland
Lebanon
Lebanon
Ireland
Malta
Ireland
Singapore
Lebanon
Ireland
Malta
Singapore
Trinidad
and
Tobago
Singapore
Singapore
Bermuda
Afghanistan
Lebanon
Malta
Singapore
Bermuda
St.
Kitts
Nevis
Cyprus
Mauritius
Swaziland
Belgium
Afghanistan
Honduras
Hong
Switzerland
Switzerland
Afghanistan
Kong
SAR,
China
Barbados
Bhutan
Brazil
Burkina
Colombia
Congo,
Costa
Ecuador
Estonia
Guinea-Bissau
Iceland
Indonesia
Iraq
Kazakhstan
Lesotho
Libya
Malawi
Mexico
Mongolia
Namibia
Niger
Nigeria
Oman
Paraguay
Peru
Sao
Saudi
Sierra
South
Sudan
Turkey
United
Venezuela,
Zambia
Ethiopia
Belgium
Estonia
Kazakhstan
Sudan
Venezuela,
Cyprus
Bhutan
Iraq
Niger
Libya
Oman
Mexico
Turkey
Oman
Maldives
Libya
Tome
Arabia
Rica
Africa
Leone
Kingdom
Dem.
Faso
and
RB
RB
Rep.
Principe
Albania
Algeria
Antigua
Argentina
Armenia
Aruba
Australia
Austria
Azerbaijan
Bahrain
Bangladesh
Belarus
Belize
Benin
Bolivia
Bosnia
Botswana
Brunei
Bulgaria
Burundi
Cabo
Cambodia
Cameroon
Canada
Chile
Comoros
Cote
Croatia
Czech
Dominica
Dominican
Egypt,
El
Fiji
Finland
France
Gabon
Gambia,
Georgia
Germany
Ghana
Greece
Grenada
Guatemala
Guinea
Guyana
Hungary
India
Israel
Italy
Jamaica
Japan
Kenya
Kiribati
Korea,
Kosovo
Kuwait
Kyrgyz
Lao
Latvia
Lithuania
Macao
Macedonia,
Madagascar
Malaysia
Maldives
Mali
Mauritania
Moldova
Montenegro
Morocco
Mozambique
Nepal
Netherlands
New
Nicaragua
Norway
Pakistan
Panama
Papua
Philippines
Poland
Portugal
Qatar
Romania
Russian
Rwanda
Senegal
Serbia
Seychelles
Slovak
Slovenia
Solomon
Spain
Sri
Suriname
Sweden
Syrian
Tanzania
Tajikistan
Timor-Leste
Thailand
Togo
Tonga
Trinidad
Tunisia
Tuvalu
Uganda
Ukraine
Uruguay
Vanuatu
West
Denmark
Samoa
China
Liberia
Myanmar
Albania
Antigua
Argentina
Azerbaijan
Botswana
Brunei
Cambodia
France
Georgia
Greece
Guinea
India
Italy
Kuwait
Kyrgyz
Lithuania
Macao
Malaysia
Maldives
Mali
Mongolia
Norway
Panama
Papua
Paraguay
Portugal
Russian
Seychelles
Slovak
Slovenia
South
St.
Tuvalu
Ukraine
West
Aruba
Austria
Bahrain
Belarus
Bulgaria
Canada
Dominican
El
Netherlands
Nicaragua
Sri
United
Barbados
Congo,
Ethiopia
Gambia,
Grenada
Honduras
Moldova
Romania
Sao
Spain
China
Guinea-Bissau
Jamaica
Trinidad
Czech
Germany
Greece
Iceland
Latvia
Mongolia
Montenegro
Seychelles
Slovak
Solomon
Tonga
Estonia
Ghana
Guyana
Italy
Japan
Kiribati
Macao
Paraguay
Sweden
West
Cambodia
Hungary
Antigua
China
Liberia
Madagascar
St.
Aruba
Georgia
Grenada
Kuwait
Lithuania
Solomon
Croatia
Gambia,
Latvia
Sierra
Maldives
Russian
Trinidad
Antigua
Armenia
China
Botswana
Finland
Slovenia
Greece
Cabo
Maldives
Bhutan
Mongolia
West
Kuwait
Sierra
Latvia
Antigua
Macao
Lithuania
Armenia
Estonia
Ukraine
Salvador
Salvador
Lucia
Vincent
Lanka
Lucia
Vincent
Lanka
Kitts
Azerbaijan
Kitts
Macao
PDR
Azerbaijan
Tome
Zealand
d'Ivoire
Bank
Verde
Bank
Bank
Africa
Arab
Republic
New
Darussalam
States
Rep.
Verde
Republic
SAR,
New
Darussalam
States
Leone
and
Bank
Republic
SAR,
Kingdom
Rep.
Republic
SAR,
Azerbaijan
and
Rep.
and
Leone
Federation
and
Federation
and
The
The
Islands
SAR,
Federation
and
The
Islands
Islands
and
Republic
and
SAR,
Republic
and
Herzegovina
and
Guinea
FYR
Rep.
Republic
and
Guinea
Barbuda
Barbuda
Nevis
Tobago
China
and
Barbuda
Nevis
China
Tobago
Barbuda
China
Tobago
Barbuda
China
Principe
the
Gaza
the
Gaza
Gaza
China
Gaza
Grenadines
Grenadines
0
Leverage
Luxembourg
0
Libya
.1
.2
Normalized residual squared
16
.3
4. Empirics
By using a panel model it can be statistically concluded if modern services have an impact on the GDP
per capita growth. In addition to a cross-section study a panel study takes a time series part into
account. Using the Hausman’s test, it is determined that the fixed effects model is to be used. 5 The
Hausman’s test checks if there are significant differences between parameter values in the random
and the fixed effects model. If there is no correlation between unobserved variables and the
explanatory variables the parameters would be consistent in the fixed and in the random effects
model. If there is correlation between unobserved variables and the explanatory variables the fixed
effects model is to be used. The fixed effects model converges to the true coefficient values in larger
samples (Adkins & Carter Hill, 2011). The basic equation for a fixed effects model is:
𝑌𝑖𝑡 = 𝑎𝑖 + 𝛽1 𝑋𝑖𝑡 + 𝜀𝑖𝑡
In which Y denotes the dependent variable, in this case GDP growth per capita. 𝑎 𝑖 is the intercept,
which in the fixed effects model is allowed to change across countries. This controls for country
specific effects that can influence the GDP growth per capita. 𝛽 is the coefficient, X the different
independent variables, where i denotes the country, and t the year. 𝜀𝑖𝑡 denotes the error term.
This gives our equation with GDP per capita growth as dependent variable as follows:
Model 1.1
GDP PC Growthit = 𝑎 𝑖 + 𝛽1 Modern services/GDP it + 𝛽2 FDI/GDP it + 𝛽3 Gross
capital formation/GDP it + 𝛽4GDP PC Currentit + 𝛽5 Inflationit + 𝛽6Service value
added/GDP it + 𝛽7 Agriculture value added/GDP it + 𝛽8 Life expectancy at birthit +
𝛽9 School enrolment primary it + 𝛽10 school enrolment rate secondary it + 𝜀𝑖𝑡
Where again the coefficients are denoted by 𝛽1 to 𝛽10 , and our variable of interest the export of
modern services as percentage of the GDP is denoted by Modern services/GDP it. Next, the effects of
internet access, education and the ability to speak English in combination with the export of modern
services are conducted. This is done by adding interaction effects to our first model. This leads to the
following formula:
Model 1.2
GDP PC Growthit = 𝑎 𝑖 + 𝛽1 Modern services/GDP it + 𝛽2 FDI/GDP it + 𝛽3 Gross
capital formation/GDP it + 𝛽4GDP PC Currentit + 𝛽5 Inflationit + 𝛽6Service value
added/GDP it + 𝛽7 Agriculture value added/GDP it + 𝛽8 Life expectancy at birthit +
𝛽9 School enrolment primary it + 𝛽10 school enrolment rate secondary it +
𝛽11 internet accesit + 𝛽12 Modern services/GDP*Internet accessit + 𝜀𝑖𝑡
Model 1.3
GDP PC Growthit = 𝑎 𝑖 + 𝛽1 Modern services/GDP it + 𝛽2 FDI/GDP it + 𝛽3 Gross
capital formation/GDP it + 𝛽4GDP PC Currentit + 𝛽5 Inflationit + 𝛽6Service value
added/GDP it + 𝛽7 Agriculture value added/GDP it + 𝛽8 Life expectancy at birthit +
𝛽9 School enrolment primary it + 𝛽10 school enrolment rate secondary it
+ 𝛽11 Modern services/GDP*educationit + 𝜀𝑖𝑡
Model 1.4
GDP PC Growthit = 𝑎 𝑖 + 𝛽1 Modern services/GDP it + 𝛽2 FDI/GDP it + 𝛽3 Gross
capital formation/GDP it + 𝛽4GDP PC Currentit + 𝛽5 Inflationit + 𝛽6Service value
added/GDP it + 𝛽7 Agriculture value added/GDP it + 𝛽8 Life expectancy at birthit +
5
For test output see appendix B.
17
𝛽9 School enrolment primary it + 𝛽10 school enrolment rate secondary it +
𝛽11 Englishit + 𝛽12 Modern services/GDP*Englishit + 𝜀𝑖𝑡
In the models 1.2, 1.3, and 1.4, the interaction effect of internet access, education and the English
language are added, respectively. Education is taken as the secondary school enrolment rate, which
was already included in the model. English is a dummy variable indicating if English is an official
language or not.
As suggested in the research by Mishra, Lundstrom and Anand (2011) a lagged effect is used for the
modern services export variable and the current GDP per capita. In this model the one period prior
of these variables is used to estimate the dependent.
Model 2.
GDP PC Growthit = 𝑎 𝑖 + 𝛽1 Modern services/GDP i,t-1 + 𝛽2FDI/GDP it + 𝛽3 Gross
capital formation/GDP it + 𝛽4GDP PC Currenti,t-1 + 𝛽5 Inflationit + 𝛽6 Service
value added/GDP it + 𝛽7 Agriculture value added/GDP it + 𝛽8 Life expectancy at
birthit + 𝛽9School enrolment primary it + 𝛽10 school enrolment rate secondary it
+ 𝜀𝑖𝑡
Lastly, the logarithmic values of the dependent and independent variables is taken, in accordance
with Mishra, Lundstrom and Anand (2011). This leads to the following model:
Model 3.
Log GDP PC Growthit = 𝑎 𝑖 + 𝛽1 Log Modern services/GDP i,t-1 + 𝛽2 Log FDI/GDP it
+ 𝛽3 Log Gross capital formation/GDP it + 𝛽4 Log GDP PC Currenti,t-1 + 𝛽5 Log
Inflationit + 𝛽6 Log Service value added/GDP it + 𝛽7 Log Agriculture value
added/GDP it + 𝛽8 Log Life expectancy at birthit + 𝛽9 Log School enrolment
primary it + 𝛽10 Log school enrolment rate secondary it + 𝜀𝑖𝑡
Models 1.1 till 1.4 are also used with the dataset only including lower and middle income countries,
to see if it leads to similar results. To control for heteroscedasticity robust standard errors are used
in estimating the models.6
6
For test output see appendix C.
18
5. Results
In this section the output of the estimated models, as described in the previous section, is presented.
The results found will be discussed.
5.1. Panel model results
Table 2 shows the results of model 1.1 and the models 1.2, 1.3, and 1.4, using an interaction effect.
The first column shows the results of the regression of the control variables, before adding the
variable of interest, the modern service exports. As expected investments have a positive influence
on GDP per capita growth. The variables of Foreign direct investment and gross capital formation both
have a significant effect. The current GDP per capita has a significant negative effect on GDP growth
per capita, which aligns with the convergence theory mentioned by Dewan and Hussain (2001) and
Durlauf, Kourtellos and Tan (2005) as explained in section 2.10. The primary and secondary school
enrolment rates have a small negative value. This is surprising, since human capital could be a
determinant of economic growth. However the values could be explained by the convergence theory,
assuming that wealthy countries have high school enrolment rates.
Model 1.1 shows the results with modern service exports as percentage of GDP added. There are no
large differences compared to the first model. The export of modern services has a positive and
significant (p = 0.003) influence on GDP per capita growth. Adding the modern service variable also
leads to an increase in within R2 from 0.1706 to 0.1863, indicating that the model 1.1 has more
explanatory power. The independent variables in model 1.1 explain 18,63% of the variance in GDP per
capita growth. When the export of modern services as percentage of GDP grows with one percentage
point the GDP per capita growth is expected to be 0.177 higher, other thing equal. Thus hypotheses
1: The export of modern services is positively associated with GDP per capita growth, controlling for
other determinants of growth, cannot be rejected. The estimator for modern services has significant
positive explanatory power.
In model 1.2 an interaction effect with modern services and the use of internet is added to model 1.1.
The interaction effect is negative and insignificant (p = 0.782). A negative interaction parameter would
designate a substitution effect, where higher values of services exports would lead to less GDP per
capita growth if the rate of internet users is higher. The modern service exports have a value of 0.209,
higher than in model 1.1, indicating that for each percentage point increase GDP per capita increases
with 0.209, if rate of internet users is zero. It is logical that without internet access exporting services
would not be possible. However a high internet user rate is not necessary. The variable of current GDP
per capita becomes insignificant (p = 0.857). The internet users variable is very significant. More
developed countries have higher internet user rates, so it is not surprising that adding the internet
users variable influences the current GDP per capita variable. Model 1.2 has an within R-square of
0.2125, which would signify that it has more explanatory power than model 1.1.
Model 1.3 shows the added interaction effect for education. The modern service exports parameter
is no longer significant (p = 0.356). If the secondary school enrolment rate would be zero the GDP per
capita growth would be 0.17 percentage point higher if modern service export as GDP percentage
would be one percentage point higher. The interaction effect is positive, which means that higher
modern service export values leads to higher GDP per capita rates, if you also have a higher secondary
school enrolment rate. However the variable is not significant (p = 0.981).
19
Table 2: Output GDP growth model
GDP per capita growth
Model 1.0
Model 1.1
Model 1.2
31.864***
33.053***
28.101***
33.070***
33.174***
(6.651)
(7.342)
(7.252)
(7.425)
(7.376)
0.177***
0.209***
0.173
0.153*
(0.060)
(0.072)
(0.186)
(0.090)
Constant
Modern services (% of GDP)
FDI (% of GDP)
Gross capital formation (% of
GDP)
GDP PC (Current US$)
Inflation GDP deflator
Services value added of GDP
Agriculture value added of
GDP
School enrolment rate
primary
School enrolment rate
secondary
Model 1.3
Model 1.4
0.016*
0.018**
0.01761***
0.018**
0.018**
(0.009)
(0.009)
(0.006)
(0.009)
(0.009)
0.223***
0.266***
0.235***
0.267***
0.267***
(0.052)
(0.063)
(0.060)
(0.064)
(0.063)
-0.0001***
-0.0001***
0.0000
-0.0001***
-0.0001***
(3E-05)
(3E-05)
(0.0000)
(0.0000)
(0.0000)
0.055**
0.040*
0.029
0.040*
0.040*
(0.022)
(0.024)
(0.023)
(0.024)
(0.024)
-0.400***
-0.435***
-0.369***
-0.435***
-0.436***
(0.092)
(0.104)
(0.101)
(0.104)
(0.104)
-0.119
-0.159
-0.149
-0.159
-0.159
(0.085)
(0.098)
(0.102)
(0.098)
(0.099)
-0.066**
-0.056
-0.056*
-0.056
-0.057
(0.033)
(0.034)
(0.031)
(0.034)
(0.034)
-0.026
-0.041*
0.001
-0.041
-0.041*
(0.022)
(0.024)
(0.023)
(0.027)
(0.024)
Internet users
-0.086***
(0.022)
English offical language
0.000
(omitted)
Modern services (% of GDP) *
-0.0003
Internet access per 100
(0.001)
Modern services (% of GDP) *
0.00004
secondary education
(0.002)
Modern services (% of GDP) *
0.052
English official language
R-squared
whitin
between
overall
observations
(0.099)
0.1706
0.2410
0.1257
1047
0.1863
0.2762
0.1187
954
0.2125
0.2355
0.1357
945
0.1863
0.2761
0.1358
954
0.1864
0.2741
0.1350
954
* indicates a 10% significance, ** and *** indicate a 5% and 1% significance, respectively. Robust standard
errors are denoted between brackets.
20
Lastly an interaction effect is added using a dummy variable indicating if English is an official language.
The results are shown in model 1.4. Because of collinearity the dummy variable indicating if English is
an official language is deleted from the model. The interaction effect is positive, but also not
significant. A positive effect means that higher modern service exports would lead to higher GDP
growth per capita, if English is an official language.
5.2. Lagged variables
Table 3. Output with lagged variables
GDP per capita growth
Model 2
Model 3 (log)
Constant
30.733***
5.318*
(7.611)
(2.766)
0.300***
0.376***
(0.082)
(0.127)
0.018***
0.173***
(0.006)
(0.049)
0.285***
1.017***
(0.058)
(0.276)
-0.0003***
-0.916***
(0.0001)
(0.239)
0.019
0.017
(0.026)
(0.043)
-0.368***
-1.050
(0.109)
(0.858)
0.057
-0.047
(0.105)
(0.419)
-0.086***
-0.301
(0.032)
(0.903)
-0.029
-0.397
(0.025)
(0.518)
0.2471
0.3309
0.1563
0.1979
0.0785
0.068
845
612
Modern services lag (% of GDP)
FDI (% of GDP)
Gross capital formation (% of GDP)
GDP PC lag (Current US$)
Inflation GDP deflator
Services value added of GDP
Agriculture value added of GDP
School enrolment rate primary
School enrolment rate secondary
R-squared
whitin
between
overall
observations
* indicates a 10% significance, ** and *** indicate a 5% and 1% significance, respectively. Robust standard
errors are denoted between brackets.
In model 2 the variables of modern services and the current GDP per capita are lagged one period.
This decreases the number of observations. The effects described in section 2.3 and 2.5 could take
some time. Trading forces domestic firms to increase their efficiency, leading to productivity growth,
which could have positive effects on GDP per capita growth in the next period. In the model the
modern service lag is positive and significant at 1% (p = 0.000). If modern service exports would be
21
one percentage point higher, GDP per capita growth one period later would be 0.30 higher, other
thing equal. The within R-square has a value of 0.2471, higher than the R-square in model 1.1, which
would denote that model 2 has more explanatory power. The current lagged GDP per capita is also
significant (p = 0.000) and has a larger negative value compared to model 1.1.
Model 3 uses the same lagged variables but takes the logarithmic value of all the independent and the
dependent variables. The number of observations is reduced cause it is impossible to take the
logarithm of negative values. Modern services is still significant at 1% (p = 0.004). If the modern service
exports variable would increase by one percent the GDP per capita growth would increase by 0.376
percent in the next period, other thing equal.
5.3. Low and middle income countries
The dataset only including low and middle income countries has 585 observations in model 1.1. Table
3 shows the results for the parameter estimates. Some variables are less significant in comparison to
the model including countries of every income level. Foreign Direct Investment and primary school
enrolment rate are no longer significant, and current GDP per capita is less significant. However the
share of agriculture is significant and negative, signifying that countries that have a higher share of
agriculture in GDP have lower GDP per capita growth. In model 1.1 modern service exports are
significant at 10% (p = 0.06). The parameter is positive though slightly smaller than the one with the
complete dataset. If modern service exports as percentage of GDP increase by one percent point, the
expected GDP per capita will be 0.167 percentage point higher, other things equal. The whitin Rsquare is 0.1317, indicating that model 1.1 explains 13% of the variance in GDP per capita growth.
In model 1.2 and 1.3 the modern services variable is no longer significant. In model 1.4 modern
services is more significant than in the complete dataset. The interaction effect for internet access is
positive, but not significant (p = 0.532). A positive effect would denote that higher modern service
exports would lead to higher GDP growth per capita, if the internet access rate was higher. The
interaction effects in model 1.3 and 1.4 are negative, which would imply that higher modern services
would lead to less GDP per capita growth, if the school enrolment rate was higher (or if English was
an official language in model 1.4).
Using a dataset only including lower and middle income countries does change the results, the
variables in model 1.1 are less significant, and the interaction parameters have a reversed effect. The
estimates could be less significant because of the smaller dataset, or because there are no strong
relations between the explanatory and dependent variables in low and middle income countries.
22
Table 4: Fixed effects model, low and middle income countries
GDP per capita growth
Model 1.0
Model 1.1
Model 1.2
Model 1.3
Model 1.4
Constant
28.854***
29.180***
23.714***
28.645***
28.514***
(7.588)
(8.492)
(8.914)
(8.648)
(8.504)
Modern services (% of GDP)
FDI (% of GDP)
Gross capital formation (% of
GDP)
GDP PC (Current US$)
Inflation GDP deflator
Services value added of GDP
Agriculture value added of GDP
School enrolment rate primary
School enrolment rate
secondary
0.167*
0.117
0.354
0.242**
(0.088)
(0.078)
(0.347)
(0.095)
0.000
0.000
0.000
0.000
0.000
(0.000)
(1E-11)
(0.000)
(0.000)
(0.000)
0.145***
0.175***
0.167**
0.173**
0.175***
(0.051)
(0.066)
(0.065)
(0.067)
(0.066)
-0.001
-0.0005
0.0003
-0.0005
-0.0004
(0.0004)
(0.0004)
(0.0005)
(0.0004)
(0.0004)
0.050**
0.033
0.024
0.033
0.033
(0.023)
(0.024)
(0.022)
(0.024)
(0.024)
-0.365***
-0.387***
-0.340***
-0.386***
-0.388***
(0.104)
(0.123)
(0.128)
(0.123)
(0.123)
-0.188**
-0.207**
-0.168
-0.205
-0.200*
(0.086)
(0.104)
(0.109)
(0.104)
(0.103)
-0.033
-0.015
-0.009
-0.016
-0.009
(0.033)
(0.033)
(0.037)
(0.032)
(0.034)
-0.019
-0.050
-0.028
-0.042
-0.053
(0.039)
(0.043)
(0.049)
(0.045)
(0.044)
Internet users
-0.112***
(0.038)
English offical language
0.000
(omitted)
Modern services (% of GDP) *
Internet access per 100
Modern services (% of GDP) *
secondary education
Modern services (% of GDP) *
English official language
R-squared
whitin
between
overall
observations
0.002
(0.003)
-0.003
(0.005)
-0.263
(0.216)
0.1261
0.0690
0.0591
612
0.1317
0.1203
0.0732
585
0.1501
0.1267
0.0894
578
0.1320
0.1125
0.0737
585
0.1333
0.1294
0.0772
585
* indicates a 10% significance, ** and *** indicate a 5% and 1% significance, respectively. Robust standard
errors are denoted between brackets.
23
6. Conclusion and discussion
Trade in service plays an increasingly large role in the world economy. Although a large service sector
is unmistakably associated with more developed countries, exporting services is not uncommon for
low income countries. There is productivity growth in the service sector because of new technologies
like IT. The literature also indicates that trading leads to productivity growth in the service sector. By
exporting, markets can be increased and foreign demand could lead to substantial gains. Developing
countries have a lot of potential to successful supply and export services because of the low cost labor,
if they can offer a similar quality. Tradability also leads to extra growth in value added of services
(Eichengreen and Gupta 2011). The export-led growth theory explains that export expansion is one of
the main determinants of growth. Statistical research on the subject however led to ambiguous
results. The theory is based on exporting manufactured goods, but could also apply on services, since
they have become tradable in a similar manner to goods. Many developing countries already have a
relative comparative advantage is several modern services. Mishra, Lundstrom and Anand (2011)
showed that exporting sophisticated services leads to higher economic growth, which applies for
developing economies as well.
In the statistical research a positive association between GDP growth and modern service exports is
clear. There is a significant positive relationship (p= 0.003) between modern service exports as
percentage of GDP and GDP per capita growth, controlling for other determinants of economic
growth. GDP per capita growth is 0.177 higher if the export of modern services grows with one
percentage point, other thing equal. Interaction effects with secondary school enrolment rate, English
language and internet usage and modern services don’t lead to significant results, so no effects using
these variables can be concluded. A lagged variable for modern services is significant and has a larger
effect (𝛽=0.3) than the non-lagged variable. This variable could signify that the positive effects of
modern service export take some time. A lagged variable also means the independent variable
happens one period prior to the dependent, which could indicate that there is causal relationship
between the two variables. Because the focus in this thesis is mainly on developing countries, the
same model is used on a data sample only including low and middle income countries. The same
positive result is found for the modern services parameter, although it’s less significant, having a pvalue of 0.06.
The research question in thesis is: “What is the impact of exporting modern services on economic
growth for developing economies?”. It can be concluded that exporting modern services has a positive
influence on GDP growth per capita. This is also clear for low and middle income countries, although
the parameter is only significant at 10%. Developing countries can have higher economic growth by
expanding their modern service exports. As explained in the literature governments could take some
actions to implement this, by using education or by establishing software technology parks for
example.
The export-led growth theory is somewhat ambiguous. Therefore the causality between modern
service exports and GDP per capita growth should be further researched, to make more specific
conclusions regarding the association between the variables. In future research different explanatory
variables could be used for human capital, since the primary and secondary school enrolment rates
did not lead to significant results, although the literature said human capital is a likely determinant of
economic growth. Moreover the location of a country should be included in the model. Using a dummy
24