Antecedents and outcome of diversification control alignment longitudinal evidence from top 100 business groups in taiwan
Bạn đang xem bản rút gọn của tài liệu. Xem và tải ngay bản đầy đủ của tài liệu tại đây (582.01 KB, 122 trang )
ANTECEDENTS AND OUTCOME OF
DIVERSIFICATION-CONTROL ALIGNMENT:
LONGITUDINAL EVIDENCE FROM TOP 100
BUSINESS GROUPS IN TAIWAN
FENG MI
(B.Econ, Central China Normal University)
NATIONAL UNIVERSITY OF SINGAPORE
2004
ANTECEDENTS AND OUTCOME OF
DIVERSIFICATION-CONTROL ALIGNMENT:
LONGITUDINAL EVIDENCE FROM TOP 100
BUSINESS GROUPS IN TAIWAN
FENG MI
A THESIS SUBMITTED
FOR THE DEGREE OF MASTER OF SCIENCE
(MANAGEMENT)
DEPARTMENT OF MANAGEMENT & ORGANIZATION
NATIONAL UNIVERSITY OF SINGAPORE
2004
ACKNOWLEDGEMENTS
The past two years in NUS Business School must be always memorable in my life,
during which I have been exposed to a wide scope of interesting academic topics as
well as inspired by a number of highly respectable scholars. I enjoy such learning
process, during which I tasted the very fulfillment in the intellectual pursuit. I would
like to take this opportunity to express my uttermost gratitude to those who have
given me sincere support and encouragement.
Great thanks to my supervisor, Dr. Chung Chi-nien. I would like to attribute the
majority of my improvement to your enlightening guidance and your strict standard.
Your trust and expectation have been a great motivation underlying every step I
made in my academic endeavor. More importantly, you are a reliable friend that I
can always rely on. As your first student, I hope one day I could make you feel
proud.
Special thanks to my co-supervisor, Dr. Ishtiaq Mahmood. I appreciate your
systematic training and persistent support throughout my study and research. In
addition, I would never forget the enjoyment we had in our open conversation,
mostly about life, culture, and nation, which have upgraded my understanding
towards the nature of the world around us.
Many thanks to A/P Kowtha N Rao and A/P Albert Teo. Thank you for providing so
many constructive comments to the preliminary version of my thesis. I appreciate all
the time and effort you spent to help me improve my thesis. I would also like to
thank Dr. Ronald Rodgers, A/P Vivien Lim, A/P Glenn Nosworthy for all the
interesting classes.
I would like to say “Thank you, my buddies” to all my friends. Thank you, Ge
Chang, for every pleasant moment we had together. Thank you, Sheng Zixia. You
were always willing to lend me a hand whenever I met an obstacle in analysis.
Thank you, Xu Jingping, Fang Ruolian, Deng Min, Tu Ning, and Zhu Hong for your
wholehearted help for my courses work. Thank you,Wang Ping, Kuai Jian, Wanyan
Shaohua, and Cheng Lingfeng for all the busy but happy time we spent in our small
office. Thank you, Aegean Leung, Liu Wu, Hu Zhehua, Joshua, and Rong Wei, my
dear cohort friends. I have benefited a lot from your insightful points in all the
classes and seminars.
Finally, I dedicate this thesis to my parents and my grandma. I deeply appreciate
your love that nowhere else I can find in the world. It is because of your love that I
have the courage to take my dream and make every brave move.
TABLE OF CONTENT
SUMMARY............................................................................................................................................... I
LIST OF TABLES....................................................................................................................................1
TABLE 1. MEANS AND STANDARD DEVIATIONS OF FIRM SIZE FOR TOP 100 BUSINESS GROUPS............1
TABLE 2. NUMBER AND PERCENTAGE OF TOP RANKED MANUFACTURING FIRMS THAT IS GROUP
AFFILIATED ............................................................................................................................................1
TABLE 3. ILLUSTRATIVE VALUE OF HERFINDAHL INDEX OF GROUP CONTROL .....................................2
TABLE 4. FOUR ILLUSTRATIVE CONDITIONS OF STRATEGY, STRUCTURE AND ALIGNMENT...................2
TABLE 5. MEANS, STANDARD DEVIATION, AND CORRELATION OF MAIN VARIABLES FOR POOLED
SAMPLE ..................................................................................................................................................3
TABLE 6. MEANS AND STANDARD DEVIATION OF MAIN VARIABLES BY YEARS ...................................5
TABLE 7. REGRESSION OF RETURN-ON-ASSETS ON ALIGNMENT AND CONTROL VARIABLES ................6
TABLE 8. REGRESSION ON ALIGNMENT AT MANAGER LEVEL................................................................7
TABLE 9. REGRESSION ON ALIGNMENT AT DIRECTOR LEVEL ................................................................8
LIST OF FIGURES..................................................................................................................................9
FIGURE 1. THE GOVERNANCE STRUCTURE OF BUSINESS GROUPS IN TAIWAN .......................................9
CHAPTER I. INTRODUCTION ............................................................................................................1
CHAPTER II. BACKGROUND OF BUSINESS GROUPS .................................................................7
1.
DEFINITION ..................................................................................................................................7
2.
ECONOMIC SIGNIFICANCE OF BUSINESS GROUPS IN TAIWAN...................................................9
3.
STRATEGY AND STRUCTURE OF BUSINESS GROUPS.................................................................11
CHAPTER III. THEORETICAL PERSPECTIVES ..........................................................................17
1.
STRATEGY, STRUCTURE, AND ALIGNMENT ..............................................................................17
2.
THE LINK BETWEEN ALIGNMENT AND PERFORMANCE OF BUSINESS GROUPS IN TAIWAN ...20
2.1 Market Imperfection..................................................................................................................23
2.2 Family Dominance in Business Group .....................................................................................28
3.
ANTECEDENTS OF ALIGNMENT .................................................................................................30
3.1 Technical-Economic Account ...................................................................................................32
3.2 Institutional Account.................................................................................................................35
3.3 Power and Politics Account......................................................................................................38
CHAPTER IV. DATA, MEASURES, AND ESTIMATION ..............................................................46
1.
SAMPLE AND DATA SOURCES....................................................................................................46
2.
MEASURES .................................................................................................................................48
2.1 Dependent Variable .................................................................................................................48
Group performance.........................................................................................................................48
2.2 Independent Variable...............................................................................................................49
Diversification strategy...................................................................................................................49
Inter-organizational control ...........................................................................................................50
Alignment of diversification and control.........................................................................................52
Market Concentration.....................................................................................................................55
Number of Listed Firms ..................................................................................................................56
Ownership.......................................................................................................................................56
2.3 Control Variables......................................................................................................................58
3.
DESCRIPTION OF THE DATA ......................................................................................................59
4.
MODEL SPECIFICATION AND ESTIMATION ...............................................................................62
4.1 Model specification...................................................................................................................62
4.2 Estimation .................................................................................................................................64
CHAPTER V. RESULTS ......................................................................................................................66
1.
THE LINK BETWEEN ALIGNMENT AND PERFORMANCE ...........................................................66
2.
ANTECEDENTS OF ALIGNMENT .................................................................................................70
2.1 Alignment at manager level ......................................................................................................72
2.2 Alignment at director level........................................................................................................75
CHAPTER VI. DISCUSSION AND CONCLUSION .........................................................................77
1.
FINDINGS AND IMPLICATIONS ...................................................................................................78
1.1 Chandler’s theoretical scope and market institutions...............................................................78
1.2 Antecedents of alignment ..........................................................................................................83
2.
LIMITATION ...............................................................................................................................89
3.
CONCLUSION .............................................................................................................................93
REFERENCE .........................................................................................................................................96
APPENDIX ...........................................................................................................................................103
APPENDIX 1. INSTITUTIONAL TRANSITIONS IN TAIWAN, 1970S-1990S ..............................................103
APPENDIX 2. CODING SCHEME FOR GROUP OWNERSHIP....................................................................104
APPENDIX 3. REGRESSION OF RETURN-ON-SALES ON ALIGNMENT AND CONTROL VARIABLES ........105
Antecedents and Outcome of Diversification-Control Alignment:
Longitudinal Evidence from Top 100 Business Groups in Taiwan
Feng Mi
National University of Singapore
Summary
This study examines whether or not the alignment between diversification and
control—a classic concern of Chandler —holds for business groups in Taiwan. The
central thesis from Chandler is that the fit between corporate strategy and
organizational structure adds value to performance, whereas a misfit destroys value.
A general implication from Chandler is that there should be an inverse relationship
between diversification and control. However, backwardness of market institutions
in emerging economies suggests that alignment does not necessarily mean superior
performance. Moreover, institutionalized social relationship like family makes the
picture more complex. The preference of family to run business groups that are
under their primary control would outweigh the classic principles of how corporate
strategy and structure should be organized.
The second part of this thesis investigates the antecedents of diversification-control
alignment. This is an important topic but has somehow been ignored by previous
literature. I suggest that alignment at both managerial hierarchies in business group
is more or less subject to the influence of market competition, institutional forces,
-i-
and the power relationship among major shareholders of a group. These three
accounts have successfully explained the spread of M-form through multibusiness
organizations in advanced economies, and I suppose that they are equally applicable
to interpret the diversification/control interface for business group in Taiwan.
The empirical analyses are based on longitudinal data of the 100 largest business
groups in Taiwan over the period of 1981-1998. The importance of business groups
in many emerging economies warrants me to use groups, other than individual firms,
as the sample of analysis.
Analytical result shows that Chandler’s argument does not hold when market is
underdeveloped, while the benefit of alignment begins to emerge as market develops.
Such finding suggests that market moderates the relationship between alignment and
performance. When it comes to the antecedents of alignment, it is interesting that
alignment at manager level is subject to the influence of product market, capital
market, and the power landscape of major shareholders of a group, while the
alignment at director level remains free from such influences. This finding offers
important theoretical implications to existing literature and opens room for future
research.
- ii -
List of Tables
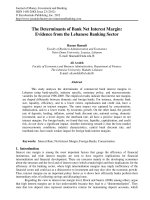
Table 1. Means and Standard Deviations of Firm Size for Top 100 Business Groups
Year
1981
1986
1990
1994
1998
Number of Affiliated Firms
7.19
(5.36)
7.69
(5.85)
8.15
(5.06)
10.21
(6.52)
13.62
(8.87)
Employees (thousand)
3179
(4962)
3458
(5703)
3962
(6655)
4671
(7080)
7299
(9302)
Net Sales (hundred of $NT million)
7252
(11168)
11866
(22882)
20841
(47982)
28487
(40385)
49497
(57906)
Group Sales/GNP
28.6%
29.4%
39.2%
41.5%
54.3%
Number of Groups
100
97
100
100
100
Note: Numbers without parentheses are means, and numbers with parentheses are standard deviations
Table 2. Number and Percentage of Top Ranked Manufacturing Firms that is Group
Affiliated
1981
1986
1990
1. Top100 59 (59%)
59 (59%)
51 (51%)
2. Top200 97 (49%)
95 (48%)
79 (40%)
3. Top300 132 (44%)
118 (39%)
107 (36%)
4. Top400 154 (39%)
144 (36%)
127 (32%)
5. Top500 182 (36%)
160 (32%)
141 (28%)
Note: The variable name “Top 100” indicates the number and
percentage of top 100 largest manufacturing firms belonging to
business groups. Numbers in parentheses indicate the percentage.
Ranks are based on net sales of each firm in according years.
-1-
1994
58 (58%)
93 (47%)
122 (41%)
145 (36%)
158 (32%)
1998
69 (69%)
112 (56%)
146 (49%)
181 (45%)
202 (40%)
Table 3. Illustrative Value of Herfindahl Index of Group Control
Percent of Sales under Control
Manager Manager Manager Manager Manager Index of
Control
1
2
3
4
5
1
0.95
0.9
0.8
0.6
0.6
0.5
0.4
0.3
0.2
0.5
0.1
0.1
0.4
0.1
0.2
0.2
0.2
0.2
0.1
0.1
0.2
0.2
0.2
0.2
0.1
0.1
0.1
0.2
0.2
0.1
0.1
0.1
0.2
1
0.9
0.82
0.66
0.52
0.40
0.34
0.26
0.22
0.20
Examples of Calculation
(0.95 square) + (0.5 square)
(0.9 square) + (0.1 square)
(0.8 square) + (0.1 square) + (0.1 square)
Table 4. Four Illustrative Conditions of Strategy, Structure and Alignment
Condition
Diversification
(entropy)
Control
(Herfindahl)
Alignment
A
1
0
1
Implication
Very high level of diversification with
loose control. Good fit.
B
0
1
1
Very focused strategy with centralized
control. Good fit.
C
1
1
0
Very high level of diversification with
very tight control. Misfit.
D
0
0
0
Very focused strategy with highly
decentralized control. Misfit
-2-
Table 5. Means, Standard Deviation, and Correlation of Main Variables for Pooled Sample
Mean
S.D.
1
1. ROA
4.79
6.04
1.00
2. ROS
5.08
8.07
3. Group Age
29.28
11.05
9.21
1.27
5. Liability/Assets Ratio
0.03
0.04
6. Total Diversification
0.73
0.46
7. Director Control
0.70
0.24
8. Manager Control
0.52
0.25
9. Alignment_Dir
0.76
0.18
10. Alignment_Man
0.78
0.18
11. Market Concentration
0.23
0.16
12. No. of Listed Firms
0.86
1.03
13. Insider
31.65
20.97
14. Institutional Investor
5.75
7.14
15. Foreign Investor
4.37
8.61
16. Government
0.52
2.89
0.07
(0.13)
0.12***
(0.01)
-0.14***
(0.00)
-0.01
(0.76)
0.06
(0.20)
0.00
(0.91)
-0.01
(0.84)
0.08*
(0.09)
0.06
(0.21)
0.09**
(0.04)
-0.01
(0.82)
-0.13***
(0.01)
0.13***
(0.01)
0.10**
(0.04)
1.00
4. Sales (Exponentiated)
0.75***
(0.00)
-0.03
(0.51)
0.09**
(0.04)
-0.17***
(0.00)
-0.09**
(0.04)
0.13***
(0.00)
0.08*
(0.08)
0.01
(0.91)
0.04
(0.32)
0.09*
(0.06)
-0.03
(0.55)
0.04
(0.39)
0.03
(0.49)
0.18***
(0.00)
0.04
(0.44)
0.37***
(0.00)
-0.02
(0.71)
0.24***
(0.00)
-0.19***
(0.00)
-0.13***
(0.00)
-0.06
(0.17)
0.17***
(0.00)
-0.11**
(0.03)
0.26***
(0.00)
-0.10**
(0.04)
-0.20***
(0.00)
0.08
(0.11)
0.03
(0.51)
0.03
(0.54)
0.28***
(0.00)
-0.24***
(0.00)
-0.34***
(0.00)
0.01
(0.76)
0.13***
(0.00)
-0.24***
(0.00)
0.60***
(0.000
-0.24***
(0.00)
-0.07
(0.14)
0.14***
(0.00)
0.11**
(0.02)
-0.02
(0.69)
-0.01
(0.87)
0.06
(0.22)
0.04
(0.42)
0.04
(0.39)
0.07
(0.14)
-0.03
(0.58)
-0.08*
(0.10)
0.04
(0.39)
-0.05
(0.27)
-0.04
(0.46)
-0.30***
(0.00)
-0.44***
(0.00)
-0.25***
(0.00)
0.35***
(0.00)
-0.01
(0.79)
0.30***
(0.00)
0.13***
(0.01)
-0.04
(0.42)
0.05
(0.27)
-0.02
(0.73)
0.53***
(0.00)
-0.19***
(0.00)
0.07*
(0.10)
0.14***
(0.00)
-0.17***
(0.00)
0.03
(0.55)
0.00
(0.93)
0.04
(0.40)
0.05
(0.32)
0.13***
(0.00)
0.16***
(0.00)
0.16***
(0.00)
-0.30***
(0.00)
-0.01
(0.78)
0.07
(0.16)
-0.08
(0.12)
0.02
(0.63)
497
497
496
497
497
495
495
494
No. of Observations
* p <.10
** p < .05
*** p < .01
2
3
4
5
6
7
8
1.00
-3-
1.00
1.00
1.00
1.00
1.00
(Continued)
Mean
S.D.
1. ROA
4.79
6.04
2. ROS
5.08
8.07
3. Group Age
29.28
11.05
4. Sales (Exponentiated)
9.21
1.27
5. Liability/Assets Ratio
0.03
0.04
6. Total Diversification
0.73
0.46
7. Director Control
0.70
0.24
8. Manager Control
0.52
0.25
9. Alignment_Dir
0.76
0.18
1.00
10. Alignment_Man
0.78
0.18
11. Market Concentration
0.23
0.16
12. No. of Listed Firms
0.86
1.03
13. Insider
31.65
20.97
14. Institutional Investor
5.75
7.14
15. Foreign Investor
4.37
8.61
16. Government
0.52
2.89
0.27***
(0.00)
0.10**
(0.04)
-0.09**
(0.04)
-0.03
(0.60)
0.02
(0.61)
-0.09**
(0.05)
0.01
(0.83)
0.14***
(0.00)
0.13***
(0.00)
-0.04
(0.38)
0.00
(0.95)
0.09**
(0.05)
0.05
(0.27)
-0.12***
(0.01)
0.09*
(0.07)
0.00
(0.96)
0.01
(0.89)
-0.02
(0.68)
-0.22***
(0.00)
-0.11**
(0.03)
0.05
(0.28)
0.01
(0.85)
-0.05
(0.32)
-0.14***
(0.00)
-0.07
(0.12)
-0.01
(0.90)
-0.01
(0.80)
0.02
(0.75)
1.00
497
497
443
496
438
438
438
438
No. of Observations
* p <.10
** p < .05
*** p < .01
9
10
11
12
13
14
15
16
1.00
-4-
1.00
1.00
1.00
1.00
1.00
Table 6. Means and Standard Deviation of Main Variables by Years
Year
1981
1986
1990
1994
1998
1. Return on Assets (ROA)
2.48
(3.50)
6.97
(5.61)
4.86
(5.91)
6.14
(5.83)
3.55
(7.57)
2. Return on Sales (ROS)
2.49
(4.22)
5.73
(4.67)
4.89
(9.60)
8.44
(8.65)
3.88
(10.01)
3. Group Age
23.22
(8.73)
27.15
(9.48)
29.58
(9.92)
32.37
(11.22)
33.95
(12.28)
4. Sales (Exponentiated)
8.32
(0.99)
8.67
(1.08)
9.05
(1.22)
9.64
(1.05)
10.35
(0.92)
5. Liability/Assets Ratio
0.03
(0.01)
0.03
(0.02)
0.03
(0.07)
0.03
(0.02)
0.03
(0.02)
6. Total Diversification
0.69
(0.45)
0.68
(0.46)
0.79
(0.42)
0.74
(0.45)
0.76
(0.49)
7. Director Control
0.74
(0.25)
0.73
(0.24)
0.74
(0.21)
0.68
(0.24)
0.63
(0.24)
8. Manager Control
0.59
(0.25)
0.52
(0.27)
0.58
(0.23)
0.48
(0.25)
0.45
(0.25)
9. Alignment_Dir
0.78
(0.17)
0.73
(0.22)
0.77
(0.18)
0.77
(0.15)
0.78
(0.16)
10. Alignment_Man
0.79
(0.15)
0.73
(0.24)
0.81
(0.16)
0.78
(0.18)
0.78
(0.17)
11. Market Concentration
0.28
(0.16)
0.27
(0.14)
0.27
(0.15)
0.26
(0.12)
0.05
(0.08)
12. No. of Listed Firms
0.52
(0.83)
0.53
(0.93)
0.77
(0.87)
1.15
(1.07)
1.31
(1.16)
13. Insider Ownership
33.83
(21.40)
34.45
(22.56)
35.53
(22.10)
31.82
(20.49)
24.11
(16.82)
14. Institutional Ownership
5.37
(7.17)
5.56
(6.93)
6.13
(7.12)
5.96
(6.05)
5.57
(8.29)
15. Government Ownership
0.39
(1.95)
0.33
(1.78)
0.26
(1.57)
0.38
(1.61)
1.15
(5.16)
16. Foreign Ownership
4.03
(7.83)
4.44
(9.32)
4.26
(8.80)
4.88
(8.98)
4.14
(8.09)
100
97
100
100
100
No. of Groups
-5-
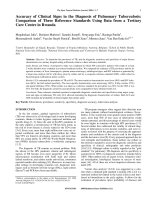
Table 7. Regression of Return-on-Assets on Alignment and Control Variables
DV= ROA
Model 1
Base Line
(1981-1998)
Model 2
Main Effect
(1981-1998)
Model 3
Main Effect
(1981-1990)
Model 4
Main Effect
(1994-1998)
ROA_t-2
0.071
(0.290)
-0.054
(0.318)
1.581**
(0.038)
-6.955
(0.396)
5.703***
(0.007)
-3.470***
(0.005)
(Omitted)
0.045
(0.505)
-0.063
(0.237)
1.912**
(0.013)
-6.124
(0.451)
6.172***
(0.004)
-4.567***
(0.000)
(Omitted)
-0.095
(0.347)
0.102
(0.251)
4.367***
(0.006)
-3.040
(0.735)
2.497
(0.404)
-5.569**
(0.012)
(Omitted)
-0.332**
(0.039)
-0.264*
(0.054)
0.916
(0.684)
-47.994
(0.704)
16.223***
(0.003)
-9.166***
(0.008)
(Omitted)
-4.096*
(0.092)
5.605**
(0.024)
-3.556
(0.335)
2.869
(0.424)
-7.027
(0.160)
13.136**
(0.033)
0.13
393
0.20
238
0.63
155
Group Age
Group Sales (Exponentiated)
Liability/Assets Ratio
Market Concentration
Total Diversification
Industry Dummies
Alignment_Dir
Alignment_Man
R-square
No. of Observations
* p <.10
** p < .05
*** p < .01
0.11
393
-6-
Table 8. Regression on Alignment at Manager Level
DV= Alignment_Man_t+4
Model 1
(1981-1994)
Model 2
Efficiency
Account
(1981-1994)
Model 3
Institutional
Account
(1981-1994)
Model 4
Power
Account
(1981-1994)
Model 5
Overall
Effect
(1981-1994)
-0.254***
(0.000)
0.003*
(0.085)
-0.044**
(0.036)
-0.050
(0.828)
(Omitted)
-0.329***
(0.000)
0.004*
(0.064)
-0.056**
(0.047)
-0.005
(0.982)
(Omitted)
-0.264***
(0.000)
0.003
(0.121)
-0.049**
(0.023)
-0.038
(0.869)
(Omitted)
-0.406***
(0.000)
0.005**
(0.028)
-0.060**
(0.022)
-0.033
(0.880)
(Omitted)
-0.476***
(0.000)
0.005**
(0.021)
-0.096***
(0.001)
0.007
(0.975)
(Omitted)
0.002
(0.176)
-0.001
(0.747)
0.015***
(0.000)
0.069
(0.139)
-0.140**
(0.049)
0.050**
(0.044)
0.003
(0.120)
-0.002
(0.760)
0.016***
(0.000)
0.094**
(0.043)
0.29
263
0.37
240
Base Line
Alignment _Man
Group Age
Group Sales (Exponentiated)
Liability/Assets Ratio
Industry Dummies
Market Concentration
-0.129*
(0.091)
No. of Listed Firms
0.024
(0.239)
Insider
Institutional Investor
Foreign Investor
Government
R-square
No. of Observations
* p <.10
** p < .05
*** p < .01
0.14
353
0.22
248
-7-
0.15
353
Table 9. Regression on Alignment at Director Level
DV= Alignment_Dir_t+4
Model 1
(1981-1994)
Model 2
Efficiency
Account
(1981-1994)
Model 3
Institutional
Account
(1981-1994)
Model 4
Power
Account
(1981-1994)
Model 5
Overall
Effect
(1981-1994)
-0.113*
(0.108)
-0.001
(0.438)
0.011
(0.635)
0.009
(0.971)
(Omitted)
-0.255***
(0.006)
0.001
(0.675)
-0.004
(0.896)
0.028
(0.910)
(Omitted)
-0.114*
(0.109)
-0.002
(0.426)
0.010
(0.665)
0.012
(0.964)
(Omitted)
-0.176**
(0.045)
0.000
(0.876)
0.027
(0.339)
0.021
(0.933)
(Omitted)
-0.240**
(0.013)
0.000
(0.927)
0.002
(0.959)
0.041
(0.867)
(Omitted)
0.001
(0.509)
-0.004
(0.439)
0.000
(0.954)
-0.069
(0.183)
-0.087
(0.282)
0.027
(0.325)
0.002
(0.405)
-0.005
(0.424)
0.000
(0.937)
-0.055
(0.296)
0.11
263
0.15
240
Base Line
Alignment _Dir
Group Age
Group Sales (Exponentiated)
Liability/Assets Ratio
Industry Dummies
Market Concentration
-0.090
(0.259)
No. of Listed Firms
0.005
(0.834)
Insider
Institutional Investor
Foreign Investor
Government
R-square
No. of Observations
* p <.10
** p < .05
*** p < .01
0.06
353
0.13
248
-8-
0.06
353
List of Figures
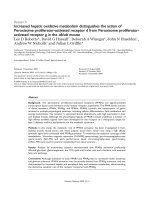
Figure 1. The Governance Structure of Business Groups in Taiwan
Firm
Firm
Firm
Firm
Firm
Key Leader
partner
brother
Firm
Core Leader 3
Core Leader 1
Firm
Core Leader 2
Firm
-9-
Firm
son
Firm
CHAPTER I. INTRODUCTION
This study examines the antecedents and outcome of the alignment between
diversification and control—a classic concern of Chandler (1962, 1990). The central
thesis from Chandler is that the fit between corporate strategy and organizational
structure benefit performance. After business enterprises grow by adding a number
of new product lines to achieve economy of scale and scope, they need to
decentralize coordination and control authority to deal with managerial overload and
information overload (Chandler, 1992). The adoption of multidivisional form
reflects such decentralization process. What is behind the apparent trend among
most of the large multibusiness companies towards the M-form actually relates to
the willingness to re-achieve the alignment between diversification and control,
which has been undermined during the aggressive strategic expansion. A more
general implication from Chandler is that there should be an inverse relationship
between diversification and control for proper firm configuration.
Although scholars that followed Chandler (e.g., Channon, 1973; Rumelt, 1974;
Suzuki, 1980; Hoskisson, Hill, and Kim, 1993; Whittington and Mayer, 2000) have
documented the spread of multidivisional form among large industrial companies in
developed markets, few scholars have paid enough attention to late-industrializing
-1-
countries, nor has Chandler’s argument been tested for business groups. It is not
clear whether or not the performance implication of the alignment between
diversification and control still holds for business groups in emerging markets. Two
reasons prompted me to cast such doubt.
In the first place, the institutional context of emerging economy is significantly
different from those of mature markets. Backwardness of factor markets in emerging
economy makes it possible for business enterprises to achieve exceptional growth
rate without paying enough attention to strategy-structure alignment. For instance,
part of competitive advantage of business groups stems from “contact ability” (Kock
and Guillen, 2001) and “project execution ability” (Amsden and Hikino, 1994).
These abilities are not industry specific, and thus can be applied in a number of
businesses. Based on these abilities, unrelated diversification and tight control by
founding entrepreneur (or his family) represents the mainstream corporate model in
Korea and Taiwan (Whitley, 1999). This model is still considered to be viable after
the financial crisis. However, such strategy/structure arrangement apparently
conflicts with western management norms, which require decentralized structure for
multibusiness firms.
-2-
In the second place, institutionalized social structure like family would have strong
impact on the alignment between strategy and structure in late-developing countries.
In Chandler’s model, the separation of ownership from operational management is
the basic feature of corporate governance. Although Chandler also talked about
family capitalism in United Kingdom, family is in most cases decoupled from
practical management. However, in late-industrializing economies like Taiwan,
family as the dominant shareholder still controls key management authorities
(Claessens, Djankov, and Lang, 2000). The pressure for business groups to pass its
decision-making rights to lower level professional managers contradicts with the
family’s propensity to retain as much power as possible.
The above two considerations make it difficult to apply Chandler’s theory on
strategy and structure directly in emerging context. In addition, business groups
seem to be incompatible with classic theories in corporate governance as well. On
the one hand, while business groups usually extend to multiple industries, they lack
formal managerial hierarchy. Business groups are a federation of loose-coupled
individual firms (Chung, 2001; Granovetter, 1995). They are short of the formal
structure like functional form or multidivisional form. On the other hand, the key
decision making rights may be tightly concentrated at the hand of a small clan of
people. Such configuration contradicts with the arguments of Chandler (1962, 1990,
-3-
1992) and Williamson (1975), which insist that managerial complexity leads to
formal and decentralized structure. In this sense, it is not clear whether the fit
between corporate strategy and organizational control as advocated by Chandler is
still meaningful to business groups or not. The first objective of this paper is to
examine Chandler’s argument in Taiwan to see whether it is still valid irrespective
of context. If the empirical result turns out to be supportive, this study would
promote the theoretical scope of Chandler’s argument. If evidence appears to be
inconsistent with Chandler, this study will help to draw theoretical boundaries for
Chandler’s arguments.
On top of Chandler’s theoretical framework, Kock and Guillen (2001) proposed a
new evolutionary model to depict the strategic and structural trend of business
groups. Their model incorporates the market imperfection and the resource-based
view into corporate evolution. Although alignment is still what the model advocate,
they suggested a reverse direction of strategy and structure change. This study can
also help to examine to what extent Kock and Guillen’s theory captures the reality in
the path of group development in Taiwan.
The second main objective of this article targets at the determinants of
diversification-control alignment. Although a number of previous studies (e.g.
-4-
Chang and Choi, 1988; Channon, 1973; Rumelt, 1974; Suzuki, 1980; Hoskisson,
Hill, and Kim, 1993) have mentioned the benefit of alignment on performance, we
know little about antecedents of the alignment. We do not know why some
companies can maintain a good alignment between diversification and control, but
others cannot. What explains the variance of diversification/control alignment
among firms remains largely unclear. While some studies argue that strategy
determines structure (Andrews, 1971; Hamilton and Shergill, 1992; Nelson, 1994;
Willamson, 1975), and others shed light on how structure restraints strategic
decisions (Bower, 1970; Child, 1972; Fredrickson, 1986), there is no consensus
about the causal relationship. In this case, it might be advisable to look at how other
exogenous factors that would simultaneously affect the strategy and structure of
firms thus matter to alignment. Based on previous studies on how M-form became
the dominant structure among multibusiness firms (Chandler, 1962; Clark and
Soulsby, 1999; Fligstein, 1985; Fligstein and Freeland, 1995; Palmer, Friedland,
Jennings, Powers, 1987; Palmer, Jennings, and Zhou, 1993), I propose that
efficiency consideration, institutional forces, and stakeholder’s interest are three
main antecedents of alignment.
The empirical analyses are based on longitudinal data of the 100 largest business
groups in Taiwan over the period of 1981-1998. The importance of business groups
-5-
in many emerging economies (Chang and Choi, 1988; Chang and Hong, 2000;
Guillen, 2000; Khanna and Palepu, 1997, 2000; Khanna and Rivkin, 2001; Carrera
et al., 2003), including Taiwan, warrants me to use groups, other than individual
firms, as the unit of analysis. However, the differences between groups and
multibusiness firms cast doubts on using existing concepts and measures to test
Chandler’s theory for groups. Therefore, the third objective of this paper is to
develop measures that can capture the strategic and structural feature for groups.
Following the first step by Chung, Mahmood, and Feng (2004), I formulate an index
to measure coordination/control and the alignment at the group level. Based on
Chandler’s argument, I would expect alignment between diversification and control
to have positive impact on performance.
The rest of the thesis is organized as follows. In Chapter 2, two sets of background
information, economic significance of business groups in Taiwan and strategy and
structure characteristics of the groups will be introduced. In Chapter 3, I will review
two sets of relevant previous studies. The first set is about the impacts of
diversification/control alignment on performance, and the other is on determinants
of alignment. Details of data sources and the way I construct the measures will be
elaborated in Chapter 4. Chapter 5 will show results, discussion, and conclusion.
-6-
CHAPTER II. BACKGROUND OF BUSINESS GROUPS
1. Definition
Business group is a common phenomenon in a variety of economies. A lot of
previous studies have paid attention to this organizational form (Chang and Choi,
1988; Chung, 2001; Granovetter, 1995; Hamilton, 1997; Khanna and Palepu, 1999;
Khanna and Rivkin 2001; Kock and Guillen, 2001; Strachan, 1976). Early definition
(Strachan, 1976) describes business group as “long-term association of a great
diversity of firms and the men who own and manage these firms”. Granovetter
(1995) acknowledged the necessary arbitrariness to define the boundary of business
group. In his definition, business groups are “collections of firms bound together in
some formal and/or informal ways… integrated neither completely nor barely at all”.
So defined, Granovetter (1995) excluded typical American conglomerates which
were usually formed and divested on the basis of financial optimization, a form short
of “social solidarity and social structure among component firms”.
Most recent definitions are consistent with Strachan’s (1976) and Granovetter’s
(1995) approach, but have developed more specific conceptual connotation and
extension. Chang and Hong (2000) characterized business groups as “a gathering of
formally independent firms under the single common administrative and financial
-7-
control of one family”. While this definition has limited generalizability in that
family control is not ubiquitously the case for business groups in every emerging
market (e.g. Japanese Keiretsu), it well reflects the feature in Korean and Taiwanese
business groups. In line with Chang and Hong (2000), Chung’s (2001) definition is
more comprehensive. He conceptualizes business groups as “a set of legally
independent firm that link to each other through various economic and social
relationships, and operate in a coherent manner”. There are three noteworthy
features in such definition. First, legal dependence distinguishes business groups
from multidivisional firms and conglomerates. Second, the evident diversity in the
structure of business groups is reflected by various economic and social
relationships. Third, operating coherence implicates that certain pattern of
coordination and control system exists in business groups. “Coherence” helps to
distinguish business groups from holding companies, whose affiliations run
autonomously without regular business and investment coordination. These three
elements in Chung’s definition have clarified some conceptual ambiguities in early
definitions. Common types of business groups include keiretsu in Japan, chaebol in
Korea, grupos economicos in Latin America, and business houses in India. In my
dataset, the oldest business group in Taiwan was established in 1918.
-8-