Application of displacement ventilation system to buildings in the tropics
Bạn đang xem bản rút gọn của tài liệu. Xem và tải ngay bản đầy đủ của tài liệu tại đây (1.67 MB, 113 trang )
ACKNOWLEDGEMENT
I would like to express my deepest gratitude to A/P David Cheong for his support,
guidance and valuable advice throughout this academic exercise.
I would like to thank Dr. Risto Kosonen for his support, valuable advice, expertise and
knowledge in this project.
I would like to express my appreciation to Mr. Yu Weijiang for the assistance, advice
and friendship.
My appreciation and thanks to the following people who have been very helpful and
for their great contributions in the accomplishment of the study:
z
Mr. Tan Chow Beng, Mr. Zuraimi bin Mohd. Sultan, and Mr. Siew Hock
Meng for their assistance in the preparation of the experiments.
z
Ms Leow Hwee Ching, Ms Lai Yinghui, Mr Lee Chong Leong and Ms Ng
Yi Yu for their assistance in the data process and analysis.
z
All the lecturers who have shared their invaluable knowledge and experience
in the Building Science program.
Finally, thanks to my friends whom I have been working with throughout the period of
study in the National University of Singapore.
TABLE OF CONTENTS
SUMMARY................................................................................................................... vi
List of Tables ...............................................................................................................viii
List of Figures ................................................................................................................ ix
CHAPTER 1
INTRODUCTION .............................................................................. 1
1.1
Background ................................................................................................ 1
1.2
Objectives and scope of research............................................................... 3
1.3
Outline of dissertation................................................................................ 4
CHAPTER 2
LITERATURE REVIEW ................................................................... 5
2.1
Introduction................................................................................................ 5
2.2
Gradients in occupied space....................................................................... 6
2.2.1
Temperature gradient .......................................................................... 6
2.2.2
Concentration gradient........................................................................ 7
2.2.3
Humidity gradient ............................................................................... 9
2.3
Thermal comfort ...................................................................................... 10
2.3.1
Standards on thermal comfort........................................................... 11
2.3.3.1
Indices (ISO 7730, 1994) .................................................... 11
2.3.3.1.1
Predicted mean vote (PMV)......................................... 11
2.3.3.1.2
Predicted percentage of dissatisfied (PPD).................. 11
2.3.3.1.3
Draft rating (DR).......................................................... 12
2.3.3.2
Criteria in various standards ............................................... 12
2.3.2
Findings of previous research ........................................................... 13
2.3.2.1
Thermal comfort studies on displacement ventilation system
............................................................................................. 13
2.3.2.2
Tropical area thermal comfort studies ................................ 14
2.4
Indoor air quality...................................................................................... 16
2.4.1
Concentration distribution ......................................................... 16
2.4.2
Age of air ................................................................................... 17
2.4.3
Ventilation effectiveness............................................................ 18
2.5
Energy ...................................................................................................... 19
2.6
Conclusions and hypotheses .................................................................... 21
2.6.1
Conclusions....................................................................................... 21
2.6.2
Hypotheses........................................................................................ 22
CHAPTER 3
PRELIMINARY STUDY ................................................................. 23
3.1
Methodology ............................................................................................ 23
3.1.1
Research design ................................................................................ 23
3.1.1.1
Group 1 ............................................................................... 24
3.1.1.2
Group 2 ............................................................................... 25
3.1.1.3
Group 3 ............................................................................... 26
3.1.2
Methods of data collection................................................................ 27
3.1.2.1
Subjective assessment......................................................... 27
3.1.2.1.1
Subjects ........................................................................ 27
3.1.2.1.2
Subjective assessment protocol.................................... 28
3.1.2.1.3
Questionnaire ............................................................... 29
3.1.2.2
Objective measurement protocol ........................................ 29
3.1.2.2.1
Objective parameters ................................................... 29
3.1.2.2.2
Instrumentation ............................................................ 30
3.1.2.2.2.1 Thermal chamber .................................................. 30
3.1.2.2.2.2 Instruments............................................................ 32
ii
3.1.2.2.3
Measuring locations ..................................................... 34
3.1.2.2.4
Measurement procedure............................................... 35
3.1.3
Data collection and processing ......................................................... 36
3.1.3.1
Objective data ..................................................................... 36
3.1.3.2
Subjective data .................................................................... 37
3.1.4
Method of data analysis .................................................................... 37
3.2
Results and discussion ............................................................................. 39
3.2.1
Gradients ........................................................................................... 39
3.2.1.1
Temperature gradient .......................................................... 39
3.2.1.1.1
General description ...................................................... 39
3.2.1.1.2
Effect of different supply air temperature and flow rate
with the same room air temperature (Group 1)................................. 40
3.2.1.1.3
Effect of different supply air temperature and flow rate
with different room air temperature (Group 2) ................................. 41
3.2.1.2
Humidity gradient ............................................................... 42
3.2.1.2.1
Effect of different supply air temperature and flow rate
with the same room air temperature (Group 1)................................. 42
3.2.1.2.2
Effect of different supply air temperature and flow rate
with different room air temperature (Group 2) ................................. 43
3.2.1.3
Concentration gradient of carbon dioxide........................... 44
3.2.1.3.1
Effect of flow rate with the same room air temperature
(Group 1) ...................................................................................... 44
3.2.1.3.2
Effect of flow rate with different room air temperature
(Group 2) ...................................................................................... 45
3.2.2
Thermal comfort ............................................................................... 45
3.2.2.1
Effect of different supply air temperature & relative
humidity on thermal comfort (Group 1) .................................................. 45
3.2.2.1.1
Overall Actual Mean Vote (AMV) and comfort
acceptability ...................................................................................... 45
3.2.2.1.2
Effect of different supply air temperature on thermal
comfort
...................................................................................... 47
3.2.2.1.3
Effect of distance from supply unit on thermal comfort..
...................................................................................... 48
3.2.2.1.4
Effect of vertical temperature difference on local
thermal sensation .............................................................................. 48
3.2.2.2
Effect of different room air temperature on thermal comfort
(Group 2) ............................................................................................. 49
3.2.2.2.1
Overall AMV and comfort acceptability ..................... 49
3.2.2.2.2
Effect of vertical temperature gradient on local thermal
comfort
...................................................................................... 51
3.2.2.2.3
Effect of distance from supply unit on thermal comfort..
...................................................................................... 51
3.2.2.3
Comparison of DV with MV (Group 3) ............................. 52
3.2.2.3.1
AMV and comfort acceptability .................................. 52
3.2.2.3.2
Neutral temperature ..................................................... 54
3.2.2.3.3
Local thermal comfort.................................................. 55
3.2.2.4
Application of ISO 7730 ..................................................... 55
CHAPTER 4
CONFIRMATION STUDY.............................................................. 57
4.1.
Methodology ............................................................................................ 57
4.1.1
Research design ................................................................................ 57
iii
4.1.1.1
Group 1 ............................................................................... 57
4.1.1.2
Group 2 ............................................................................... 58
4.1.1.3
Group 3 ............................................................................... 59
4.1.2
Methods of data collection................................................................ 59
4.1.2.1
Subjective assessment......................................................... 59
4.1.2.1.1
Subjects ........................................................................ 59
4.1.2.1.2
Subjective assessment protocol.................................... 60
4.1.2.1.3
Questionnaire ............................................................... 60
4.1.2.2
Objective measurement protocol ........................................ 60
4.1.2.2.1
Objective parameters ................................................... 60
4.1.2.2.2
Instrumentation ............................................................ 61
4.1.2.2.2.1 Thermal chamber .................................................. 61
4.1.2.2.2.2 Instruments............................................................ 62
4.1.2.2.3
Measuring locations ..................................................... 62
4.1.3
Data collection and analysis.............................................................. 64
4.1.3.1
Objective data ..................................................................... 64
4.1.3.2
Subjective data .................................................................... 64
4.1.4
Method of data analysis .................................................................... 64
4.2
Results and discussion ............................................................................. 65
4.2.1
Gradients ........................................................................................... 65
4.2.1.1
Temperature gradient .......................................................... 65
4.2.1.1.1
Effect of different supply air temperature and flow rate
with the same room air temperature and humidity (Group 1) .......... 65
4.2.1.1.2
Comparison between DV and MV (Group 3).............. 66
4.2.1.2
Humidity gradient ............................................................... 67
4.2.1.2.1
Effect of different supply humidity ratio with the same
room air temperature (Group 2) ........................................................ 67
4.2.1.2.2
Comparison between DV and MV (Group 3).............. 68
4.2.1.3
Concentration gradient........................................................ 70
4.2.1.3.1
Effect of different supply air temperature and flow rate
with the same room air temperature and humidity (Group 1) .......... 70
4.2.1.3.2
Comparison between DV and MV (Group 3).............. 71
4.2.2
Thermal comfort ............................................................................... 72
4.2.2.1
Effect of different supply air temperature & flow rate on
thermal comfort (Group 1)....................................................................... 72
4.2.2.1.1
Overall Actual Mean Vote (AMV) and comfort
acceptability ...................................................................................... 72
4.2.2.1.2
Local thermal comfort.................................................. 74
4.2.2.1.3
Draft ............................................................................. 75
4.2.2.1.4
Effect of distance from supply unit on thermal comfort..
...................................................................................... 77
4.2.2.2
Effect of different humidity levels on thermal comfort
(Group 2) ............................................................................................. 78
4.2.2.2.1
Overall Actual Mean Vote (AMV) and comfort
acceptability ...................................................................................... 78
4.2.2.2.2
Local thermal comfort.................................................. 79
4.2.2.3
Comparison of DV with MV (Group 3) ............................. 80
4.2.2.3.1
Overall AMV and comfort acceptability ..................... 80
4.2.2.3.2
Local thermal comfort.................................................. 81
4.2.2.3.3
Draft risk ...................................................................... 82
iv
4.2.3
Energy ............................................................................................... 85
4.2.3.1
Comparison between DV and MV...................................... 85
4.2.3.1.1
Experiment conditions, system and conditioning process
...................................................................................... 85
4.2.3.1.2
Energy consumption analysis ...................................... 86
4.2.3.2
Effect of different supply air temperature on energy
consumption ............................................................................................. 88
4.2.3.2.1
Experimental conditions, system and conditioning
process
...................................................................................... 88
4.2.3.2.2
Energy consumption analysis ...................................... 88
4.2.4
Preliminary design guide .................................................................. 89
4.2.4.1
Model .................................................................................. 89
4.2.4.2
Application of the model .................................................... 91
4.2.4.3
Design procedure: ............................................................... 92
CHAPTER 5
CONCLUSIONS............................................................................... 93
5.1
Review and achievement of research objective ....................................... 93
5.2
Recommendation ..................................................................................... 98
BIBLIOGRAPHY....................................................................................................... 101
v
SUMMARY
Conventional mixing ventilation (MV) system is used widely in the hot and humid
country like Singapore. The nature of this system is to create a good mixture of the
room and supply air in order to provide a uniform thermal and air quality environment.
Hence every occupant in the same space will be exposed to similar level of pollutants
even though one is far away from the source of pollutant. However, if occupants are
exposed to harmful and/or excessively high concentration pollutants, they may fall ill
and this will lead to a decrease in productivity.
Displacement ventilation (DV) system can resolve this problem in a more energyefficient manner. However, research on displacement ventilation has been mainly
conducted in the Scandinavian countries. To date there is limited research done in the
tropics. Furthermore, as the climate and building loads in this area are different from
those in the Scandinavian countries, the results of such research may not be applicable
in Singapore. It is therefore of great importance to conduct research to assess its
viability in the Tropics. The results and findings would be valuable to local
practitioners when adopting the DV system in Singapore. The results and findings
would be valuable to researchers who are interested to carry out this area of study in
the tropics.
It is found that temperature gradient, humidity gradient and CO2 concentration gradient
exist in all experiments of this study. The profile of the gradient depends on the supply
air flow rate and/or outdoor air flow rate. Results show that supply air temperature,
room air temperature and relative humidity have significant influence on subjects’
thermal sensation, but not on subjects’ acceptability ratings.
vi
Generally subjects have cooler thermal sensation and lower acceptability with DV
system than with MV system. Occupants in an environment served by DV system have
1 ºC higher neutral temperature as compared to the MV system. With proper design,
DV system may have lower draft risk as compared to the MV system.
CO2 concentration gradient can be found in space served by DV system. The
concentration of CO2 at the height of 1.1m and below is always lower than in a space
served by the MV system, under the same condition. Hence, the ventilation efficiency
is always higher for DV system than for MV system.
When conditions for both systems are the same, the cooling capacity for DV system is
5% lower than that for MV system. In addition, with the presence of temperature and
concentration gradients, the energy consumption of the DV system could be further
reduced.
A model, which computes the supply-return air temperature difference is developed
based on the experimental results. This model simplifies the computation of the supply
air flow rate that is needed in the design of the displacement ventilation system for
buildings with ceiling heights of about 2.6m in the tropics.
vii
List of Tables
Table 2.1 The criteria stated in different standards................................................ 12
Table 3.1 Test conditions for Group 1. .................................................................. 25
Table 3.2 Test conditions for Group 2. .................................................................. 26
Table 3.3 Test conditions for Group 3. .................................................................. 27
Table 3.4 Instrumentations..................................................................................... 32
Table 3.5 Average clo value, overall AMV and average comfort acceptability.... 46
(Group 1 DV)......................................................................................................... 46
Table 3.6 Mean thermal sensation and comfort acceptability at the workstation
closest to the supply unit (Group 1 DV) ......................................................... 47
Table 3.7 Mean thermal sensation and comfort acceptability between workstations
nearest and furthest from the supply unit (Group 1 DV) ................................ 48
Table 3.8 Average clo value, overall AMV and average comfort acceptability
(Group 2 DV).................................................................................................. 50
Table 3.9 Mean thermal sensation and comfort acceptability between workstations
nearest and furthest from the supply unit (Group 2 DV) ................................ 51
Table 3.10 Average clo value and AMV (Group 3) .............................................. 53
Table 4.1 Test conditions for Group 1. .................................................................. 58
Table 4.2 Test conditions for Group 2. .................................................................. 58
Table 4.3 Test conditions for Group 3. .................................................................. 59
Table 4.4 Average clo value, overall AMV and average comfort acceptability
(Group 1)......................................................................................................... 73
Table 4.5 Mean thermal sensation and comfort acceptability between workstations
closer and further from the supply unit (Group 1 DV) ................................... 77
Table 4.6 Average clo value, overall AMV and average comfort acceptability
(Group 2)......................................................................................................... 78
Table 4.7 Average clo value, overall AMV and average comfort acceptability
(Group 3)......................................................................................................... 81
Table 4.8 Experiment conditions for Group 3. ...................................................... 85
Table 4.9 Experiment conditions. .......................................................................... 88
viii
List of Figures
Figure 2.1 Sketch of displacement ventilation......................................................... 6
Figure 2.2 Temperature gradients in a thermal chamber with different cooling
loads. ................................................................................................................. 7
Figure 2.3 The CO2 concentration gradients at various locations in a room. .......... 8
Figure 2.4 Relative humidity gradient and moisture ratio gradient with
displacement ventilation. .................................................................................. 9
Figure 3.1 Total approach employed in this research study. ................................. 24
Figure 3.2 Continuous scale used in the questionnaire.......................................... 29
Figure 3.3 Chamber layout. ................................................................................... 31
Figure 3.4 Floor-standing, low velocity, semi-circular supply unit....................... 31
Figure 3.5 Return grille.......................................................................................... 32
Figure 3.6 Supply diffuser. .................................................................................... 32
Figure 3.7 Portable RH sensor. .............................................................................. 33
Figure 3.8 Dew-point hygrometer.......................................................................... 33
Figure 3.9 Hood. .................................................................................................... 33
Figure 3.10 Photoacoustic spectrometer multi-gas analyser.................................. 33
Figure 3.12 Plan view of measuring points. .......................................................... 35
Figure 3.13 Typical temperature gradient (1). ....................................................... 40
Figure 3.14 Typical temperature gradient (2). ....................................................... 40
Figure 3.15 Temperature gradients (Group 1). ...................................................... 41
Figure 3.16 Temperature gradients (Group 2). ...................................................... 41
Figure 3.17 Humidity gradients (Group 1). ........................................................... 42
Figure 3.18 Humidity gradients (Group 2). ........................................................... 44
Figure 3.19 Carbon dioxide gradients (Group 1)................................................... 44
Figure 3.20 Carbon dioxide gradients (Group 2)................................................... 45
Figure 3.21 Body parts’ thermal sensation (Group 1 DV)..................................... 49
Figure 3.22 Body parts’ thermal sensation (Group 2 DV)..................................... 51
Figure 3.23 Thermal comfort unacceptability (Group 3)....................................... 54
Figure 3.24 Neutral temperatures for DV and MV system (Group 3)................... 54
Figure 3.25 Body parts’ thermal sensation for DV and MV cases (Group 3) ....... 55
Figure 4.1 Chamber layout .................................................................................... 61
Figure 4.2 Plan view of measuring points. ............................................................ 63
Figure 4.3 Temperature gradients (Group 1). ........................................................ 65
Figure 4.4 Temperature profiles (Group 3)............................................................ 67
Figure 4.5 Humidity gradients (Group 2). ............................................................. 68
Figure 4.6 Humidity gradients (Group 3). ............................................................. 69
Figure 4.7 CO2 gradients (Group 1)....................................................................... 70
Figure 4.8 CO2 gradients (Group 3)....................................................................... 71
Figure 4.9 Body parts’ thermal sensation (Group 1 DV)....................................... 74
Figure 4.10 Draft at different heights (Group 1).................................................... 76
Figure 4.11 Body parts’ thermal sensation (Group 2 DV)..................................... 79
Figure 4.12 Body Parts’ Thermal Sensation (Group 3) ......................................... 81
Figure 4.13 Draft at different heights (Group 3).................................................... 83
Figure 4.14 System for both ventilation modes. .................................................... 85
Figure 4.15 Conditioning process on psychrometric chart. ................................... 87
Figure 4.16 Relationship between measured temperature (symbols) and predicted
temperature (lines). ......................................................................................... 91
ix
CCCHHHAAAPPPTTTEEERRR 111::: IIINNNTTTRRROOODDDUUUCCCTTTIIIOOONNN
CHAPTER 1
INTRODUCTION
1.1 Background
In a hot and humid country like Singapore, most of the commercial buildings are air
conditioned and mechanically ventilated. The mixing ventilation (MV) mode is the
most common air distribution technique used in Singapore. The nature of this
conventional system is to supply cool air, up to 12 ºC lower than the room air, at a
strong momentum from the ceiling-mounted diffusers above the occupied zone to
create a uniform thermal and pollutant’s concentration environment throughout the
space. This phenomenon is also called “dilution” whereby the heat or pollutants
generated by one person will be carried by air movement to the entire space. This
could cause problems to the other occupants in the same space when the pollutantmixed air is inhaled by them. This can lead to a decrease in productivity. If the
pollutant is harmful, the occupant can even fall ill. According to U.S. Environmental
Protection Agency’s report (1990) the cost to industry has been estimated to be in the
magnitude of tens of billions of dollars per year.
There is another type of system, based on displacement ventilation (DV) strategy, to
provide better air quality in a more energy-efficient way. This system was first applied
to the welding industry in the Scandinavian countries in 1978. Since then it has been
increasingly used. Recently, this system has become popular not only in industrial
facilities, but also in offices and other commercial spaces. In 1989 in the Nordic
countries, it was estimated that displacement ventilation accounted for a 50% market
1
CCCHHHAAAPPPTTTEEERRR 111::: IIINNNTTTRRROOODDDUUUCCCTTTIIIOOONNN
share in industrial application and 25% in office application. This system can provide
better air quality as it supplies cool air with low velocity near the floor level and
exhausts at the ceiling level. The air is then transported within the room by the rising
convection flows from the heat sources, e.g. human, PCs etc, which take the warm
contaminated air from the lower parts of the room to the upper parts. In this way, the
person who has not created any pollutants will not be bothered by the pollutants
created by others.
In comparison with the conventional mixing ventilation, displacement ventilation can
achieve considerably higher ventilation efficiency and is more energy-efficient.
However, research on displacement ventilation has been mainly conducted in the
Scandinavian countries. There is limited research done in the tropics. As the ethnic
groups and building loads in the tropics are not the same as those in Scandinavian
countries, the results of such research may not be directly applicable.
Moreover, in the tropics, due to the all-year-round hot and humid climate, there is high
recirculation of air for most of the Air conditioning Mechanical Ventilation (ACMV)
systems in order to save energy. The ratio of the return air to the total supply air could
range between 70% and 90%, depending on the types of building. DV system has to
comply with the energy-saving rule, i.e. 70% to 90% of the exhaust air needs to be
recirculated, if it is to be used in Singapore. However, 100% outside air can be used in
the Scandinavian countries for DV system due to their climatic condition. Hence, the
results of the research conducted in Scandinavian countries may not be applicable in
Singapore.
There is a growing trend of new buildings exploring the possibility of adopting new
air-conditioning technology in Singapore. The acceptance of new system can be
2
CCCHHHAAAPPPTTTEEERRR 111::: IIINNNTTTRRROOODDDUUUCCCTTTIIIOOONNN
difficult in the construction industry since the suitability of such systems is not
extensively investigated in the tropics. This can be detrimental during the operation of
building if it cannot perform or under-perform. Therefore, there is a need to assess the
feasibility and viability of displacement ventilation system in the tropics. It is therefore
of great importance to conduct research to assess its applicability in the Tropics.
The results and findings of this study will help local practitioners to create a
comfortable environment with suitable room air temperature, supply air temperature,
relative humidity and ∆T (temperature difference between head and feet level) for the
occupants. The findings of this study will serve as preliminary directions for future
research on DV system in the tropics. This will in turn help local practitioners and
ACMV system operators in creating and/or maintaining a comfortable indoor
environment economically.
1.2 Objectives and scope of research
The main objectives of the research study are:
a. To investigate the stratification effect of the wall supply displacement ventilation
system;
b. To investigate the thermal comfort and energy performances for the wall supply
displacement ventilation system;
c. To compare performance of the wall supply displacement ventilation system
against the conventional ceiling supply mixing ventilation system based on thermal
comfort, indoor air quality and energy; and
d. To develop a preliminary design guide that can be used for offices in the tropics.
3
CCCHHHAAAPPPTTTEEERRR 111::: IIINNNTTTRRROOODDDUUUCCCTTTIIIOOONNN
1.3 Outline of dissertation
This chapter states the background, the objectives and scope of work of this study. It is
intended to point out that, though indoor air quality issues have a large scope of
interest, this study would only focus on the basic aspects of indoor air quality, i.e.
concentration stratification and ventilation efficiency.
Chapter two introduces the fundamentals of displacement ventilation. This is
substantiated by past research findings. It is arranged in the following order:
temperature, pollutant’s concentration and humidity gradients; thermal comfort
fundamentals and research findings; and indoor air quality basics and research findings.
Chapter three presents the methodology and results of the preliminary study. The
methodology includes research design, detailed experimental conditions description,
methods of data collection and methods of data analysis. The results are presented in
two categories, namely gradients and thermal comfort.
Chapter four presents the methodology and results of the second study with a larger
sample size. This study is to confirm the results and findings of the preliminary study.
Therefore, the basic methodology adopted is the same as the preliminary study.
Chapter five summaries the concluding remarks following the data analysis and
discussion. A list of recommendations is ascertained from this study.
4
CCCHHHAAAPPPTTTEEERRR 222::: LLLIIITTTEEERRRAAATTTUUURRREEE RRREEEVVVIIIEEEWWW
CHAPTER 2
LITERATURE REVIEW
2.1 Introduction
Since displacement ventilation was first applied to the welding industry in 1978, it has
been gaining popularity in Scandinavia as a means of ventilation to provide good
indoor air quality (IAQ) and improve energy-efficiency not only for large spaces with
high ceilings, such as assembly halls, but also for offices and other commercial spaces
use. In 1989 in Nordic countries, it was estimated that displacement ventilation
accounted for a 50% market share in industrial applications and 25% in office
applications (Yuan, 1999b).
A typical displacement ventilation system provides cool air at a temperature several
degrees below room air temperature and at a very low velocity of less than 0.5 m/s
through large-area supply devices near the floor level and extracts air at the ceiling
level. The supply air spreads over the floor and then rises as it comes into contact with
heat sources, e.g. persons, computers, in the occupied space. The rising air above the
heat source is called a plume. Plumes carry heat and contaminants and entrain the
ambient air to the upper part of the room space. Thus the airflow rate of plumes
increases with height. The flow rate in the convection flow equals the supply air flow
rate at a certain height above the heat source. In order to feed the convection flow
above that height, the air in the upper part of the room is naturally recirculated. In this
way the air will be stratified with a lower zone of fresh cool air and an upper zone of
mixed and contaminated warm air. A schematic flow pattern is shown in Figure 2.1
(Yuan et al, 1998).
5
CCCHHHAAAPPPTTTEEERRR 222::: LLLIIITTTEEERRRAAATTTUUURRREEE RRREEEVVVIIIEEEWWW
This chapter will present the characteristics and mechanism of displacement
ventilation in detail, and some findings of previous research studies. They are
categorized into: 1) gradients; 2) thermal comfort; 3) indoor air quality; and 4) energy.
Figure 2.1 Sketch of displacement ventilation.
(Source: Yuan et al, 1998)
2.2 Gradients in occupied space
2.2.1
Temperature gradient
As mentioned earlier, the principle of displacement ventilation is a supply of cool air at
low velocity near the floor level and an exhaust at the ceiling level. The air is
transported within the room by the rising convection flow from the heat sources, which
take the heated air from the lower parts of the room into the upper parts. At a certain
height, the air stratifies, thus forming two parts: one with warm and less dense air in
the upper space and the other with cool and denser air in the lower space.
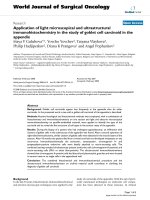
Figure 2.2 shows an example of the vertical temperature profile in a thermal chamber
with different cooling loads (Xu et al, 2001). It is observed that the temperature profile
could be separated into two regions: (1) steep temperature gradient (floor level to 1.0 -
6
CCCHHHAAAPPPTTTEEERRR 222::: LLLIIITTTEEERRRAAATTTUUURRREEE RRREEEVVVIIIEEEWWW
1.2m high), and (2) gentle temperature gradient (1.0-1.2m high to ceiling level) when
the indoor heat load exists.
These findings were consistent with those of the other researchers too. For example,
Yuan et al (1999) conducted both measurements and computational fluid dynamics
(CFD) modelling and found that the temperature gradient at the lower part would be
larger than at the upper part when most of the heat sources were in the lower part of
the room. Murakami et al (1998) analyzed both flow and temperature fields around a
modelled standing human body using CFD program and found that the gradient
became very steep between the feet and waist level.
Figure 2.2 Temperature gradients in a thermal chamber with different cooling loads.
(Source: Xu et al, 2001)
2.2.2 Concentration gradient
When the contaminant source is combined with the heat source (this is the usual case,
for example, human being generates not only heat, but CO2 and bioeffluent), the plume
will carry the contaminants over the heat source to the upper zone of the room. The
result is that the air in the upper zone will be polluted while the air in the lower zone is
as clean as the supply air. It is necessary to note that the important characteristic of
displacement ventilation system is the temperature stratification. It suppresses the
7
CCCHHHAAAPPPTTTEEERRR 222::: LLLIIITTTEEERRRAAATTTUUURRREEE RRREEEVVVIIIEEEWWW
vertical mixing of air and therefore, vertical concentration can be maintained. It should
also be noticed that, normally, the concentration in the upper part of the room is larger
than the average concentration, i.e. it is larger than the concentration that occurs in a
well mixed room.
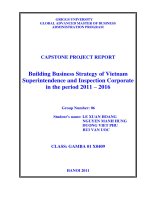
Figure 2.3 The CO2 concentration gradients at various locations in a room.
(a) concentration gradients (upper); (b) plan view of measuring locations (lower).
(Source: Xu et al, 2001)
An example of the concentration gradient is shown in Figure 2.3 (Xu et al, 2001)
where the non-dimensional concentration C* is plotted against the room height. The
C* is defined as C* = (Cp-Cs)/(Ce-Cs) where Cp is the CO2 concentration at point p
inside the room, Cs is CO2 concentration of supply air, and Ce is CO2 concentration of
8
CCCHHHAAAPPPTTTEEERRR 222::: LLLIIITTTEEERRRAAATTTUUURRREEE RRREEEVVVIIIEEEWWW
exhaust air. It shows that the steep concentration gradient occurs between 0.6~1.2m
and below 0.6m, the concentration is almost the same and much lower than that at the
upper zone (above 1.2m).
The results of Xu’s work were consistent with other studies, such as Yuan et al (1999a)
and Murakami et al (1998) where CFD modelling was used, and Yuan et al (1999c)
where measurements and CFD modelling were both employed. In all these studies, it
was found that the CO2 concentration in the lower zone was lower than that in the
upper zone.
2.2.3
Humidity gradient
Plumes not only carry heat and contaminants, they also carry moisture. It is a common
perception that relative humidity is constant throughout the whole space with
conventional mixing ventilation. Applying this assumption to a space with
displacement ventilation where air stratifies, having higher temperature and
contaminant concentration in the upper part of the room, one may conclude that
humidity also stratifies.
relative humidity gradient
20.0
20.0
15.0
15.0
Height, ft
Height, ft
moisture gradient
10.0
5.0
0.0
4.0
5.0
6.0
7.0
8.0
9.0
10.0
m oisture ratio of room air, lb/lb*1000
1/1 load
1/2 load
11.0
10.0
5.0
0.0
20%
30%
40%
50%
60%
room air relative hum idity %
1/1 load
1/2 load
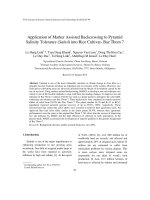
Figure 2.4 Relative humidity gradient and moisture ratio gradient with displacement
ventilation.
(Source: Kosonen et al, 2001)
9
CCCHHHAAAPPPTTTEEERRR 222::: LLLIIITTTEEERRRAAATTTUUURRREEE RRREEEVVVIIIEEEWWW
Figure 2.4 shows measurement data from field studies conducted in 1988 in a foodprocessing facility located in Finland (Kosonen et al, 2001). The measurement data is
presented for full load and half load. It was observed that both humidity ratio gradient
and relative humidity gradient existed.
2.3 Thermal comfort
Thermal comfort has been defined as "the condition of mind that expresses satisfaction
with the thermal environment" (ISO 7730, 1994). The reference to "mind" emphasized
that comfort is a psychological phenomenon. It is therefore often "measured" using
subjective methods—survey into man’s thermal sensation votes. Man’s thermal
sensation is mainly related to the thermal balance of their body as a whole. This
balance is influenced by his physical activity and clothing, as well as the
environmental parameters: air temperature, mean radiant temperature, air velocity and
air humidity. Moreover, man’s thermal sensation can also be influenced by factors
such as age, sex, body build, etc (Fanger, 1970). Over dozens of years, research on
man’s thermal comfort has been carried out throughout the world, but mainly in
mixing ventilation system. Recently, studies in displacement ventilation system have
been gaining popularity and large amounts of beneficial results have thus been
obtained. This section presents the criteria stipulated in thermal comfort standards.
Some findings from past research studies will also be presented in the latter portion of
this chapter.
10
CCCHHHAAAPPPTTTEEERRR 222::: LLLIIITTTEEERRRAAATTTUUURRREEE RRREEEVVVIIIEEEWWW
2.3.1
Standards on thermal comfort
2.3.3.1 Indices (ISO 7730, 1994)
2.3.3.1.1
Predicted mean vote (PMV)
The PMV is an index that predicts the mean value of the votes of a large group of
persons on the following 7-point thermal sensation scale:
+3
+2
+1
0
-1
-2
-3
Hot
Warm
Slightly Warm
Neutral
Slightly Cool
Cool
Cold
The PMV index can be predicted when the activity (metabolic rate) and the clothing
(thermal resistance) are estimated, and the following environmental parameters are
measured: air temperature, mean radiant temperature, relative humidity and partial
water vapour pressure.
2.3.3.1.2
Predicted percentage of dissatisfied (PPD)
The PMV index predicts the mean value of the thermal votes of a large group of
people exposed to the same environment. However individual votes are scattered
around this mean value and it is useful to predict the number of people likely to feel
uncomfortably warm or cool.
The PPD index establishes a quantitative prediction of the number of thermally
dissatisfied people. The PPD predicts the percentage of a large group of people likely
to feel too warm or cool, i.e. voting hot (+3), warm (+2), cool (-2), or cold (-3), on the
7-point thermal sensation scale.
11
CCCHHHAAAPPPTTTEEERRR 222::: LLLIIITTTEEERRRAAATTTUUURRREEE RRREEEVVVIIIEEEWWW
The PPD-index predicts the number of thermally dissatisfied person among a large
group of people. The rest of the group will feel thermally neutral, slightly warm, or
slightly cool.
2.3.3.1.3
Draft rating (DR)
Draft is an unwanted local cooling of the body caused by air movement. The draft
rating may be expressed as the percentage of people predicted to be bothered by draft.
The model of draft applies to people at light activity (mainly sedentary activity), with a
thermal sensation for the whole body close to neutral. The draft rating is also called the
percentage of dissatisfied due to draft, or PD.
2.3.3.2 Criteria in various standards
Table 2.1 The criteria stated in different standards.
Criteria
ASHRAE 55-1992
CP13&Guidelines
(Singapore)
80%
90%
(-0.5
15%
ISO 7730
Thermal environment acceptable
80%
Thermal sensations acceptable
90%
PMV
PPD
10%
DR (PD)
15%
Dissatisfied due to vertical temperature
5%
difference
5%
Dissatisfied due to radiant temperature
5%
asymmetry
Dissatisfied due to floor temperature
10%
5%
22.5-26 ºC at 20 ºC WB
To
23-26 ºC
23.5-27 ºC at 2 ºC DP
RH
30-70%
3 ºC (0.1-1.7m)
3 ºC (0.1-1.1m)
△T
-
22.5-25.5 ºC
≤70%
-
For comparison, Table 2.1 shows the criteria stated in different standards and
guidelines. It is observed that the ASHRAE Standard 55-1992 is more stringent as
12
CCCHHHAAAPPPTTTEEERRR 222::: LLLIIITTTEEERRRAAATTTUUURRREEE RRREEEVVVIIIEEEWWW
compared to ISO 7730 in terms of Dissatisfied due to vertical temperature difference
and radiant temperature asymmetry, Dissatisfied due to floor temperature, operative
temperature (To), relative humidity (RH) and temperature difference between floor
level and breathing level (△T). It is seen that the ASHRAE Standard 55-1992 and ISO
7730 are much more detailed than the local standard (CP13, 1999).
2.3.2
Findings of previous research
2.3.2.1 Thermal comfort studies on displacement ventilation system
Melikov and Nielsen (1989) evaluated the thermal comfort conditions in 18 spaces
ventilated by the displacement ventilation principle developed in Scandinavia. It was
found that PD>15% was identified for 33% of the measured locations within the
occupied zone and △t1.1-0.1>3 ºC for 40% of the locations. For 18% of the measured
locations within the occupied zone, PD>15% and △t1.1-0.1>3 ºC was registered.
However, the risk of discomfort due to draft and vertical temperature difference was
low in some of the investigated rooms. Hence, they concluded that when displacement
ventilation system is well designed, it is feasible to create good thermal comfort in
rooms.
Yuan et al (1999a) evaluated the performance of traditional displacement ventilation
systems for small offices, large offices with partitions, classrooms, and industrial
workshops under U.S. thermal and flow boundary conditions using CFD program. It
was found that generally, the air velocity was less than 0.2m/s, the temperature
difference between the head and foot level of a sedentary occupant was less than 2 ºC,
and draft rating (PD), predicted percentage of dissatisfied (PPD) were less than 15% in
the occupied zone, if the design used the guidelines shown in their paper. The PD and
13
CCCHHHAAAPPPTTTEEERRR 222::: LLLIIITTTEEERRRAAATTTUUURRREEE RRREEEVVVIIIEEEWWW
PPD were high in region very close to the diffuser (0.5m). Hence, it was concluded
that displacement ventilation could maintain a thermal comfortable environment.
Wyon and Sandberg (1990) used thermal manikin to predict discomfort due to DV
system. Serious local discomfort was identified, usually “too cold”, and most of it was
due to cold legs, ankles and feet. The results indicated Equivalent Homogeneous
Temperature (EHT) (WB) = 25.1°C for preferred whole-body condition. An optimum
sectional air temperature of 24.4°C was suggested for mean thermal sensation to be
‘neutral’ and a range 20.9°C < T < 28.0°C based on 80% acceptability criterion was
proposed.
Akimoto et al (1999) evaluated the performance of a floor-supply displacement airconditioning system in comparison to a DV system with a sidewall-mounted supply
unit and a ceiling-based distribution system. Thermal stratification was observed, as
there was a greater vertical air temperature difference in both of the displacement
system than in the ceiling-based system. A large vertical temperature difference that
may cause local thermal discomfort was observed in several cases for both of the
displacement systems. It was observed that the measured skin temperatures of the
thermal manikin with both of the displacement systems were slightly lower than those
of the ceiling-based system. However, this is not considered too low to cause local
thermal discomfort.
2.3.2.2 Tropical area thermal comfort studies
De Dear et al (1991) performed thermal comfort field experiments in Singapore.
Results of the air-conditioned sample indicated that office buildings were overcooled,
and one-third of their occupants experienced cool thermal comfort sensation. The
14
CCCHHHAAAPPPTTTEEERRR 222::: LLLIIITTTEEERRRAAATTTUUURRREEE RRREEEVVVIIIEEEWWW
observation in these air-conditioned buildings was broadly consistent with the ISO,
ASHRAE and local standards. PMV model’s predicted neutralities were all slightly
warmer than the empirically observed neutralities by approximately 1K.
Busch (1992) conducted a field study in Thailand to explore whether there was
justification for adopting a comfort standard that differs from those developed for
office workers accustomed to temperate climates. The neutral temperature was found
to be 24.7°C EHT for air-conditioned buildings. The author determined the
temperature limits of comfort zone for air-conditioned buildings – lower limit of the
comfort zone was about 22°C and the upper limit reached about 28°C. These limits
were broader than that stipulated by the standards.
Tan (1995) carried out field and chamber study to determine whether Singaporeans’
perception of thermal comfort differ from existing literature. The neutral temperature
was found to be 24.7°C which is slightly lower than 25.6°C that was found by Fanger.
The author also derived PMV-PPD characterization of Singaporeans and it was found
to be similar to Fanger’s PMV-PPD curve.
Cheong et al (2003) performed a thermal comfort study of an air-conditioned lecture
theatre in Singapore using CFD, objective and subjective measurements. It was found
that thermal conditions were within limits of thermal comfort standards but the
subjective responses were slightly biased towards the ‘cold’ section of the 7-point
thermal sensation scale and the occupants were slightly uncomfortable at a 23°C
environment. The calculated PMV and PPD were close to the subjective result.
15
CCCHHHAAAPPPTTTEEERRR 222::: LLLIIITTTEEERRRAAATTTUUURRREEE RRREEEVVVIIIEEEWWW
2.4 Indoor air quality
The concern about energy efficiency has increased since the 1970’s oil crisis. This
growing concern has led to many changes in the way buildings are constructed and
operated. The most conspicuous ones are the reduction in ventilation rate and increase
in air-tightness of buildings. In the age of rapid technology development, more and
more synthetic building materials are used to create a comfortable indoor environment.
These materials emit pollutants, such as formaldehyde, volatile organic compounds
(VOCs) etc. The reduction of the ventilation rate, coupled with these pollutants, can
accumulate gradually and finally reach a level at which they can have adverse effects
on the occupants’ health.
2.4.1
Concentration distribution
Concentration gradient does exist with displacement ventilation system as described in
Section 2.2.2 Concentration gradient. In the studies by Yuan et al (1999a), where CFD
modelling was used, and Yuan et al (1999c), where measurements and CFD modelling
were both employed, it was found that the CO2 concentration in the lower zone was
less than that in the upper zone. It was found that as the convective flow around a
human body brings the air at a lower zone to the breathing zone, the occupant actually
breathes air with lower concentration of contaminant than those at the nose level in the
middle of the room.
In Murakami’s study (1998) where CFD program was used, three cases of
concentration distribution prediction were carried out at different locations of
contaminant generation. It was found that the rising stream around the body surface
was not broken by the surrounding airflow. The air quality at the breathing zone
16