Application of GIS and remote sensing in flood management a case study of west bengal, india
Bạn đang xem bản rút gọn của tài liệu. Xem và tải ngay bản đầy đủ của tài liệu tại đây (7.89 MB, 176 trang )
APPLICATION OF GIS AND REMOTE SENSING
IN FLOOD MANAGEMENT: A CASE STUDY OF
WEST BENGAL, INDIA.
SANYAL JOY
(M. A., Jawaharlal Nehru University, New Delhi)
A THESIS SUBMITTED
FOR THE DEGREE OF MASTER OF SOCIAL SCIENCE
DEPARTMENT OF GEOGRAPHY
NATIONAL UNIVERSITY OF SINGAPORE
2004
ACKNOWLEDGEMENT
This research has been funded by National University of Singapore research grant
(Grant No.R-109-000-049-112). I gratefully acknowledge their support to this
research project. I would like to express my gratitude to the Irrigation Department of
West Bengal Government, India, for granting access to annual flood reports of the
state. I would also like to express my sincere appreciation to many people and friends
who have assisted in one way or other at various stages of this research.
I am deeply indebted to my supervisor Dr. Lu Xi Xi for his meticulous guidance,
stimulating suggestions, constant encouragement, patience and time spent on
discussion.
I would like to acknowledge Mr. Kamal Pal of Riddhi Management Pvt. Ltd. for
allowing me to use his company resources and unconditional support in all aspect my
field work in West Bengal, India.
I am also thankful to my friend Mr. Ang Kheng Siang, Mr. Huang Jingnan, Ms. Li
Luqian for their help and encouragement at all stages of my research.
I am also grateful to my parents, Mr. Gautam Poddar, Mr. Sabyasachi Basak and
Ms. Sagar Sikder. Their moral support has made it possible for me to complete this
thesis.
Joy Sanyal
August 9, 2004
i
TABLE OF CONTENTS
Page
ACKNOWLEDGEMENT........................................................................................... i
SUMMARY ................................................................................................................ iv
LIST OF TABLES ..................................................................................................... vi
LIST OF FIGURES .................................................................................................. vii
LIST OF PLATES ..................................................................................................... ix
Chapter 1: INTRODUCTION................................................................................... 1
1.1 Introduction..................................................................................................... 2
1.2 Aims and purpose of the study........................................................................ 5
1.3 Structure of the Thesis .................................................................................... 6
Chapter 2: STUDY AREA ......................................................................................... 8
2.1 Brief introduction............................................................................................ 9
2.2 Analysis of floods in Gangetic West Bengal ................................................ 14
2.3 Factors responsible for increasing flood hazard in West Bengal.................. 20
Chapter 3: APPLICATION OF REMOTE SENSING IN FLOOD
MANAGEMENT WITH SPECIAL REFERENCE TO MONSOON ASIA: A
REVIEW.................................................................................................................... 24
3.1 Introduction................................................................................................... 25
3.2 Remote sensing as a tool of flooded area delineation................................... 27
3.2.1 Application of optical remote sensing................................................ 27
3.2.2 Application of microwave remote sensing ......................................... 30
3.2.3 A combined approach ........................................................................ 34
3.3 Flood Hazard & Risk Mapping with GIS and Remote Sensing ................... 36
3.4 Some Issues of Remote Sensing Applications with Special Reference to
Monsoon Asia ..................................................................................................... 41
3.4.1 Dependency of digital elevation models in flood management ......... 41
3.4.2 Agricultural damage assessment ....................................................... 43
3.4.3 Problem of temporal resolution in flood management ...................... 46
3.5 Conclusion and Prospective.......................................................................... 48
Chapter 4: GIS BASED FLOOD HAZARD MAPPING ...................................... 50
4.1 Introduction................................................................................................... 51
4.2 Study focus.................................................................................................... 55
4.3 Flood hazard mapping at regional scale........................................................ 55
4.3.1 Mapping past flood experience.......................................................... 55
4.3.2 Variables used for hazard mapping................................................... 60
4.3.3 Weighting scheme and composite index ............................................ 62
4.4 Flood hazard mapping at sub-regional scale................................................. 66
4.4.1 Flood occurrence frequency mapping ............................................... 66
4.4.2 Variables used for hazard mapping................................................... 68
4.4.3 Ranking and composite hazard index ................................................ 69
4.5 Discussion ..................................................................................................... 75
4.6 Conclusion .................................................................................................... 76
ii
Chapter 5: REMOTE SENSING AND GIS BASED FLOOD VULNERABILITY
ASSESSMENT OF HUMAN SETTLEMENTS .................................................... 78
5.1 Introduction................................................................................................... 79
5.2 Focus Area .................................................................................................... 80
5.3 Data and Methods ......................................................................................... 83
5.3.1 Delineating non-flooded area from the flooded area ........................ 83
5.3.2 Delineating high flood depth zone ..................................................... 93
5.3.3 Delineating human settlements.......................................................... 97
5.3.4 Processing different data layers in a GIS environment ................... 100
5.4 Result and Discussion ................................................................................. 101
5.5 Conclusion .................................................................................................. 109
Chapter 6: OPTIMUM LOCATION FOR FLOOD SHELTER: A GIS
APPROACH............................................................................................................ 111
6.1 Introduction................................................................................................. 112
6.2 Study Focus................................................................................................. 113
6.3 Identification of flood prone settlements .................................................... 115
6.4 Flood shelter planning for preparedness and response ............................... 120
6.4.1 Location analysis of flood shelters .................................................. 121
6.4.2 Architecture of the GIS .................................................................... 124
6.5 Discussion ................................................................................................... 133
6.6 Conclusion .................................................................................................. 134
Chapter 7: CONCLUSION.................................................................................... 136
7.1 Achievements of the study.......................................................................... 137
7.2 Future prospect............................................................................................ 138
BIBLIOGRAPHY................................................................................................... 140
APPENDICES......................................................................................................... 155
Appendix 1........................................................................................................ 156
Appendix 2........................................................................................................ 158
iii
SUMMARY
Flood is a perpetual natural hazard in the deltaic part of the Ganges River in India.
This research is focussed on formulating some effective decision making tools for the
floodplain managers and local administrators in the Indian State of West Bengal.
Geo-Information Technology has been extensively used to come up with spatial
solution of this natural hazard. Apart from the first two chapters that deal with the
introduction and description of the study area the thesis is subdivided into four main
parts, as follows.
The first part presents a comprehensive literature review on the application of
remote sensing to flood management with particular reference to Southeast Asia. It
has been noted in this chapter that in majority of the scientific investigations flood
depth is considered crucial for flood hazard mapping and a digital elevation model
(DEM) is considered to be the most effective means to estimate flood depth from
remotely sensed or hydrological data. In a flat terrain, accuracy of flood depth
estimation depends primarily on the resolution of the DEM but flood estimation or
hazard mapping attempt in this region is handicapped by poor availability of high
resolution DEMs.
The second part is an effort to create meaningful flood hazard map for the flood
prone areas of West Bengal. The issue of developing a comprehensive hazard map
has been addressed in different scales. Administrative units have been chosen as the
element of investigation because any remedial development measure is likely to be
iv
implemented at this level. Flood hazard has been perceived as a combination of the
frequency of flood occurrence, potential number of affected people, and availability
of present infrastructure for evacuation and vulnerability of the community to a post
flood epidemic. End products of this chapter are number of maps that incorporate
different dimensions of flood hazard.
The third portion seeks to identify the rural settlements that are vulnerable to
floods of a given magnitude. Vulnerability of a rural settlement is perceived as a
function of two factors: presence of deep flood water in and around the settlement and
its proximity to an elevated area for temporary shelter during an extreme hydrological
event. Landsat ETM+ imagery acquired during the peak of a devastating flood has
been used to identify the non-flooded areas within the flooded zone. Particular effort
has been made to differentiate land from water under cloud shadow. A Geographical
Information System has been employed to combine information to identify various
settlements that are at different degree of flood risk.
The fourth part has combined cartographic and remotely sensed data to build a
Geo-Information technology based flood shelter planning for the Ajay River Basin of
West Bengal. A synthetic aperture radar (SAR) image, acquired during peak of
flooding in 1995, has been used to identify the flood-prone settlements. Distance
Tools in Arc/INFO and RDBMS have been extensively exploited to determine the
best possible location of flood shelters. The final product is a map showing the ideal
location for elevated concrete structures that can serve as flood shelters for the
vulnerable communities.
v
LIST OF TABLES
Table
Page
4.1
Comparison of actual flooded area and reported flooded area
of 6 blocks in Nadia District, 1998.
59
4.2
Source of various data used in the preparation of regional and
sub-regional level flood hazard mapping along with the variable
names used in various tables and main body of text.
61
4.3
Differential weighting (k) of standardized ‘flood-prone’ according
to varying flood occurrence frequency at regional scale.
64
4.4
Knowledge based flood hazard ranking of different indicators at a
sub-regional (village –level) scale.
69
5.1
Correction of non-flooded area under different level of processing.
89
5.2
Part of the attribute table illustrating how the intersection of
102
non-flooded layer with individual settlements is distributed in different
polygons.
5.3
Area of intersection between settlement layers and non-flooded area
is summarized on the basis of individual settlements.
103
5.4
Development block wise distribution of extremely flood vulnerable
settlements.
106
5.5
Precise locations of centroid of the settlements that are highly
vulnerable to flood.
107
6.1
A sample output of the Point-Distance Tool in Arc INFO.
Settlement IDs and distance figures are hypothetical.
125
vi
LIST OF FIGURES
Figure
Page
2.1.
Bhagirathi-Hoogly, Jalangi and Churni River Basins in
West Bengal, India.
9
2.2.
Landsat ETM+ Natural colour composite of April, 2003 showing
meandering rivers, ox-bow lakes and misfit channels in Lower
Ganga Basin, West Bengal, India.
11
2.3.
Relief map of Gangetic West Bengal showing three major
river basins.
12
2.4.
Population density of the study area.
14
2.5.
Probability plot illustrating agreement of annual maximum stage
data with lognormal distribution, River Jalangi,
Gauging Station: Swrupgunj, Nadia.
18
2.6.
Flood frequency analysis of river stage. Data is plotted in a
lognormal probability graph.
19
4.1.
Map showing the number of occasions each development
block has been subject to river flooding during the period of 1991
to 2000.
57
4.2.
Map showing actual flooded area vis-à-vis the total administrative
area of development blocks, part of Nadia District.
58
4.3.
Regional flood hazard map of Gangetic West Bengal.
65
4.4.
Map showing the number of occasions each revenue village
has been subject to river flooding during the period of 1991 to 2000.
67
4.5.
Transverse profiles drawn across River Jalangi to identify the
elevation that can survive a major monsoon flood.
71
vii
Figure
Page
4.6.
Revenue villages have been classified on the basis of their
highest elevation to indicate presence of potential flood shelters
in the sub-regional study area.
72
4.7.
Flood hazard map prepared by village-level sub-regional scale
study.
74
5.1.
Administrative boundary of the study area and the coverage
of Landsat ETM+ scenes.
81
5.2.
Landsat ETM+ false colour composite (zoomed 8 times from
optimum resolution) showing flooded area within a settlement.
85
5.3
False colour composite showing flooded and non-flooded
area under cloud shadow.
86
5.4.
Elevation distribution of the non-flooded area extracted from
ASTER DEM.
88
5.5.
Classified image showing flood boundary, 30th September, 2000.
91
5.6.
Different flood depth/turbidity zones identified over a
FCC (PC-2 PC-1 PC-3 as R G B).
93
5.7.
Elevation distribution of the area affected by high flood depth.
95
5.8.
Landsat ETM+ band 4 3 2 merged with ERS SAR image to
visually identify the rural settlements in Gangetic West Bengal.
98
5.9.
Location of the settlement that does not have access higher
ground as shelter during the flood in 30th September 2000.
104
6.1.
Location of the study area. Inset showing location of Ajay River
Basin in West Bengal,India.
113
6.2.
ERS-1 SAR scene showing flood situation in entire study area
during the peak of a major flood on 28th September, 1995.
118
6.3.
Schematic diagrams depicting different processing level for
the output INFO table for determining optimum location of
flood shelters.
127
viii
6.4.
Potential sites for building flood shelters and the settlements
served by them: Part of Ajay River Basin, West Bengal.
130
LIST OF PLATES
Plate
Page
2.1
Inundated area in Kandi Block, West Bengal in September 2000.
Source: Anandabazar Patrika, 23rd September, 2000.
15
2.2
Army had been called upon for rescue operation of flood victims
during September 2000 Flood in West Bengal, India.
Source: Anandabazar Patrika, 26th September, 2000.
16
6.1
Photograph of a flood shelter in CoxBazar, Bangladesh. The second
floor built on high pillars is designed to provide shelter to flood
affected people during emergency.
Source: />
121
ix
Chapter 1: INTRODUCTION
1
1.1 Introduction
Most of the natural disasters in the world take place in the developing countries and
especially in AsiaPacific, causing massive destruction and human suffering. Due to
its geographical setting and economic dependence on agriculture, India is especially
vulnerable to a number of natural hazards. Among all kind of natural hazards, floods
are probably the most devastating, widespread and frequent. In the humid tropical and
sub-tropical climates, especially in the realms of monsoon, river flooding is a
recurrent natural phenomenon. Excessive rainfall within a short duration of time very
often triggers flood in monsoon Asia. Monsoon river flooding not only causes huge
damage of crops and infrastructure but also leads to massive siltation of reservoirs.
This situation reduces capacity of the existing dams to store water and control floods.
West Bengal state in India is strongly influenced by the southwestern monsoon. The
deltaic part of West Bengal state, where 80% of annual precipitation is received in
four wet months from June to September, is traditionally identified as a flood-prone
area in India. The state has had flooding in 52 years out of the last 57 years since
independence of India in 1947 (Irrigation and Waterways Department, Govt. of West
Bengal, 2003).
Floodplain lands have always attracted people to settle because of the natural
abundance of water and its proximity to the river. However, early settlers took care to
selectively settle on the relatively higher ground in the floodplains. In West Bengal
this situation has changed over the years. With rapid growth of population
urbanization took place along the banks of Bhagirathi-Hoogly River and it triggered a
2
spontaneous growth of a range of activities such as, commercial, manufacturing and
residential. Even though low-lying, some portion of the floodplain in Gangetic West
Bengal eventually has become high value prime land.
Structural approaches for flood prevention have been quite popular throughout
the 1950s through 70s. It involves construction of dams, reservoirs and embankments
to prevent the over bank flow from reaching the nearby settlements. However, with
consistent experience of disasters across the world soon it was realized that this
approach has serious drawbacks. They are very cost intensive. They can protect
people normally from moderate floods but often fail to resist very high magnitude
events. Huge amounts of money are required to build an infrastructure that is capable
of protecting a very high return period event. Apart from the tangible shortcomings,
protection works create a false sense of security among the settlers that leads more
intensive land use in the flood-prone areas (Ansari, 2001).
Flood hazard mapping is one of the main components of a non-structural flood
management strategy. Hazard, risk and vulnerability are three interrelated concepts in
disaster management but they are not interchangeable terms. Hazard refers to the
likelihood and magnitude of a disaster occurrence while vulnerability is characterized
by the likely damage incurred in a hazardous area should a disaster strike. The risk of
a potential disaster depends on the likelihood and magnitude of occurrences of a
potentially damaging event, as well as the magnitude of damage. Therefore, risk can
be perceived as the product of hazard and vulnerability.
Although natural hazard management has been in the vision of Indian policy makers
3
for very long time it gained momentum only during the past decade after the General
Assembly of United Nations declared 1989-99 as the International Decade for Natural
Disaster Reduction (IDNDR). It has been increasingly realized that over the time the
negative impact of natural calamities over the national economy has been increasing.
It should be kept in mind that extreme hydrological events are natural phenomena and
it may not be possible to completely avoid the flood related disasters but planning
should be done in advance to minimize the loss of life and property if natural disaster
strikes an area. Remedial land use planning in the floodplain can facilitate effective
use of the land that is consistent with the overall development of the flood-prone
communities. It should be geared towards promoting the health and safety of the
existing vulnerable settlers of the flood-prone area. To achieve this goal various
aspects of the existing land use and the nature of the flood should be analyzed.
Natural hazard mapping is primarily centred upon the physical environment and
associated environmental processes, but human interventions like levee or dam
construction or land use also play an implicit role. Natural hazard models are either
inductive combination of hazard layers or deterministic models of associated physical
processes (Wadge et al, 1993). In recent years, a number of studies have recognized
the importance of estimating people’s vulnerability to natural hazards, rather than
retaining a narrow focus on the physical processes of the hazard itself (Mitchell,
1999; Hewitt, 1997; Varley, 1994). Cannon (2000) argues that natural disaster is a
function of both natural hazard and vulnerable people. He emphasizes the need to
understand the interaction between the hazard and people’s vulnerability.
4
Cova (1999) envisages that Geo-Information Technology can be utilized in
natural disaster management in 3 stages: mitigation, preparedness and response, and
recovery. GIS-based analytical modeling is the key in the mitigation phase. Important
elements of this stage are long-term assessment of hazard, planning, forecasting, and
management. In the preparedness and response stage, GIS is utilized to execute an
emergency response plan, whereas the recovery stage mainly consists of several
efforts to bring life to normal condition after any kind of natural disaster. GIS can
effectively reveal the inherent spatial variation in hazard, vulnerability and ultimately
the risk. The primary focus of this study lies in mitigation. However, the issue of
preparedness and response has also been addressed in a less intensive manner.
1.2 Aims and purpose of the study
This research seeks to develop a group of methodologies to formulate some effective
decision making tools for the floodplain managers and local administrators in the
Indian State of West Bengal. It is argued all through the thesis that geographical
information science and remote sensing have enormous potential in planning
mitigation strategies for natural disasters, such as river flooding. This thesis
demonstrates that geo-spatial technology can provide efficient decision making tools
at a very competitive cost to combat floods. Although it is mentioned very often that
building a spatial database can be expensive for the developing countries we cannot
ignore the recent development in this branch of science and technology. It is
5
recognized that building a very high-resolution spatial database is an ambitious
planning for the data poor flood-prone countries of Asia. However, methodologies
can be developed to incorporate relevant non-spatial information with existing maps
to build a moderate resolution flood hazard spatial database. The study has addressed
the issue from the perspective of different scales to optimize the use of all available
spatial data for the study area. Resource constraints of a developing country have
been taken into consideration and special attention has been given to set up low cost
planning measures.
1.3 Structure of the Thesis
Apart from the first two chapters that deal with the introduction and description of
the study area the thesis is subdivided into four main parts. A comprehensive
literature review on the application of GIS and remote sensing to flood management
is followed by an effort to create meaningful flood hazard maps for the flood prone
areas of West Bengal. The review part addresses evolution of remote sensing
technology as a tool for devising cost effective flood management strategy. Special
attention has been paid to to the pros and cons of applying Geo-Information
Technology in the flat floodplains of Asia. It has been pointed out that the limited
availability of high-resolution terrain data and the sparse network of gauging stations
make it particularly difficult to apply western flood hazard assessment models in the
6
developing countries. The second portion incorporates human and infrastructure
aspects such as population density and the provision of safe drinking water in order to
account for different dimensions of flood related hazards. The third part deals with
application of satellite images for the detection of vulnerable settlements. In this
chapter a very high magnitude flood, occurred in 2000, has been studied to explore
how the location of individual settlements vis-à-vis the flood prone zone expose them
to different level of flood hazard. In the fourth part, a GIS based spatial model has
been built to optimize site selection for flood shelters. The concluding chapter
summarizes the achievement of this study and outlines further prospect in research
direction.
7
Chapter 2: STUDY AREA
8
2.1 Brief introduction
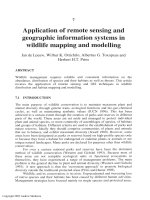
The study area of this investigation extends over three major river basins of southern
West Bengal, namely the Bhagirathi-Hoogly, Jalangi and Churni (Figure 2.1).
Swarupgunj
Gauging Station
Figure 2.1. Bhagirathi-Hoogly, Jalangi and Churni River Basins in West Bengal,
India. Administrative boundary of Development Blocks are shown. Inset showing
location of the study area in India.
All three rivers are distributaries of the main branch of Ganga River. Bhagirathi flows
southwards for 560 km through the alluvial plains of West Bengal and discharges in
Bay of Bengal. The river follows a lithological weakness, formed by the contact of
Chota Nagpur sediments in the west and typical deltaic sediments in the east. During
9
the delta building operation for the last two centuries the Ganga migrated easterly
from the river Bhagirathi to the river Padma. Due to sedimentation and subsidence of
Central Bengal and the easterly migration of the main flow of Ganga, a series of
intermediate distributaries such as Jalangi, Churni, Bhairab were opened (Rudra,
1987). This process led to the decay of Bhagirathi River.
The lower Ganga valley has been formed by enormous deposition of Tertiary and
Quaternary sediments brought down by the Ganga, Brahmaputra and other smaller
rivers of the Chota Nagpur Plateau. Patches of reddish ferralitic-laterite surface
occasionally interrupt the grey alluvial surfaces of Gangetic West Bengal. Origin of
these surfaces has been explained by variety of mechanisms: the most acceptable
view envisages that these older deposits are remnants of Pleistocene deposits formed
by the fluctuation of sea level (La Touche, 1919; Rizvi, 1957).
Gangetic West Bengal is characterized by a vast fertile alluvial landscape,
patches of lateritic deposits, numerous rivers, and abandoned channels. Meander
loops, cut-offs, swamps and littoral tracts with creeks, and cross channels are widely
found geomorphic features of this region (Figure 2.2). According to Bagchi’s (1945)
sub-regional classification of the Bengal Delta, the study area is identified as a
moribund delta. In this section of the delta, the rivers are decaying and the land
building process has entirely ceased. Due to its comparatively higher elevation and
high levees, this area is traditionally less flood-prone than the area that lies further
south. The area falling
10
Figure: 2.2. Landsat ETM+ Natural colour composite of April, 2003 showing
meandering rivers, ox-bow lakes and misfit channels in Lower Ganga Basin, West
Bengal, India
between the Bhagirathi and the Jalangi Rivers is an elongated depression and the
Churni Basin area is almost entirely low-lying in comparison to rest of the Gangetic
11
West Bengal. Therefore, this zone is liable to flooding. In the Nadia and Hoogly
districts, this belt is bounded by the 10 m contour lines. Figure 2.3 clearly depicts the
existence of vast low-lying flood prone areas at the southeastern portion of the study
area.
RELIEF
Three River Basins of Gangetic West Bengal
±
Jalangi
Bhagirathi-Hoogly
Churni
Location of Study Area
HEIGHT IN METRE (ASL)
26 and above
21 - 25
16 - 20
11 - 15
75
0
75 Kilometers
6 - 10
1-5
Figure: 2.3. Relief map of Gangetic West Bengal showing three major river basins.
The elevation is derived from Global 30 Arc Second Elevation Model (GTOP30) of
United States Geological Survey.
Interfluves of the numerous distributaries are ill drained (Spate, 1965) and very often
cause water logging during the monsoon season. This situation ultimately led to
12
stagnation of water and development of cut-off channels known as bills. Although the
rivers are bounded by levees still their gradient is very gentle from middle course to
river mouth. Consequently extent of marshes is increasing and during heavy
precipitation the marshes encroach adjacent flood plains beyond their normal limits.
There is a marked distinction in the channel pattern of the streams lying east and west
of Bhagirathi River. Sinuosity indices of the rivers in the eastern side of Bhagirathi
River are very high compared to the West (Goswami, 1983). The overall
geomorphology of the study area depicts a degenerating fluvial system.
Ganga Delta is world’s one of the most densely populated regions. Highly fertile
alluvial soil, abundance of water and mild climate have been attracting people for
centuries to settle here. The three river basins are overwhelmingly rural with
agriculture as the main source of livelihood. Currently, Development Block wise
population density in the study area varies from 385 to 3846 persons per Km 2.
Figure 2.4 depicts the overall distribution of population in the study area. Population
density is quite high in the eastern and southern portion of the area. Proximity to
Kolkata urban mass is the main cause of increasing population density in the south
while very high productivity of land and multiple cropping explains above average
population density in the eastern section. A couple of isolated development blocks in
the north also exhibits high population density due to its existence of moderate urban
centers in those blocks.
13
Figure 2.4. Population density of the study area. Source of data: Census of India,
2001
2.2 Analysis of floods in Gangetic West Bengal
Due to its geographical location at the tail end of the extensive Ganga Basin, West
Bengal has a very limited capacity to control extremely hydrological events resulting
from the upper catchment of the River Ganga and its tributaries. Most of the floods in
14
West Bengal are attributable to strengthening of monsoon weather over subhimalayan West Bengal due to westward movement of depression from the head of
the Bay of Bengal (Chatterjee and Bagchi, 1961). Exceptionally heavy rainfall over a
shorter period of time very often triggers a disastrous flood in West Bengal.
After the independence of India, 1956, 1959, 1978, 1995, 1999 and 2000 are
identified as years that received abnormally high precipitation and hence, severe
floods (Basu, 2001). The 2000 flood in September-October was the worst in terms of
its scale and damage caused. West Bengal Government estimated that a total of 171
blocks of the state (23,756 km2 ) was affected. Total loss was estimated to be 56,600
million Rupees (1,132 million US$) (Ganashakti, 2000). Severity of that event and
the hardship of the local people can be witnessed in Plate 2.1 and 2.2. Abnormally
high rainfall for four days in the upper catchment areas of the western tributaries of
Bhagirathi River was responsible for this natural calamity. The severity of the event
was so high that many low lying areas of Nadia district remained water-logged for
over three weeks with the depth of water estimated as high as 3 m (Rudra, 2001).
Plate 2.1 Inundated area in Kandi Block, West Bengal in September 2000.
Source: Anandabazar Patrika, 23rd September, 2000.
15