Application of time series analysis in modeling childhood epidemic diseases
Bạn đang xem bản rút gọn của tài liệu. Xem và tải ngay bản đầy đủ của tài liệu tại đây (1.29 MB, 72 trang )
APPLICATION OF TIME SERIES ANALYSIS IN
MODELING CHILDHOOD EPIDEMIC DISEASES
ZOU HUIXIAO
NATIONAL UNIVERSITY OF SINGAPORE
2005
APPLICATION OF TIME SERIES ANALYSIS IN
MODELING CHILDHOOD EPIDEMIC DISEASES
ZOU HUIXIAO
(B.Sc. South China University of Technology, China)
A THESIS SUBMITTED
FOR THE DEGREE OF MASTER OF SCIENCE
DEPARTMENT OF STATISTICS AND APPLIED PROBABILITY
NATIONAL UNIVERSITY OF SINGAPORE
2005
ACKNOWLEDGEMENTS
For the completion of this thesis, I would like very much to express my heartfelt
gratitude to my supervisor, Assistant Professor Xia Yingcun, for all his invaluable advice and guidance, endless patience, kindness and encouragement during the mentor
period in the Department of Statistics and Applied Probability of National University
of Singapore. I have learned many things from him, especially regarding academic research and character building. I truly appreciate all the time and effort he has spent in
helping me to solve the problems encountered even when he is in the midst of his work.
I also wish to express my sincere gratitude and appreciation to my other lecturers,
namely Professors Zhidong Bai, Zehua Chen, Loh Wei Liem for imparting knowledge
ii
Acknowledgements
iii
and techniques to me and their precious advice and help in my study.
It is a great pleasure to record my thanks to my dearest classmates: to Mr. Zhang
Hao, Mr. Zhao Yudong and Mr. Li Jianwei, who have given me much help in my study;
to Mr. Guan Junwei and Ms. Wang Yu, Ms. Qin Xuan, and Ms Peng Qiao, who have
colored my life in the past two years. Special thanks to all my friends who helped me in
one way or another and for their friendship and encouragement.
Finally, I would like to attribute the completion of this thesis to other members and
staff of the department for their help in various ways and providing such a pleasant
working environment, especially to Jerrica Chua for administrative matters.
Zou Huixiao
Aug 2005
Contents
Summary
Chapter 1
ix
Introduction
1
1.1
Literature Review . . . . . . . . . . . . . . . . . . . . . . . . . . . . .
1
1.2
Understanding Measles . . . . . . . . . . . . . . . . . . . . . . . . . .
5
1.3
Objective and Organization of the Thesis . . . . . . . . . . . . . . . . .
8
iv
Contents
Chapter 2
v
SIR Model and Measles Data
9
2.1
SIR Model in Epidemiology . . . . . . . . . . . . . . . . . . . . . . .
9
2.2
Mechanism of SEIR Model . . . . . . . . . . . . . . . . . . . . . . . .
11
2.3
Measles Data . . . . . . . . . . . . . . . . . . . . . . . . . . . . . . .
12
Chapter 3
3.1
3.2
3.3
Application of TSIR Model to Measles Data
17
Reconstruction of the Susceptible Dynamics . . . . . . . . . . . . . . .
20
3.1.1
Global Linear Regression . . . . . . . . . . . . . . . . . . . .
22
3.1.2
Local Linear Regression . . . . . . . . . . . . . . . . . . . . .
23
3.1.3
Bandwidth Selection for Local Linear Regression . . . . . . . .
24
3.1.4
Result of Local Linear Regression . . . . . . . . . . . . . . . .
27
Fitting the Transmission Equation . . . . . . . . . . . . . . . . . . . .
28
3.2.1
Estimation of Transmission Equation . . . . . . . . . . . . . .
28
3.2.2
Estimation Results of Transmission Equation . . . . . . . . . .
30
Monte Carlo Realization of the Dynamic System . . . . . . . . . . . .
34
vi
Contents
Chapter 4
Multi-step Ahead Estimation Method
37
4.1
Motivation of the Method . . . . . . . . . . . . . . . . . . . . . . . . .
37
4.2
Two Examples . . . . . . . . . . . . . . . . . . . . . . . . . . . . . . .
40
4.2.1
AR(k) Model . . . . . . . . . . . . . . . . . . . . . . . . . . .
41
4.2.2
TSIR Model . . . . . . . . . . . . . . . . . . . . . . . . . . .
42
Application to the Measles Data . . . . . . . . . . . . . . . . . . . . .
44
4.3
Chapter 5
Discussion
47
5.1
The Role of Births . . . . . . . . . . . . . . . . . . . . . . . . . . . .
47
5.2
Conclusion . . . . . . . . . . . . . . . . . . . . . . . . . . . . . . . .
54
Reference
58
List of Figures
Figure 2.1
Underlying mechanism of dynamic system . . . . . . . . . . . .
10
Figure 2.2
Flow chart of SEIR compartmental model . . . . . . . . . . . .
11
Figure 2.3
Time series plot of weekly measles for the aggregated data . . .
13
Figure 2.4
Time series plots of measles data and births for London city . .
14
Figure 2.5
Time series plot of biweekly measles data for each year . . . . .
15
Figure 3.1
Residuals of global linear regression for London measles . . . .
22
vii
viii
List of Figures
Figure 3.2
SSE1 and SSE2 for different bandwidth k . . . . . . . . . . . .
26
Figure 3.3
Residuals of local linear regression for London measles . . . . .
27
Figure 3.4
Estimated seasonal pattern of the transmission parameters . . . .
33
Figure 3.5
One-step ahead predictions . . . . . . . . . . . . . . . . . . . .
34
Figure 3.6
Simulations of the deterministic skeleton . . . . . . . . . . . . .
35
Figure 3.7
Simulations of the stochastic skeleton . . . . . . . . . . . . . .
35
Figure 4.1
Simulation results from AR(3) model . . . . . . . . . . . . . .
42
Figure 4.2
Simulation results from SIR model . . . . . . . . . . . . . . . .
44
Figure 4.3
Simulations of multi-step ahead estimation method for TSIR model 45
Figure 5.1
Bifurcation diagram for the deterministic skeleton . . . . . . . .
49
Figure 5.2
Bifurcation diagram for the stochastic skeleton . . . . . . . . .
50
Figure 5.3
Plots for low relative birthrate . . . . . . . . . . . . . . . . . .
53
Figure 5.4
Plots for medium relative birthrate . . . . . . . . . . . . . . . .
53
Figure 5.5
Plots for high relative birthrate . . . . . . . . . . . . . . . . . .
53
SUMMARY
In this paper,we aim to discuss the time series-susceptible-infected-recovered (TSIR)
model which bridges the gap between the theoretical models in epidemics and the discrete time series data. Using the measles data of London from 1944 to 1960 as a casestudy, we induce a simple linear relationship between the cumulative births and the cumulative reporting cases, and hence reconstruct the unobserved susceptible class from
the births and reporting infected cases. The simulation result traces the observed data
remarkably well, and captures both the annual and biennial patterns in the observed
cyclicity.
In order to improve the accuracy of the estimation, we also discuss the multi-step
ix
x
Summary
ahead estimation method, which evaluates the good-of-fitness from the viewpoint of
auto-correlation function (ACF). Finally we study the role of the births using birth-rate
as a bifurcation parameter, which qualitatively explains the episode of annual cyclicity
in the observed data corresponding to a high birth rate around 1947.
Chapter
1
Introduction
1.1
Literature Review
Due to the synthesis of complex mathematical models, the search for the pattern of
dynamic systems in epidemics is very complicated. One of the problems that lie in the
study of dynamic systems is the lack of a reliable dataset. Measles, a common infectious
disease all round the world, has relatively simple natural history and ease of diagnosis.
Moreover it has prompted reliable case notification schemes in most of the developed
countries, hence the long-term and well-documented measles data from some big cities
provide a benchmark for the study of dynamic systems in epidemics.
1
2
Chapter 1. Introduction
Measles is a highly contagious virus found throughout the world. Before the advent of vaccination, measles was a major childhood killer in the developed countries.
After the introduction of vaccination in the late 1960s, the disease in some developed
countries, such as England and United States, has already been under control. Both average measles incidences and the relative amplitude and regularity of major epidemics
were reduced (Anderson and May [1991]; Bolker and Grenfell [1996]). However, it
is still a main disease that kills thousands of children each year in developing countries (Mclean and Anderson [1988a]). Fully understanding the transmission pattern of
measles is of great help to control the disease in those countries. Further more, as
the immigration of population has become a common phenomenon in today’s society, epidemics have become a significant public health problem in developed countries
(Morse et al. [1994]). Hence from a public health point of view, the study of measles
epidemics is very important and meaningful. Understanding its dynamic pattern can
help us to face the next advent of other epidemic diseases, such as SARS and influenza.
Lots of constructive researches have been done on the topics of the dynamic pattern
of measles. Among these rich research achievements, the susceptible-exposed-infectedrecovered (SEIR) model is the simplest way to descript the infection process of measles.
SEIR model is realistic mathematical model which models the infection process by a set
of four ordinary differential equations. One of the fundamental mechanisms underlying
in the measles infected dynamics is the non-linearity, which is the result of the structure
1.1 Literature Review
of the contact process between susceptible and infected individuals (Anderson and May
[1991];Grenfell and Dobson [1995]). Another feature of measles infection is the heterogeneities in infection, for the hosts will immigrate frequently and aggregate according
to different social activities (Anderson and May [1991]). This is especially true for large
scale dynamics.
Since the dynamic system is very complex, many factors interact and influence the
behavior of the system. Measles data display a regular biennial pattern of major and
minor epidemics before the vaccination in England and Wales in the late 60’s, and the
transmission parameter varies seasonally for each year, coinciding with the schedule of
school terms (Fine and Clarkson [1982]).
Another key issue in dynamic system is the population size, which is the critical community size (CCS) that prevents extinction of measles in a community. Bartlett [1957]
concluded that the population size large enough to maintain transmission in epidemics
is about 250 000 inhabitants. He also categorized the CCS into three types behavior, and
the type I behaviors which are in large centers above CCS generally display a regular
biennial pattern.
Measles epidemics is a spatiotemporal data set, i.e. measles epidemics are not only
related to time, but also related to spatial effect. The external perturbations influence
the population’s long-term dynamic behavior, then as a result, influencing the spread
3
4
Chapter 1. Introduction
of measles disease. The metapopulation model (Bjørnstad et al. [2002]; Grenfell et al.
[2002]) included an explicit formulation for the spatial transmission rate, revealing that
the spatial transmission rates influenced the overall incidence and persistence of measles.
As we know measles is a disease that mainly occurs among children, the chance
that people got infected differs from different age group population, hence age-structure
should take into consideration when analyzing measles data. Assuming different contact
rates for different age group, and each of which is an independent SEIR dynamics, the
RAS (realistic age-structured) model captures the deterministic dynamics of measles
epidemics very well (Schenzle [1984];Keeling and Grenfell [1997]).
However the SEIR or RAS model are continuous dynamic systems, while the measles
data are discrete, it is difficult to develop a direct statistical link between measles time
series and the SEIR or RAS model. Based on a stochastic version of the SEIR model
(Fine and Clarkson [1982]), Finkenst¨adt and Grenfell [2000] introduced a time series
susceptible-infected-recovered (TSIR) model, using a discrete time epidemic model to
reconstruct the unobserved susceptible class. As births play an important role in the
measles epidemics, and the age-structure of the infected population is relatively little
known, Xia [2003] included the birth rate into the transmission parameters to see how
birth rate affects the measles epidemics.
1.2 Understanding Measles
Besides, an extensive search for non-linearity and chaos to explain the irregular pattern in measles dynamics has been addressed (Olsen and Schaffer [1990]; Ellner and Turchin
[1995]). And the semiparametric and nonparametric methods are also widely used in the
study of measles epidemics. In this thesis, TSIR model is used to analysis the London
measles epidemics, and a multi-step ahead estimation approach is proposed to improve
the accuracy of prediction.
1.2
Understanding Measles
Measles is a highly contagious virus found throughout the world. The virus enters
the body through the upper respiratory tract. Once becoming infected, a person will
develop fever, cough, runny nose, red and watery eyes in the near 10 to 12 days. The
characteristic measles rash begins 2 to 4 days after the onset of fever. The rash usually
begins on the face and over 2 to 3 days spreads to the trunk and abdomen, and finally
to the arms and legs. A person becomes contagious at the time the fever begins, and
remains contagious for 7 to 9 days after fever begins, or 4 to 5 days after the rash appears.
These symptoms last for one or two weeks. Other more serious symptoms such as
ear infections, pneumonia, or even encephalitis occur rarely. One or two out of 1000
children who get measles will die from it. However, a person who gets infected and
cured later will have lifelong immunity for measles.
5
6
Chapter 1. Introduction
Measles spreads quite easily from person to person. One uninfected person can get
measles from an infected person who coughs or sneezes around or even talks to the
uninfected one. For it is spread so easily that any child who is not immunized will
probably get it, either now or later in life. Before measles vaccine was available, nearly
all children had measles by the time they were 15 years old. An average of 400 000 cases
a year were reported in England and Wales in the period of 1944 to 1968 before the mass
vaccination was taken. And during this period over 300 people died from measles each
year. After the mass vaccination, the number of measles cases each year is just a fraction
of what it was then.
The diagnosis of measles is often made based on the signs and symptoms. The distinctive symptoms of measles make it ease for diagnosis. The most definitive method of
diagnosing measles is by either isolating the virus from the throat, or by a blood test for
antibodies.
Measles vaccine can be given by itself, but it is usually given together with mumps
and rubella in a shot called MMR. This shot is usually given between 12 and 15 months
of age in England and Wales. All three of these vaccines work very well, and will protect
most children for the rest of their lives. However, for about 5% of children the first dose
of MMR does not work. For that reason, a second does is recommended to give these
children another chance to become immune. Some doctors give this second dose when
the child enters primary schools. Others prefer to wait until the child enters middle or
1.2 Understanding Measles
junior high school. Sometimes usually during a measles outbreak, 3/4 children are given
measles or MMR vaccine before their first birthday. These children should be given
another dose of MMR at 12-15 months and then a third dose when it would normally be
given.
There are several reasons for some people might need to put off getting MMR vaccine, or not get the shot at all. Here are some reasons: (1) one is sick with something
more serious than a common cold; (2) one has ever had a life-threatening allergy problem after eating eggs; (3) one has had a serious allergy problem to an antibiotic called
neomycin; (4) one has any disease that makes it hard to fight infection, such as cancer,
leukemia, or lymphoma; (5) one is taking special cancer treatments such as x-rays or
drugs, or other drugs such as prednisone or steroids that make it hard for the body to
fight infection; (6) one has received gamma globulin during the last 3 months.
Measles data and other diseases such as smallpox and chickenpox, have been recorded
regularly (weekly or monthly) from the beginning of 20th century. After World War II,
the measles data were recorded in all areas even in small areas in the developed countries. Specifically, the data of measles were observed in 953 areas in England and Wales.
As a result, it provides a completed and rich data set for us to analyze the pattern of dynamic systems.
7
8
Chapter 1. Introduction
1.3
Objective and Organization of the Thesis
Based on the basic SEIR mechanism, we aim to fit a dynamic recursive relationship
to reconstruct the unobserved susceptible population, and to understand how birth rate
affects measles dynamics using the reconstructed susceptible population as a bridge. We
also proposed a multi-step estimation method to provide more reliable estimation of the
parameters.
The thesis is composed of five chapters. The first chapter is a review of some important research results on measles dynamics and the basic knowledge about measles
disease. The second chapter provides some basic knowledge of the fundamental SEIR
mechanism, and the measles statistics. Preliminary exploratory data analysis is conduct
to provide some basic ideas of the transmission pattern of measles epidemics. The third
chapter is to analyze the London measles data based on the TSIR model rules. A multistep estimation approach is discussed in the fourth chapter. And in the fifth chapter, the
role of births in the dynamic system will be discussed, and some further epidemiological
questions are also addressed.
Chapter
2
SIR Model and Measles Data
2.1
SIR Model in Epidemiology
For a dynamic system in epidemics, modern epidemiology or mathematical method
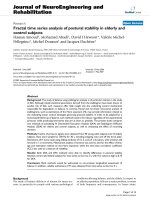
generally classifies the host population into four classes of individuals: susceptible, infected, recovered and immune. Figure 2.1 shows the dynamic interaction directly between parasitic and host populations in such a compartmental model.
Denote the number of the susceptible, the infected and the immune as X(t),Y (t) and
Z(t) respectively. In this diagram, hosts reproduce at a per capita rate a and die at a per
capita rate b. The infected hosts experience an additional death rate α, induced by the
parasite infection. The average durations of stay in the infected and immune classes are
9
10
Chapter 2. SIR Model and Measles Data
Birth
a
Susceptible
X(t)
a
a
β
Infected
ν
Y(t)
Z(t)
α+b
b
Death
Immuned
Death
b
Death
γ
Figure 2.1
Underlying mechanism of dynamic system
denoted as 1/ν and 1/γ respectively. The transmission coefficient which determines the
rate at which new infections arise as a result of contact between the susceptible and the
infected individuals is defined as β . Then the interaction can be expressed as a set of four
differential equations mathematically, which is the famous SIR model in epidemiology.
N(t) = X(t) +Y (t) + Z(t)
dX(t)
= aN(t) − [βY (t) + bX(t)]
dt
dY (t)
= βY (t)N(t) − (ν + b)X(t)
dt
dZ(t)
= νY (t) − bZ(t)
dt
As we all known, this SIR model cannot be solved analytically, one way to solve this
2.2 Mechanism of SEIR Model
11
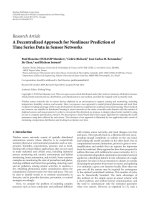
School
Birth
S
E
I
R
Figure 2.2 Flow chart of SEIR compartmental model: S, susceptible; E,
exposed; I, infected; R, recovered
problem is to conduct large amount of simulations by compute to help us to understand
the transmission pattern.
2.2
Mechanism of SEIR Model
The mechanism underlying the theoretical SEIR model (Anderson and May [1991])
is a simplified version of the above famous SIR model. Just shown in the Figure 2.2. The
population is divided into four different groups: susceptible (S), exposed (E), infected
(I) and recovered (R). Individuals become susceptible after birth, then gradually become
exposed and infected, finally recovered from the disease and leave the system. Some
diseases such as measles follow a lifelong immunization after recovering, hence these
individuals would leave the system forever. While other diseases such as influenza do
not follow a lifelong immunization, the recovered individuals might become susceptible
again after some time, and enter the dynamic system again.
12
Chapter 2. SIR Model and Measles Data
Using measles data as a case study, we make some assumptions for the SEIR model
in advance. Firstly, we reasonably ignore the number of individuals who die from other
reasons. This is because that measles is a disease that mainly affects young population,
and the number of dead at young age is relatively small. For a directly transmitted viral disease,such as measles,the contact process between individuals determines that the
transmission of infection between infectious and susceptible individuals is a non-linear
function. We also assume that the transmission rate varies with the school timetable,
since children gather together in school period, which leads to a high transmission
rate, whereas a lower transmission rate in the holiday period (Finkenst¨adt and Grenfell
[2000]).
2.3
Measles Data
We focus our analysis on the weekly notified measles cases in England and Wales.
Taken from the Registrar General’s Weekly Reports, we have totally 51 years measles
data from 1944 to 1995 in 354 areas of England and Wales. Figure 2.3 is the time series
plot of the aggregated measles data of 354 areas.
We can observe some pattern of measles epidemics from this plot. Before the measles
vaccine was available in England and Wales in 1968, about 40000 cases were being
reported annually with epidemic cycles every 2 to 3 years. It has a regular biennial
13
20000
10000
0
Weekly cases of measles
30000
40000
2.3 Measles Data
1950
1960
1970
1980
1990
year
Figure 2.3 Time series plot of weekly measles for the aggregated data of
354 areas in England and Wales from 1944 to 1995
cycle, alternating between major and minor epidemic years. After the introduction of
the vaccination, the reported measles cases were reduced by more than 98% with an
irregular epidemic cycle.
The meta-population model has revealed that spatial transmission rates influenced
the overall incidence and persistence of measles (Bjørnstad et al. [2002]). In order to
reduce the influence of spatial factors, we center our analysis on the London measles
data only in this paper. The clearest epidemic dynamics are before the onset of measles
vaccination in 1967, we therefore analyze the pre-vaccination data set from 1944 to
1964. Again, a regular biennial cycle could be seen in Figure 2.4, with an alternation
0 2000
5000
Chapter 2. SIR Model and Measles Data
Measles Cases
14
1955
year
1960
60000
1950
45000
Number of Births
1945
1945
1950
1955
1960
year
Figure 2.4 Time series plot of biweekly measles data (above) and yearly
births (below) for London city from 1944 to 1964
between major epidemic years and minor epidemic years. However, an annual pattern
could be seen in the period from 1945 to 1950, corresponding with the period of a high
birth rate in London (see bottom plot of Figure 2.4).
In the previous cross-sectional studies of measles data at the individual city level,
Finkenst¨adt and Grenfell [1998] have concluded that births play an important role in the
measles dynamics. Since infected people will have a lifelong immunity after recovered
from the diseases, these people leave the dynamic system forever. Subsequent epidemics
can occur only after susceptible populations are replenished by births or other infected
individuals immigrate into the area. Therefore in small cities with small population
size, measles epidemics are tend to fade out if no adequate replenishment of births.
While with high birth-rate, susceptible individuals are replenished timely after the major