Applying metaheuristics to feeder bus network design problem
Bạn đang xem bản rút gọn của tài liệu. Xem và tải ngay bản đầy đủ của tài liệu tại đây (654.93 KB, 137 trang )
APPLYING METAHEURISTICS TO
FEEDER BUS NETWORK DESIGN PROBLEM
KUAN SZE NEE
NATIONAL UNIVERSITY OF SINGAPORE
2003
APPLYING METAHEURISTICS TO
FEEDER BUS NETWORK DESIGN PROBLEM
KUAN SZE NEE
(B.Eng. (Hons.). NUS)
A THESIS SUBMITTED
FOR THE DEGREE OF MASTER OF ENGINEERING
DEPARTMENT OF INDUSTRIAL AND SYSTEMS ENGINEERING
NATIONAL UNIVERSITY OF SINGAPORE
2003
i
Acknowledgements
I would like to sincerely express my gratitude to my research supervisor, A/P Ong
Hoon Liong, for his guidance throughout the course of my research in the past two
years. He has generously imparted his valuable knowledge of optimization and
programming techniques to me and has patiently guided me to competency. Without
his support and encouragement, I would not been able to achieve this far.
I would also like to thank the following people who have helped me a lot in various
ways to the success completion of this thesis: Teng Suyan, Liu Shubin, Zhang Caiwen,
Tan Yan Ping, Cheong Wee Tat, all students in Ergonomics Lab, and all friends in the
Industrial and Systems Engineering Department in NUS.
Lastly, I would also like to thank my family and friends for their encouragement and
support to complete this degree. I have certainly gained a lot of knowledge from this
course and acquainted with like-minded friends whom we shared life experience with.
ii
Table of contents
ACKNOWLEDGEMENTS
I
TABLE OF CONTENTS
II
SUMMARY
V
NOMENCLATURE
VII
LIST OF FIGURES
XI
LIST OF TABLES
XII
CHAPTER 1 INTRODUCTION
1
1.1
The Route Network Design Problem
1
1.2
Types of Route Network Design Problems
4
1.3
Problem Formulation
6
1.4
Research Scope
11
1.5
Organization of the Thesis
12
CHAPTER 2 LITERATURE REVIEW
2.1
Classification of Previous Approaches
13
13
2.2
Previous Works on Bus Network Design Problems
2.2.1
Analytic approach
2.2.2
Network approach
17
17
25
2.3
Previous Works on Feeder Bus Network Design Problems
2.3.1
Analytic approach
2.3.2
Network approach
31
31
35
2.4
Detailed Description of Previous Approaches to FBNDP
2.4.1
Route construction heuristics
2.4.2
Local search heuristics
37
38
42
2.5
44
Concluding Remarks
iii
CHAPTER 3 APPROACH TO SOLVING FBNDP
46
3.1
Generating the Initial Solution
46
3.2
The Metaheuristics Approach
47
3.3
Defining Neighbourhood Moves
48
3.4
Description of the Test Problems
3.4.1
The base problem
3.4.2
The randomly generated test problems
50
50
52
3.5
55
Concluding Remarks
CHAPTER 4 APPLYING SIMULATED ANNEALING TO FBNDP
56
4.1
General Description
4.1.1
Physical analogy
4.1.2
The metaheuristic
56
56
57
4.2
Proposed Method
59
4.3
Computational Results
62
4.4
Concluding Remarks
64
CHAPTER 5 APPLYING TABU SEARCH TO FBNDP
65
5.1
General Description
5.1.1
Basic TS
5.1.2
Search intensification
5.1.3
Search diversification
65
65
68
68
5.2
Proposed Method
69
5.3
Computational Results
72
5.4
Concluding Remarks
75
CHAPTER 6 APPLYING GENETIC ALGORITHM TO FBNDP
76
6.1
General Description
6.1.1
Biological analogy
6.1.2
The metaheuristic
76
76
77
6.2
Proposed Method
83
6.3
Computational Results
87
6.4
Concluding Remarks
89
iv
CHAPTER 7 APPLYING ANT COLONY OPTIMIZATION TO FBNDP
90
7.1
General Description
7.1.1
Biological analogy
7.1.2
The metaheuristic
7.1.3
Ant System (AS)
7.1.4
Ant System and its extensions
90
90
91
93
96
7.2
Proposed Method
98
7.3
Computational Results
102
7.4
Concluding Remarks
103
CHAPTER 8 ANALYSIS OF RESULTS
105
8.1
Comparison of Results of Competing Metaheuristics
105
8.2
Comparison with Best-known Results
109
8.3
Comparison of Computational Times
111
8.4
Concluding Remarks
112
CHAPTER 9 SUMMARY AND CONCLUSION
114
REFERENCES
118
v
Summary
Route network design is the first and the most important step in the bus transportation
planning process. This is because the route structure designed becomes an important
input to the subsequent decision making processes and will invariably affect the later
planning steps. Effective design of route network and service frequencies can
decrease the overall cost of providing the transit service and increase the efficiency of
the bus transit system. The main challenge of the route network design problem is to
be able to give a good and efficient solution in a reasonable computation time.
In this thesis, we focus on the design of the Feeder Bus Network Design Problem
(FBNDP). The problem involves designing a set of feeder bus routes to provide
access to an existing rail public transport system and the determination of the
operating frequency on each route, such that the objective function of the total
operator and user costs is minimized. The main objective of this research is to design
better and more efficient algorithms to the FBNDP by exploring the use of
metaheuristics and other innovative heuristics. Metaheuristics have their own way of
avoiding getting trapped in local minimum in its search for the global minimum and
have seldom being used to solve the FBNDP in the literature. Their potential is
explored in this research. Four metaheuristics for solving the FBNDP are proposed.
They are Simulated Annealing, Tabu Search, Genetic Algorithm and the more recent
metaheuristic, Ant Colony Optimization. The results are compared to those published
in literature. A comparative study is also carried out on several test problems
generated at random to evaluate the performance of these heuristics in terms of their
computational efficiency and solution quality. These problems vary in several
vi
characteristics such as the problem size and the problem structure. The problem size is
determined by the size of the service area, the number of stations in the service area
and the density of the bus stops in the service area. The problem structure is
determined by the shape of the station network: a line network, a junction network
and a crossing network, the location of the destination station: either at the central or
at the peripheral of the service area, and the grouping of the bus stops: either clustered
or evenly distributed based on the geographical location of the service area.
Computational experiments have shown that Tabu Search combined with an
intensification strategy is the most effective metaheuristic, generating better quality
solutions. It has also produced a new best solution as compared to the literature.
However, the computational time is the longest. Genetic Algorithm is closely
comparable to basic Tabu Search. Simulated Annealing is fast and offers reasonably
good solutions. Ant Colony Optimization is comparable to the state-of-the-art
algorithms such as Simulated Annealing.
vii
Nomenclature
ACO
Ant colony optimization
CBD
Central Business District
FBNDP
Feeder Bus Network Design Problem
GA
Genetic algorithm
MDVRP
Multi-depot vehicle routing problem
SA
Simulated annealing
TS
Tabu search
TSP
Travelling salesman problem
VRP
Vehicle routing problem
cooling_rate
Constant for the reduction of the temperature for SA
max_count
Maximum counter value for stopping criterion for SA
max_Iter
Maximum number of iterations for stopping criterion for TS and ACO
max_moves
Maximum number of moves to be performed at each temperature T for SA
min_percent
Minimum percentage to define thermal equilibrium at each temperature for
SA
n_gen
Number of generations for GA
n_NB
Size of nearest neighbours for TS and ACO
pop_size
Size of population for GA
tabu_size
Tabu list size for TS
ASH
Maximum available seat-hours
Cjs
Unit rail wait-time and riding-time cost from rail node j to destination s
($/passenger)
c
Bus-vehicle capacity
DE
Exchange delimiter
viii
DI
Initial delimiter
Dk
Maximum route length of route k (miles)
Dij
Distance between stops i and j
d ij
Distance between stops i and j for ACO
d ist
Distance between stop i and station st for ACO
~
d ist
Modified distance from station st to stop i for ACO
Fk
Service frequency on bus route k
H
Any proper subset of N containing the set of all rail nodes
I
Number of stops
INCOSTi ( p, q ) Cost of inserting stop i between nodes p and q of route k
J
Number of stations
K
Number of routes
Lih
Distance between nodes i and h (miles)
Lk
Length of route segment k
lij
Distance from stop i to station j
MSVTCi ( p, q ) Modified savings from inserting stop i between nodes p and q of route k
MTCi j
Modified cost of direct route from stop i to station j
m
Number of ants for ACO
N
Set of all nodes
Pc
Crossover probability for GA
Pm
Mutation probability for GA
pijk
Probability of ant k of visiting stop j from stop i for ACO
pik, st
Probability of ant k choosing to link stop i to station st for ACO
Q
Quantity of pheromone laid by an ant per iteration for ACO
Qi
Average demand per hour at bus node i (passengers/hour)
Qk
Demand on route segment k
ix
Q
Average hourly demand per stop (passengers/hour)
qi
Average demand per hour at bus stop i
SAVTCik
Savings from including stop i in route segment k
s ijst
Savings from linking stops i and j to a route assigned to station st for ACO
~
sijst
Modified savings from linking stops i and j to a route assigned to station st
for ACO
T
Current temperature for SA
Ti
Temperature at iteration i for SA
Tinit
Initial temperature for SA
TCi j
Total cost of direct route from stop i to station j
TCµ
Total cost generated by the µth best ant for ACO
TC*
Total cost of the best found solution for ACO
TC(s)
Total cost for solution s
U
Average bus operating-speed (mile/hour)
Xihk
Binary variable; Value of 1 if stop i precedes stop h on bus route k
Yij
Binary variable; Value of 1 if stop i is assigned to station j
α
Parameter to regulate the influence of pheromone trail, τ ij and τ i, st , for ACO
β
Parameter to regulate the influence of heuristic information, ηij and ηi , st , for
ACO
σ
Number of elitist ants for ACO
µ
Ranking index of ants for ACO
Ω
The set of stops which ant k has not yet visited for ACO
Ω
λ0
st
The set of stations which stop i can be assigned to for ACO
Unit bus operating-cost ($/vehicle-mile)
x
λr
Value of one passenger-hour of riding-time ($/passenger-hour)
λw
Value of one passenger-hour of waiting-time ($/passenger-hour)
ρL
Average bus-load factor
ρ
Pheromone trail evaporation rate for ACO
ηij
Visibility of stop j from stop i for ACO
ηi, st
Visibility of station st from stop i for ACO
τ ij
Intensity of pheromone trail between stops i and j for ACO
τ i , st
Intensity of pseudo-pheromone trail between stop i and station st for ACO
τ ij new
Updated pheromone trail level on edge (i, j) for ACO
∆τ ij*
Increase of trail level on edge (i, j) caused by the elitist ants for ACO
∆τ ijµ
Increase of trail level on edge (i, j) caused by the µth best ant for ACO
Subscripts:
h
Node index (bus node or rail node); h = 1, …, I + J
i, m
Bus-node index; i, m = 1, …, I
j
Rail-node index; j = I + 1, …, I + J
k
Bus-route index; k = 1, …, K
s
Destination station
xi
List of Figures
Figure 1.1:
Bus network design problem
Figure 1.2:
Feeder bus network design problem
Figure 2.1:
Example of an actual street network in an analytic model
Figure 2.2:
Example of a simple network model with 8 nodes and 9 links
Figure 3.1(a): Illustration of the three types of station networks: line (left), junction
(centre), and crossing (right)
Figure 3.1(b): Illustration of the two locations of the destination station: central (left)
and peripheral (right)
Figure 3.1(c): Illustration of the grouping of the bus stops: clustered (left) and evenly
distributed (right)
Figure 8.1:
Best solution obtained for base problem
xii
List of Tables
Table 3.1:
Bus stop locations
Table 3.2:
Station locations
Table 3.3:
Values for parameters
Table 3.4:
Summary of the test problems generated
Table 4.1:
Summary of average and best total costs for SA
Table 4.2:
Summary of computational times in seconds for SA
Table 5.1:
Summary of average and best total costs for Basic TS
Table 5.2:
Summary of computational times in seconds for Basic TS
Table 5.3:
Summary of average and best total costs for TS with intensification
Table 5.4:
Summary
of computational times in seconds for TS with
intensification
Table 6.1:
Summary of average and best total costs for GA
Table 6.2:
Summary of computational times in seconds for GA
Table 7.1:
Summary of average and best total costs for ACO
Table 7.2:
Summary of computational times in seconds for ACO
Table 8.1:
Comparison of average total costs
Table 8.2:
Comparison of best total costs
Table 8.3:
Comparison of average computational times in seconds
Table 8.4:
Average percentage deviation from best solution obtained
Table 8.5:
Comparison of average percentage deviation based on problem
characteristics
Table 8.6:
Best solution obtained for base problem
Table 8.7:
Comparison between our metaheuristics and the best-known results
Table 8.8:
Comparison of computational times based on problem characteristics
Chapter 1: Introduction
Chapter 1 Introduction
In this chapter, we present the role of route network design in the transportation
planning process and the difficulties faced by researchers in dealing with this problem.
This research is focused on the feeder bus network design problem. The model
formulation, the objective and the scope of this research are presented.
1.1
The Route Network Design Problem
The transportation planning process is decomposed into four basic elements
performed in sequence due to its complexity: route network design and setting
frequencies, timetabling, bus scheduling and driver scheduling. Route network design
involves the design of an optimal network of bus routes and associated frequencies
(inverse of headways) for each route that achieves some desired objectives, subject to
some operational constraints and maintaining the quality of service offered. Being the
first step in the planning process, it becomes the most important planning step in the
bus transit planning process (Ceder and Wilson, 1986). This is because the route
structure designed becomes an important input to the subsequent decision making
processes and will invariably affect the later planning steps. It is also due to the fact
that bus operators have the least flexibility in altering the routes once they are set.
Ceder and Wilson (1986) highlighted some important components of route network
design such as estimating demand, identification of objective function, constraints and
passenger behaviour. The objective functions adopted by various researchers vary
widely. Ceder and Israeli (1998) explained that an ideal objective function should take
1
Chapter 1: Introduction
care of the operator as well as the user perspectives in a transit operation. The prime
concern of the operator is to minimize the operating cost or maximize the profit,
which depends on the fleet size and the average bus round trip travel time and total
distance traveled. The user, on the other hand, looks for minimum total travel time
which may consist of waiting time, riding time and transfer time, the number of
transfers and sometimes the access cost, which is incurred by passengers walking to
the bus route. Hence, the objective function is generally the minimization of the sum
of user costs and operator costs. Feasibility constraints may include minimum or
maximum operating frequencies on all or selected routes, the maximum load factor on
any bus route which is a function of vehicle size, the maximum allowable bus fleet
size or operating costs, the vehicle size, etc.
In terms of passenger demand, most of the time it is assumed fixed or inelastic for
simplicity. The assumption of fixed demand may be reasonable for systems in which
ridership is insensitive or independent to service quality or price. Otherwise, demand
can be a variable, probably due to the sharing or competition of the public transport.
Two types of travel demand patterns, many-to-one and many-to-many, are also
considered. The many-to-one demand pattern refers to passengers traveling from
multiple origins to a single destination. This is usually more applicable to feeder bus
services which carry passengers to a common destination (e.g. a central business
district or a transfer station). In most bus services, the many-to-many demand pattern
is considered when passengers have different origins and destinations.
Effective design of transit routes and service frequencies can decrease the overall cost
of providing the transit service and increase the efficiency of the bus transit system,
2
Chapter 1: Introduction
thereby attracting people to use the public transportation system. There are several
criteria considered by researchers to evaluate the efficiency of bus route network
design. In general, an efficient bus route network design should be able to satisfy most,
if not all, of the existing transit demand, without requiring passengers to transfer from
one route to another. The routes should be preferably short to reduce operating cost
and the total travel time required by passengers to reach their destinations should be
fast and passengers are able to easily access from their origins or destinations (e.g. a
non-circuitous route). For a longer term planning process, a bus route design system
should be more dynamic and can provide a quick solution to incident events such as
accidents, road maintenance, or special events, without major disruptions to the
present system. It should also be capable of designing the extension of existing bus
routes or even redesigning the entire route network.
Another main challenge of the route network design problem is to be able to give a
good and efficient solution in a reasonable computation time. As found out by some
researchers, the problem of designing an efficient route network for a transit system is
a difficult optimization problem which does not lend itself readily to mathematical
programming formulations and solutions using traditional techniques (Newell, 1979).
Similar observations are also made by Johnson et al. (1977) and Baaj and
Mahmassani (1991). The transit route network design problem belongs to the class of
NP-hard, combinatorial problems that suffer from several forms of mathematical
complexity, such as nonlinearity, nonconvexity of the objective function, and the
discrete and multiobjective nature of route design (Baaj and Mahmassani, 1990)
which cannot be solved optimally by any polynomial growth algorithms (Johnson et
al. 1977). This difficulty in solving the problem through traditional optimization
3
Chapter 1: Introduction
techniques leads to the continual development of heuristic algorithms which are new
and more robust to tackle such problems.
1.2
Types of Route Network Design Problems
There are two types of bus route network design problem. The first type is, given a
service area with pre-specified bus stop locations and an hourly demand at each bus
stop, the bus network design problem involves designing a set of bus routes and
determining the associated frequencies for each route, such that it achieves the desired
objective with a specified service level to the passengers and subject to some
constraints imposed by the problem. In other words, the problem involves connecting
all the demand points (bus stops) such that most, preferably all, the passengers are
able to access from one point to another, while optimizing the objective function
subject to the constraints imposed.
×
×
×
×
×
×
×
×
×
×
×
×
×
×
×
×
×
×
×
×
×
×
×
×
×
×
Figure 1.1: Bus network design problem
4
Chapter 1: Introduction
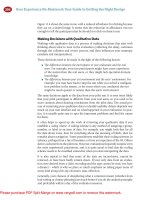
The second type is the FBNDP. It differs from the first type in that there is an existing
rail public transport system (e.g. Mass Rapid Transit system in Singapore) and the
buses serve to carry the passengers from the bus stops to the various stations. In other
words, the problem involves designing a feeder bus network to provide access to an
existing rail public transport system. Thus, given a service area with prespecified bus
stop locations, and also a fixed rail transport system and an hourly demand at each bus
stop, this problem also involves designing a set of feeder bus routes and determining
the associated frequencies for each route that achieves the desired objective with a
specified service level to the passengers and subject to the constraints.
×
×
×
×
×
×
×
×
×
•
•
×
•
×
×
×
×
×
×
×
×
×
×
×
•
•
×
×
×
•
×
×
Figure 1.2: Feeder bus network design problem
An intermodal transit system, integrating a rail line and a number of feeder bus routes
connected at different transfer stations, is inevitable in large metropolitan regions,
where transit demand is high and widely spread. Singapore is a good example of such
an integrated system. The present MRT system is fast, reliable, and highly efficient
and is able to carry high volumes of passengers. It is a convenient mode of transport
for the passengers and at the same time it eases the traffic on the roads. When this
mode of transport exists, it is likely that a second level network of feeder bus routes
5
Chapter 1: Introduction
are set up, whose main purpose is to transport users from the bus stops to the MRT
network. The main challenge of designing an efficient feeder bus route network is to
integrate and coordinate the rail and bus services as efficiently as possible. The
development of better integrated intermodal systems improves service quality and
passenger satisfaction that results from better coverage, reduced access costs, minimal
delay and shorter travel times. From the viewpoint of the transit operators, an overall
coordination among the various public transport modes can reduce their operating
costs and increase their revenue by maintaining shorter routes and eliminating
duplication of routes by the train and the buses. Thus, in this research we will focus
on the feeder bus network design problem.
1.3
Problem Formulation
Notations
ASH
Maximum available seat-hours
Cjs
Unit rail wait-time and riding-time cost from rail node j to destination s
($/passenger)
c
Bus-vehicle capacity
Dk
Maximum route length of route k (miles)
H
Any proper subset of N containing the set of all rail nodes
I
Number of stops
J
Number of stations
K
Number of routes
Lih
Distance between nodes i and h (miles)
N
Set of all nodes
6
Chapter 1: Introduction
Qi
Average demand per hour at bus node i (passengers/hour)
Q
Average hourly demand per stop (passengers/hour)
U
Average bus operating-speed (mile/hour)
λ0
Unit bus operating-cost ($/vehicle-mile)
λr
Value of one passenger-hour of riding-time ($/passenger-hour)
λw
Value of one passenger-hour of waiting-time ($/passenger-hour)
ρL
Average bus-load factor
Subscripts:
h
Node index (bus node or rail node); h = 1, …, I + J
i, m
Bus-node index; i, m = 1, …, I
j
Rail-node index; j = I + 1, …, I + J
k
Bus-route index; k = 1, …, K
s
Destination station
Then, the many-to-one (multiple origins, single destination) FBNDP can be
formulated as a non-linear programming model with both continuous and integer
variables as follows (Kuah and Perl, 1989):
Let
X ihk
=
1 if stop i precedes stop h on bus route k
0 otherwise
Yij
=
1 if stop i is assigned to station j
0 otherwise
Fk
=
Service frequency on bus route k
7
Chapter 1: Introduction
Minimize Z ( X , Y , F )
I +J
I
∑C ∑Q Y
=
js
j = I +1
λr
+
i ij
i =1
I I +J
K
2λ0 ∑ Fk ∑∑ Lih X ihk
k =1 i =1 h =1
+
I I+J
I I +J
L
X
Q
Qi X ihk
+
∑
∑∑
∑∑
ih ihk
2U k =1 i =1 h =1
i =1 h =1
+
λw ∑
K
K
I
1
k =1 2 Fk
I +J
∑∑ Q X
i =1 h =1
i
ihk
(1.1)
subject to
K I +J
∑∑ X
k =1 h =1
I
ihk
= 1;
i = 1,..., I
(1.1a)
≤ 1;
k = 1,..., K
(1.1b)
I+J
∑ ∑X
i =1 j = I +1
ijk
I +J
I
h =1
m =1
∑ X ihk − ∑ X mik ≥ 0;
K
∑ ∑∑ X
i∉H h∈H k =1
I +J
∑X
h =1
ihk
≥ 1;
i = 1,..., I ; k = 1,..., K
(1.1c)
∀H
(1.1d)
I
+ ∑ X mjk − Yij ≤ 1;
ihk
i = 1,..., I ; j = I + 1,..., I + J ; k = 1,..., K
m =1
(1.1e)
I
I +J
i =1
h =1
∑ Qi ∑ X ihk ≤ cFk ;
2c
ρ LU
I
K
I
I +J
∑ F ∑∑ L
k =1
I +J
∑∑ L
i =1 h =1
ih
k
i =1 h =1
ih
k = 1,..., K
X ihk ≤ ASH
X ihk ≤ Dk ;
k = 1,..., K
(1.1f)
(1.1g)
(1.1h)
X ihk , Yij =
0, 1;
i = 1,..., I ; j = I + 1,..., I + J ; k = 1,..., K ; h = 1,..., I + J
Fk
0;
k = 1,..., K
≥
8
Chapter 1: Introduction
The objective function consists of four cost components. The first term represents the
passenger costs in the rail system (waiting-time and riding-time cost in the trains).
The second term gives the operating costs incurred on the bus operator, which is
proportional to the total distance traveled by the buses (round trip). The third term
gives an approximation to the passengers’ bus riding costs and the last term represents
passengers’ bus waiting costs. The constraints (1.1a) to (1.1e), together with the
definition of the binary variables, determine the feasibility of the bus routes.
Constraint (1.1a) requires that each stop is placed on a single route. Constraint (1.1b)
ensures that each route is linked to a single station. Constraint (1.1c) constitutes the
route-continuity, stating that a route which enters a bus node must leave that same
node. Constraint (1.1d) requires that every feeder bus route must be linked to a station.
Constraint (1.1e) specifies that a bus stop can be assigned to a station only if a route
which terminates at that station passes through that stop. Constraints (1.1f), (1.1g) and
(1.1h) impose the restrictions on the route network. Constraint (1.1f) specifies the
limit on route capacity. Constraint (1.1g) states that the total seat-hours used should
not exceed that which can be provided by the available fleet. Constraint (1.1h)
imposes a maximum limit on each route length.
The FBNDP focuses on the design of a set of feeder bus routes and the determination
of the operating frequency on each route, such that the objective function of the sum
of operator and user costs is minimized. It can be viewed as achieving the optimal
balance between the operator costs and user costs. The operator cost is related to the
length travelled by the vehicles (total route length). The user cost is a function of total
passenger travel time including the waiting time and riding time on both the bus and
the train.
9
Chapter 1: Introduction
The network model, as shown in Figure 1.2, consists of two types of nodes – rail
nodes and bus nodes, which represent railway stations and bus stops respectively. The
rail transport network is assumed to be fixed, that is, defined in advance and not
subjected to changes, and is represented as links joining the rail nodes shown in the
diagram on the left in Figure 1.2. The location of bus stops is prespecified and the
demand is assumed to be concentrated at bus nodes and inelastic to service quality
and fares. The demand can be viewed as the average number of passengers per hour
during the time period of study (e.g. peak period or off-peak period). The demand of
passengers at each bus stop, the travel cost in the rail system between each pair of
railway stations, the distance between each pair of bus stops and between every bus
stop and every railway station are given. The bus fleet size, capacities and operating
speed of the fleet of buses over the planning period are also given. In terms of
network representation, the problem involves linking bus nodes to rail nodes, in which
these bus links represent feeder bus route segments, as shown in the diagram on the
right in Figure 1.2.
In our approach, FBNDP is considered under many-to-one demand pattern with
multiple origins and a single destination. Peak-period work trips to the Central
Business District (CBD) in the morning may exhibit this pattern. In this case, all
passengers share a common destination, identified as the central city station.
Passengers gathered at bus stops located in the service area wish to access this
destination by first travelling by bus to any of the stations and then proceeding to the
city centre by train. The following assumptions are made for the many-to-one FBNDP:
(1) Each bus stop is served by one feeder bus route only. (2) Each feeder-bus route is
linked to exactly one station. This implies that buses are not allowed to travel along
10
Chapter 1: Introduction
rail lines, which is consistent with one of the basic purposes of integration, i.e. the
elimination of duplicate services. (3) All buses have standard operating speeds and
capacities. (4) The feeder-bus is assumed to halt at all the stops on its route.
1.4
Research Scope
A real world FBNDP is usually extremely large and complex. It cannot be solved to
optimality within a reasonable amount of computation time using existing exact
optimization methods and needs to be solved heuristically. The main objective of this
research is to design efficient algorithms to the FBNDP by exploring the use of
metaheuristics and other innovative heuristics. Metaheuristics have their own way of
avoiding getting trapped in local minima in its search for the global minimum and
have seldom been used to solve FBNDP. Their potential is explored in this research.
Based on the formulation proposed in the literature, the model is solved using
metaheuristics such as simulated annealing (SA), tabu search (TS) and genetic
algorithms (GA), and a newer heuristic, the ant colony optimization (ACO). Results
are compared to those published in literature for the benchmarking problem. A
comparative study is also carried out on several test problems generated at random to
compare the performance of the various heuristics in terms of better computational
efficiency and better solution quality.
11