Automatic chromosome classification and chromosome abnormalities identification based on dynamic time warping
Bạn đang xem bản rút gọn của tài liệu. Xem và tải ngay bản đầy đủ của tài liệu tại đây (1.15 MB, 156 trang )
AUTOMATIC CHROMOSOME CLASSIFICATION AND CHROMOSOME
ABNORMALITIES IDENTIFICATION BASED ON DYNAMIC TIME WARPING
BENOIT LEGRAND
(B. E., Supélec, France)
A THESIS SUBMITTED
FOR THE DEGREE OF MASTER OF ENGINEERING
DEPARTMENT OF ELECTRICAL & COMPUTER ENGINEERING
NATIONAL UNIVERSITY OF SINGAPORE
2006
Acknowledgments
First and foremost, I would like to express my gratitude to my supervisor, Dr Chang
Che Sau, for his invaluable time and support during my two years of study in Singapore.
I also would like to express my deep gratitude to Dr Ong Sim Heng, for his
pertinent and useful advice.
I am grateful to Dr Nallasivam Palanisamy and Dr Neo Soek Ying of the Genome
Institute of Singapore. The chromosome images and their expertise in cytogenetics were
essential to finalize my project.
I would like to thank Mr. Seow Hung Cheng, the Power System Lab officer, for his
warm welcome and his continuous support.
This work was supported by a research scholarship from the National University of
Singapore (NUS). I am extremely thankful to NUS for the financial support.
My study in Singapore was made possible through the double-degree program
between the National University of Singapore (NUS) and Ecole Supérieure d’Electricité
(Supélec). I am particularly grateful to the international relation offices of both Supélec
and NUS for their advice before and during my stay in Singapore.
i
Table of contents
Table of contents
Acknowledgments................................................................................................................ i
Table of contents................................................................................................................. ii
Summary ............................................................................................................................ ix
List of publications related to this study ............................................................................ xi
List of Tables .................................................................................................................... xii
List of Figures .................................................................................................................. xiii
List of Symbols ................................................................................................................. xv
List of Symbols ................................................................................................................. xv
List of Abbreviations ....................................................................................................... xix
CHAPTER 1
INTRODUCTION ............................................................................................ 1
1.1
Motivations and objectives for the research ....................................................... 1
1.2
Major steps of chromosome classification.......................................................... 3
1.3
Main contributions .............................................................................................. 4
1.3.1
Normal chromosome classification............................................................. 5
1.3.2
Mapping of chromosome abnormalities ..................................................... 6
1.4
Thesis organization ............................................................................................. 7
CHAPTER 2
CHROMOSOMES AND IMAGING TECHNIQUES ................................................ 9
2.1
Chromosome structure ........................................................................................ 9
2.2
Karyotyping and chromosome banding ............................................................ 12
2.3
Chromosome abnormalities .............................................................................. 14
2.3.1
Extra or missing chromosomes................................................................. 14
2.3.2
Duplication................................................................................................ 15
ii
Table of contents
2.3.3
Deletion..................................................................................................... 15
2.3.4
Translocation............................................................................................. 16
2.3.5
Inversion ................................................................................................... 17
2.3.6
Insertion .................................................................................................... 18
2.3.7
Ring........................................................................................................... 18
2.4
Modern chromosome imaging techniques ........................................................ 19
2.4.1
Fluorescence in situ hybridization (FISH)................................................ 19
2.4.2
Comparative genomic hybridization (CGH)............................................. 20
2.4.3
Multicolor karyotyping (M-FISH, SKY and CCK).................................. 21
2.5
Conclusion ........................................................................................................ 22
CHAPTER 3
3.1
LITERATURE SURVEY ON AUTOMATIC CHROMOSOME CLASSIFICATION ...... 23
Image quality improvement .............................................................................. 24
3.1.1
Noise removal ........................................................................................... 24
3.1.2
Debris removal.......................................................................................... 24
3.1.3
Image enhancement .................................................................................. 25
3.2
Chromosome segmentation............................................................................... 26
3.2.1
Threshold .................................................................................................. 26
3.2.2
Variance .................................................................................................... 27
3.2.3
Entropy...................................................................................................... 27
3.3
Touching and overlapping chromosomes ......................................................... 27
3.3.1
Skeleton..................................................................................................... 28
3.3.2
Curvature................................................................................................... 29
3.3.3
Band analysis ............................................................................................ 29
iii
Table of contents
3.4
Feature extraction.............................................................................................. 30
3.4.1
Skeleton..................................................................................................... 30
3.4.2
Length ....................................................................................................... 31
3.4.3
Centromere................................................................................................ 31
3.4.4
Density profile .......................................................................................... 32
3.4.5
Border ....................................................................................................... 32
3.4.6
Area........................................................................................................... 33
3.4.7
Signature ................................................................................................... 33
3.5
Feature reduction .............................................................................................. 33
3.6
Classification..................................................................................................... 35
3.6.1
Neural Network......................................................................................... 36
3.6.1.1
Multi Layer Perceptron ......................................................................... 36
3.6.1.2
Probabilistic Neural Networks.............................................................. 37
3.6.1.3
Higher Order Neural Networks............................................................. 37
3.6.2
Expert system............................................................................................ 37
3.6.3
Bayesian classifier .................................................................................... 38
3.6.4
Classification in two steps ........................................................................ 38
3.6.5
Hybrid method .......................................................................................... 39
3.7
Implementation ................................................................................................. 39
3.8
Conclusion ........................................................................................................ 39
CHAPTER 4
CHROMOSOME SEGMENTATION AND FEATURE EXTRACTION ...................... 40
4.1
Noise filtering ................................................................................................... 41
4.2
Segmentation..................................................................................................... 41
iv
Table of contents
4.2.1
Threshold .................................................................................................. 42
4.2.2
Border detection........................................................................................ 43
4.2.3
Filling........................................................................................................ 43
4.2.4
Thinning.................................................................................................... 43
4.2.5
Pruning...................................................................................................... 44
4.2.6
Skeleton extension .................................................................................... 44
4.3
Feature extraction.............................................................................................. 44
4.3.1
Length ....................................................................................................... 45
4.3.2
Density profile .......................................................................................... 46
4.3.3
Centromere location.................................................................................. 47
4.4
Feature normalization: ...................................................................................... 48
4.4.1
Length normalization ................................................................................ 48
4.4.2
Density profile .......................................................................................... 48
4.4.3
Centromeric index..................................................................................... 50
4.5
Conclusion ........................................................................................................ 51
CHAPTER 5
NORMAL HUMAN CHROMOSOME CLASSIFICATION ..................................... 52
5.1
Introduction....................................................................................................... 52
5.2
Data base........................................................................................................... 53
5.3
DTW-based classifier........................................................................................ 55
5.3.1
Motivation for using the DTW algorithm................................................. 55
5.3.2
DTW-based chromosome classifier.......................................................... 58
5.3.2.1
Reference chromosomes ....................................................................... 60
5.3.2.2
Length feature ....................................................................................... 62
v
Table of contents
5.3.2.3
5.3.3
Dimension of the density profile........................................................... 63
5.4
Classification results ................................................................................. 64
Comparison with the Bayesian classifier.......................................................... 66
5.4.1
Bayesian classifier .................................................................................... 66
5.4.2
Classification performances...................................................................... 67
5.4.3
Size of the training set............................................................................... 68
5.5
Conclusion ........................................................................................................ 70
CHAPTER 6
ABNORMAL CHROMOSOME ANALYSIS ........................................................ 71
6.1
Introduction....................................................................................................... 71
6.2
Image acquisition .............................................................................................. 73
6.2.1
G-Banding images .................................................................................... 74
6.2.2
SKY Images .............................................................................................. 74
6.3
Reference density profiles................................................................................. 75
6.4
Translocation analysis procedure...................................................................... 76
6.4.1
Overall principle ....................................................................................... 76
6.4.2
Scale ratio.................................................................................................. 81
6.4.3
Chromosome sections comparison ........................................................... 84
6.4.4
Recombination point identification........................................................... 88
6.5
Performances and results .................................................................................. 89
6.6
Conclusions....................................................................................................... 95
CHAPTER 7
CONCLUSION.............................................................................................. 96
Bibliography ..................................................................................................................... 98
APPENDIX A
IMAGE PROCESSING ALGORITHMS ............................................................ 104
vi
Table of contents
A.1
Median filter.................................................................................................... 104
A.2
Border follower algorithm .............................................................................. 105
A.3
Filling algorithm ............................................................................................. 107
A.4
Thinning algorithm ......................................................................................... 108
APPENDIX B
DYNAMIC TIME WARPING ALGORITHM ..................................................... 112
APPENDIX C
BAYESIAN CLASSIFIER ............................................................................. 116
C.1
Theory ............................................................................................................. 116
C.2
Feature dimension reduction........................................................................... 118
APPENDIX D
MAPPING OF CHROMOSOME ABNORMALITIES........................................... 120
D.1
Cell line HCT116............................................................................................ 121
D.2
Cell line HEPG2 ............................................................................................. 123
D.3
Cell line HEP3B.............................................................................................. 125
APPENDIX E
IDEOGRAMS AND REFERENCE DENSITY PROFILES ..................................... 126
E.1
Chromosome 1 ................................................................................................ 126
E.2
Chromosome 5 ................................................................................................ 127
E.3
Chromosome 6 ................................................................................................ 128
E.4
Chromosome 7 ................................................................................................ 129
E.5
Chromosome 8 ................................................................................................ 130
E.6
Chromosome 10 .............................................................................................. 131
E.7
Chromosome 11 .............................................................................................. 132
E.8
Chromosome 16 .............................................................................................. 133
E.9
Chromosome 17 .............................................................................................. 134
E.10
Chromosome 18 .............................................................................................. 135
vii
Table of contents
E.11
Chromosome 21 .............................................................................................. 136
viii
Summary
Summary
Studies on chromosomes are essential to understand chromosome aberrations and
their corresponding diseases. Nowadays, human chromosome analysis is commonly used
to identify genetic defects in prenatal screening and in cancer pathology research.
Manual chromosome analysis is a slow and laborious operation that requires
qualified personnel. Modern imaging techniques and image analysis software have
recently greatly facilitated the study on chromosome. However, there is a lack of
software able to deal with abnormal chromosomes and to combine information from
different imaging methods. This study proposes a procedure to automate the chromosome
banding analysis. The proposed system is able to automatically map some common
chromosome abnormalities by combining a banding analysis with the information
provided by the spectral karyotyping imaging techniques. The dynamic time warping
(DTW) algorithm, traditionally used in speech recognition applications, has been adapted
to the identification of chromosome banding patterns in order to overcome the problems
due to the non-rigid nature of chromosomes.
At first, a pattern classifier has been developed to perform the classification of
normal human chromosomes. This classifier is based on the dynamic time warping
algorithm in order to be able to compare unknown banding patterns with some precomputed references. This classification method has the main advantage to require only a
few training samples in comparison with the traditional chromosome classifiers based on
Neural networks or Bayesian classifiers. This property is due to the transfer of the
ix
Summary
knowledge that chromosomes can have different elongations from the training set to the
classifier itself. For the same classification accuracy, the DTW-based classifier achieves a
large reduction of 88% of the number of training samples in comparison with the
Bayesian classifier. This performance is particularly useful for dealing with species that
are seldom studied or to classify some abnormal chromosomes with only a few training
samples.
The second part of the study is dedicated to the development of an automatic
system to map abnormal chromosomes. Several modern cytogenetics imaging techniques
facilitate the study of chromosome defects, but are individually unable to completely map
chromosome aberrations. Comparative genomic hybridization (CGH) is an imaging
method that has the ability to reveal chromosome amplifications and deletions, but not to
determine the amplified or deleted sections. Multiplex fluorescence in situ hybridization
(M-FISH) and spectral karyotyping (SKY) detect inter-chromosomal rearrangements, but
are not able to discover intra-chromosomal rearrangement and to identify the exchanged
chromosome sections. For all these reasons, the traditional banding analysis method is
essential to obtain a complete identification of chromosome aberrations. Nowadays,
banding analysis and combination of information from different imaging systems are
done manually by cytogenetics experts. This study proposes a procedure to automate the
banding analysis operation by using the information given by the spectral karyotyping
images. The proposed system has been successfully applied to the mapping of
chromosome translocations, duplications and deletions in solid tumor cells. This new tool
is useful to better understand chromosome disorders.
x
List of publications related to this study
List of publications related to this study
1. B. Legrand, C.S. Chang, S.H. Ong, S.Y. Neo and N. Palanisamy, “Chromosome
classification using dynamic time warping”, submitted to Pattern and Recognition
Letters.
2. B. Legrand, C.S. Chang, S.H. Ong, S.Y. Neo and N. Palanisamy, “Mapping of
chromosome abnormalities by automated banding analysis”, submitted to IEEE
Transactions on Biomedical Engineering.
xi
List of Tables
List of Tables
Table 2.1: Description of the seven Denver groups
12
Table 5.1: Normal human chromosome data base
54
Table 5.2: Confusion matrix
65
Table 5.3: Classification accuracy (DTW-based classifier)
65
Table 5.4: Number of samples in the training and test set
67
Table 5.5: Relation between classification accuracy and features
68
Table 5.6: Classification accuracy (Bayesian classifier)
68
Table 6.1: Cell lines
73
Table 6.2: Chromosome abnormalities
89
Table 6.3: Translocation t(5;7) in the cell line HCT116
93
xii
List of Figures
List of Figures
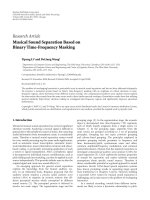
Figure 1.1: Major steps of chromosome identification
4
Figure 2.1: Normal human female G-banded karyotype
10
Figure 2.2: Silhouette of a chromosome
10
Figure 2.3: Mitotic cell division
11
Figure 2.4: Example of metacentric, submetacentric and acrocentric chromosomes
12
Figure 2.5: Ideograms of the normal human chromosome 16 in different resolutions [50]
14
Figure 2.6: Example of chromosome abnormalities (duplication, deletion, translocation)
17
Figure 2.7: Example of chromosome abnormalities: (inversion, insertion, ring)
19
Figure 2.8: Example of FISH image
20
Figure 2.9: Example of SKY image (cell line HEP3B - liver tumor)
22
Figure 3.1: Major steps of automatic chromosome classification
23
Figure 3.2: Debris on a metaphase image [36]
25
Figure 3.3: Example of touching and overlapping chromosomes on a metaphase image
28
Figure 3.4: Skeleton of overlapping chromosome
29
Figure 3.5: Possible cut points on overlapped chromosomes [13]
29
Figure 4.1: First step: Image quality improvement
41
Figure 4.2: Second step: Chromosome segmentation
41
Figure 4.3: Chromosome segmentation
42
Figure 4.4: Third step: Feature computation
45
Figure 4.5: Chromosome length computation
45
Figure 4.6: Skeleton between the two sister chromatids
46
Figure 4.7: Section of a chromosome
47
Figure 4.8: Normalized density profile of a normal human G-banded chromosome 1
50
Figure 4.9: Centromeric index
51
Figure 5.1: Normalized density profiles of two normal chromosomes 1
56
Figure 5.2: Alignment found by the DTW algorithm for the density profiles of Figure 5.1
57
xiii
List of Figures
Figure 5.3: Normal chromosome DTW-based classifier
58
Figure 5.4: Overall principle of the DTW-based chromosome classifier
59
Figure 5.5: Classification accuracy versus the number of training samples
61
Figure 5.6: Classification accuracy versus the number of pre-selected reference chromosomes
63
Figure 5.7: Classification accuracy versus the dimension of the density profile
64
Figure 5.8: Density profiles of chromosomes 19 and 21
66
Figure 5.9: Classification accuracy versus the number of training samples (Bayesian classifier)
69
Figure 6.1: Necessity of the banding analysis (translocation t(1,11) in the cell line HEP3B)
72
Figure 6.2: Overall flowchart of the proposed algorithm
78
Figure 6.3: Find the normal section that best match an abnormal section
80
Figure 6.4: Comparison of an abnormal section with a reference chromosome
86
Figure 6.5: Similarity between the translocation and sections of a reference chromosome
87
Figure 6.6: Example of translocation t(5;7) from the cell line HCT116
90
Figure 6.7: Section of reference chromosome 5
91
Figure 6.8: Section of reference chromosome 7
92
Figure 6.9: Complete mapping of translocation t(5;7) from the cell line HCT116
94
Figure A.1: Border follower algorithm
105
Figure A.2: Flow chart of the border follower algorithm
106
Figure A.3 Flow chart of the filling algorithm
108
Figure A.4: Flow chart of the thinning algorithm
109
Figure A.5: Flow chart of the first step of the thinning algorithm
111
Figure B.1: Unknown and reference density profiles
112
Figure B.2: Local cost matrix
113
Figure B.3: DTW path
114
Figure B.4: DTW step
115
xiv
List of Symbols
List of Symbols
Chapter 4: Chromosome segmentation and feature extraction
pi
Gray level value of the ith point of the raw density profile
pi′
Gray level value of the ith point of the re-sampled density profile
pi′′
Normalized value of the ith point of the re-sampled density profile
M
Number of points in the raw density profiles
N
Number of points in the re-sampled density profiles
Chapter 5: Normal human chromosome classification
Li , p
Normalized length of the ith training sample of chromosome p
Lp
Average of the normalized lengths of chromosome p
T
Number of training samples used to create each reference template
Chapter 6: Abnormal chromosome analysis
l
Length of a normal chromosome in a reference karyotype
lˆ
Length of a normal chromosome in the abnormal karyotype
li
Length of the reference chromosome i
lˆi
Length of a normal chromosome i in the abnormal karyotype
Li ,k
Normalized length of the chromosome i in the normal karyotype k
Li
Average of the normalized lengths of chromosome i
K
Total number of normal karyotypes used to compute the average of the
normalized chromosome lengths
xv
List of Symbols
CLR (i , j )
Chromosome length ratio: Average of the normalized lengths of
chromosome i divided by the average of the normalized lengths of
chromosome j
Γ
Scale ratio: Length of a normal chromosome in the reference karyotype
divided by the length of the same normal chromosome in the abnormal
karyotype. Ratio between the scales of the reference and abnormal
karyotypes
Γi
Scale ratio for chromosome i: Ratio between the scale of the reference
chromosome i and the scale of the abnormal karyotype
R
Total number of chromosome used as length patterns to compute the
improved scale ratio
sˆ
Length of the abnormal section that are analyzed
si
Length of the sections of the reference chromosome i that are compared
with the abnormal section
n
Abscissa of the beginning of the reference section along the reference
chromosome
d
Direction of the comparison of the abnormal section with the reference
sections
A
Density profile sequence of the abnormal section
R id (n )
Density profile sequence of the section of the reference chromosome i
that starts at the abscissa n, in the direction d
DTWCost id (n)
Result of the DTW comparison, in the direction d, between the
abnormal section and the section of reference chromosome i that starts
xvi
List of Symbols
at the abscissa n
ni (d )
Abscissa of the beginning of the best reference section along the
reference chromosome i, for each comparison direction d
dˆi
Best comparison direction
nˆi
Best abscissa of the beginning of the reference section along the
reference chromosome i
r
Abscissa of the recombination point along the abnormal chromosome
nˆi ,r
Best abscissa of the beginning of the reference section along the
reference chromosome i, for the abscissa r of the recombination point
RPCost (r )
Total DTW cost corresponding to the abscissa r of the recombination
point
rˆ
Abscissa of the best recombination point
Appendix B Dynamic time warping algorithm
Unk
Sequence of the unknown density profile
Ref
Sequence of the reference density profile
ui
Value of the ith of the unknown density profile
ri
Value of the ith of the reference density profile
n
Number of point in the unknown density profile
m
Number of point in the reference density profile
ci , j
Element of the local cost matrix
G path
Global cost associated to the DTW path
N path
Length of the DTW path
xvii
List of Symbols
Ci , j
Cumulative cost in the local DTW matrix
Appendix C Bayesian classifier
x
Feature vector
ωi
Class ω i : the unknown sample is a chromosome i
P(ωi )
Prior probability of class ω i
p( x | ω i )
Probability density function
P(ω i | x)
Conditional probability of class ω i given a feature vector x
Σi)
d by d covariance matrix of the class ω i
N (i )
Number of training samples of the class ω i
J
Criterion for class separability
x(i ) k
kth training feature vector for chromosome i
SWithin
Within-Class Scatter Matrix
S Between
Between-Class Scatter Matrix
μ (i )
Mean of the feature vectors of the class ω i
μ(0)
Expected mean vector
d
Dimension of the feature vector before the dimension reduction process
nd
Reduced dimension of the feature vectors
xd
d -components column feature vector
xnd
nd -components column feature vector
xviii
List of Abbreviations
List of Abbreviations
ATCC
American type culture collection
BP
Break point
CGH
Comparative genomic hybridization
CCK
Color changing karyotype
CI
Centromeric index
DNA
Deoxyribonucleic acid
DTW
Dynamic time warping
DP
Density profile
FIR
Finite Impulse Response (filter)
FISH
Fluorescence in situ hybridization
GIS
Genome institute of Singapore
ISCN
International system for human cytogenetic nomenclature
MAT
Medial axis transform
MLP
Multi layer perceptron
M-FISH
Multiplex fluorescence in situ hybridization
NUS
National university of Singapore
RP
Recombination point in an abnormal chromosome
SKY
Spectral karyotyping
xix
Chapter 1 Introduction
Chapter 1
INTRODUCTION
In this introductory chapter, the motivation for the work done is presented. Then,
major contributions, and structure of the thesis are summarized.
1.1
Motivations and objectives for the research
Chromosomes are located in the nuclei of eukaryote cells and contain the DNA
double helices. They carry the genetic instructions for making living organisms [1].
Genetic defects that affect the chromosome structures are numerous, including
chromosome rearrangements, duplications and deletions [6]. Identification of such
chromosome aberrations has enormous impact on clinical diagnosis, medicine
development and basic research [56]. Nowadays, human chromosome analysis is
particularly used to identify genetic disorders in prenatal screening and in cancer
pathology research [55].
Chromosome banding analysis is the most commonly used method to check the
integrity of chromosomes. This method was discovered in 1969 and allows the
identification of the chromosomes by assigning a unique banding pattern on each
chromosome [3]. Banding analysis is routinely used in chromosome classification and
abnormalities detection. However, manual banding analysis is a slow and laborious
operation, and complex chromosome rearrangements are hard to identify. As a
consequence, there are medical and economic motivations to automate this process [2].
1
Chapter 1 Introduction
Automatic image analysis software has recently been developed to classify
chromosomes by using features including the length and the banding patterns [2] [9] [22]
[24] [27] [28] [31] [33] [34] [35] [36] [37] [39] [42] [43]. They are commonly used in
laboratories to classify normal human chromosomes. However, these systems are too task
specific and limited to the identification of normal chromosomes of a few species [3].
Most of these systems are based on neural networks or Bayesian classifiers because of
their ability to learn expert knowledge through a training process [35]. These methods
require the creation of sizeable training sets for each species.
Discovered in the nineties, new cytogenetic imaging techniques have greatly
improved the study of chromosome defects [55] [56]. These methods are based on in-situ
hybridization of the tumor DNA with colored DNA probes. They facilitate the detection
of complex chromosome abnormalities. However, these methods often require to be
combined with a traditional banding analysis to completely identify the various
chromosome segments [3]. Comparative genomic hybridization (CGH) has the ability to
reveal chromosome amplifications and deletions, but not to determine the amplified or
deleted sections. Multiplex fluorescence in situ hybridization (M-FISH) and spectral
karyotyping (SKY) detect inter-chromosomal rearrangements, but are not able to
discover intra-chromosomal rearrangement and to identify the exchanged chromosome
parts. As a consequence, chromosome banding analysis is essential for mapping
chromosome aberrations by identifying the involved abnormal sections. This issue is
currently not addressed by banding analysis imaging software that is mostly unable to
2
Chapter 1 Introduction
deal with abnormal chromosomes and to combine information from different imaging
techniques.
Chromosome aberrations are numerous and it is difficult to create large training set
for each abnormality. As a consequence, the ability to recognize chromosome sections
with only a few training samples is essential. This study proposes to use the dynamic time
warping (DTW) algorithm to compare unknown chromosome sections with some
reference banding patterns. DTW systems are mainly used in speech recognition
applications [4] to compare an unknown word with a stored reference word. The main
advantages of this method are that they require a small training set and are able to
recognize chromosome with different elongations. Based on this DTW algorithm, the
proposed study has developed a classifier for normal human chromosomes, and a banding
analysis procedure to map chromosome abnormalities.
1.2
Major steps of chromosome classification
The process of chromosome classification can be divided in 4 major steps (Figure
1.1). The input of the system is a gray level digital image of a banded chromosome. The
first 3 steps are image processing operations that are necessary to extract some features
from the raw chromosome image. The quality of the initial chromosome image and the
efficiency of the whole feature extraction process are essential to provide good features to
the chromosome identification step. This fourth step uses the previously computed
features to identify the unknown chromosome. If the unknown chromosome is known to
be normal, then the chromosome identification box is a classifier, and its output is one of
3
Chapter 1 Introduction
the 24 possible chromosome indexes (1,..., 22, X, Y). The classifier use a training set to
perform this classification. On the contrary, if the unknown chromosome is possibly
abnormal, then additional information about the abnormality is provided to the
chromosome identification box, and its output is a mapping of the abnormal
chromosome. This additional information is obtained from a modern color imaging
system, which is able to detect the existence of some abnormalities, but requires an
analysis of the chromosome bands to perform a complete identification.
Normal
training
samples
1
Unknown
banded
chromosome
image
Image quality
improvement
2
Chromosome
segmentation
Information
about a possible
abnormality
3
Feature
extraction
4
Chromosome
identification
Identified
chromosome
segments
Figure 1.1: Major steps of chromosome identification
1.3
Main contributions
Contributions have been made to the steps 2 and 3 of Figure 1.1 in order to perform
an initial efficient feature extraction process with the banded chromosome images
provided by the Genome Institute of Singapore. Then, two major contributions are
proposed to the fourth step in order to identify normal and abnormal chromosomes.
Firstly, a normal chromosome classifier has been developed in order to strongly reduce
the number of necessary training samples. Secondly, a new procedure is proposed to map
4
Chapter 1 Introduction
abnormal chromosomes by combining the classical banding analysis with information
obtained with the Spectral Karyotyping (SKY) system.
1.3.1
Normal chromosome classification
Chromosomes are non-rigid objects, and their banding patterns are difficult to
compare because of their different elongations. A section of a chromosome can be more
contracted or on the contrary more elongated than the rest of the same chromosome. As a
consequence, the comparison of chromosome banding patterns with some pre-computed
reference patterns is not straightforward because the bands do not line up correctly. This
study proposes to solve the problem by using the dynamic time warping (DTW)
algorithm in order to find an optimum match by stretching the banding patterns. DTW
systems are well known for their application in automatic speech recognition systems [4]
to compare an unknown word with a reference word that can be pronounced with
different speeds. DTW algorithm can effectively be applied to the problem of normal
chromosome classification by comparing unknown samples with reference patterns. The
main advantage of this method is that it requires a much smaller training set in
comparison with the conventional methods based on Bayesian classifiers or Neural
Networks. This is because they have to learn from the training samples all the possible
elongations that can appear for each chromosome. On the contrary, the reference patterns
necessary to the DTW-based classifier can be computed from a few training samples. In
other words, the DTW algorithm transfers the knowledge that chromosomes are non-rigid
objects from the training set to the classifier itself. In this study, a classifier based on
dynamic time warping (DTW) has been developed to perform the classification of human
5