Molecular Markers Useful for Detecting Resistance to Brown Stem Rot in Soybean
Bạn đang xem bản rút gọn của tài liệu. Xem và tải ngay bản đầy đủ của tài liệu tại đây (356.02 KB, 8 trang )
Molecular Markers Useful for Detecting Resistance to Brown Stem Rot in Soybean
K. L. E. Klos, M. M. Paz, L. Fredrick Marek, P. B. Cregan, and R. C. Shoemaker*
ABSTRACT
1989). Other resistance genes may exist. Multiple genes
may control BSR resistance in Asgrow A3733 which are
not derived from known sources of resistance (Waller et
al., 1991). Nelson et al. (1989) identified three resistant
lines: PI 424.285A; PI 424.353; and PI 424.611A from
more than 3400 accessions from the USDA Soybean
Germplasm Collection. Bachman et al. (1997) screened
559 soybean accessions from China and found 13 accessions with resistance to BSR. Most of the publicly released BSR resistant cultivars and breeding lines are
derived from PI 84946-2, including BSR101 which has
the Rbs3 allele (Eathington et al., 1995). Under conditions where P. gregata infection affects yield, Sebastian
et al. (1985) found that in soybean lines derived mostly
from PI 84946-2, BSR resistance was associated with a
12 to 16% yield advantage.
Molecular markers close to a gene of interest may be
useful for selection in breeding programs, especially for
agronomic traits which are difficult to analyze, e.g., disease resistance, insect resistance, and quantitative traits
(Lawson et al., 1997; Mohan et al., 1997; Heer et al.,
1998). Selection of genotypes resistant to BSR by inoculating plants with isolates of P. gregata is laborious and
time-consuming. Moreover, assessment of BSR incidence is rendered difficult by seasonal and environmental variation (Nicholson et al., 1973). Soybean breeding
efforts to transfer BSR resistance to improved cultivars
or soybean lines have been hampered by the low heritability (h2 ϭ 0–0.38) of the trait (Sebastian et al., 1985).
Several examples of the application of molecular markers in breeding programs have been presented. Simple
sequence repeat (SSR) markers have been used for assessing heterosis in rice breeding (Liu and Wu, 1998).
Random amplified polymorphic DNA (RAPD) and sequence characterized amplified region (SCAR) markers
were utilized to characterize anthracnose resistance in
common bean (Young et al., 1998) and rust resistance
in sunflower (Helianthus annuus L.; Lawson et al., 1998).
Marker-assisted selection (MAS) could facilitate the
development of BSR resistant genotypes. MAS is more
efficient than selection based on the phenotype for a
trait with low heritability (Van Berloo and Stam, 1998).
Gene introgression can readily be followed using molecular markers, which are not influenced by the environmental conditions in which plants are grown. Lewers
et al. (1999) identified and mapped molecular markers
linked with BSR resistance in the soybean cultivar BSR
101. This study is a follow-up to Lewers et al. (1999) in
an attempt to develop breeder-friendly markers. Here
we report the development and evaluation of nine new
Brown stem rot (BSR) causes vascular and foliar damage in soybean [Glycine max (L.) Merr.]. Identification of plants resistant to
BSR by inoculation with Phialophora gregata (Allington & W.W.
Chamberlain) W. Gams is laborious and unreliable because of low
heritability. Molecular markers linked to the resistance gene could
be used to screen for resistant individuals and hasten the development
of BSR resistant genotypes. The objective of this study was to develop
molecular markers for efficient identification of BSR resistant plants
in a breeding program. Seventeen resistant and 29 susceptible cultivars
and plant introductions as well as recombinant inbred lines derived
from a cross between BSR 101 and PI 437.654 were assayed by PCRbased markers derived from RFLPs K375I-1 and RGA2V-1, Satt244,
or developed from bacterial artificial chromosome (BAC) sequences.
The DNA markers that were developed tag the BSR locus and are
informative in a diverse range of soybean germplasm. Markers detected different banding patterns between resistant and susceptible
genotypes. The PCR-based markers will most likely be useful in
screening for BSR resistance and allow soybean breeders to transfer
rapidly resistance derived from Rbs3 to improved cultivars or soybean
lines. The markers are relatively easy-to-use, inexpensive, and highly
informative. Soybean breeding efforts can now be designed to incorporate the use of marker information when parental genotypes possess
contrasting banding patterns.
B
rown stem rot is a devastating fungal disease of
soybean (Glycine max) caused by Phialophora
gregata, a soil-borne fungus. The pathogen infects host
plants through the roots and causes vascular and foliar
injury to the susceptible plants (Allington and Chamberlain, 1948; Mengistu and Grau, 1986). The disease is
prevalent in soybean producing regions of the northern
USA and Canada (Sinclair and Backman, 1989) and has
been estimated to cause a yield reduction of over 20
million bushels each year in the north central states
alone, depending upon environmental conditions
(Doupnik, 1993).
Host resistance is the main means of controlling BSR.
Plant introductions (PIs) have been identified as sources
of non-allelic BSR resistance genes: PI 84946-2 for Rbs1
(Sebastian and Nickell, 1985) and Rbs3 alleles (Eathington et al., 1995); PI 437.833 for Rbs2 (Hanson et al.,
1988); and PI 437.970 for Rbs3 (Willmot and Nickell,
K.L.E. Klos, M.M. Paz and L. Fredrick Marek, Dep. of Agronomy,
Iowa State Univ., Ames, IA 50011; R.C. Shoemaker, USDA-ARSCICGR and Dep. of Agronomy and Dep. of Zoology/Genetics, Iowa
State Univ., Ames, IA 50011; P.B. Cregan, USDA-ARS, Soybean
and Alfalfa Research Lab., Beltsville, MD 20705. Research supported
by Iowa Soybean Promotion Board. Contribution of the North Central
Region USDA-ARS, Project 3236 of the Iowa Agric. and Home
Economics Stn. (Journal Paper no. J-18668), Ames, IA 50011-1010.
Names are necessary to report factually on the available data; however, the USDA neither guarantees nor warrants the standard of the
product, and the use of the name by the USDA implies no approval
of the product to the exclusion of others that may also be suitable.
Received 19 Nov. 1999. *Corresponding author ().
Abbreviations: BSR, brown stem rot; MAS, marker-assisted selection;
PCR, polymerase chain reaction; PI, plant introduction; RAPD, random amplified polymorphic DNA; RFLP, restriction fragment length
polymorphism; RIL, recombinant inbred line; SSR, simple sequence repeat.
Published in Crop Sci. 40:1445–1452 (2000).
1445
1446
CROP SCIENCE, VOL. 40, SEPTEMBER–OCTOBER 2000
Table 1. BSR resistant and susceptible germplasm analyzed for
the nine PCR-based markers. The allele(s) responsible for BSR
resistance is given in parentheses when known.
BSR resistant
genotypes†
Acme
Amsoy
Anoka
Archer
BSR 101
BSR 201
BSR 301
BSR 302
Elgin 87
Grant
IA 2008
IA 3004
IA 1006
L78-4094
PI 437.833
PI 437.970
PI 84946-2
[Allele(s)]
(Rbs3)
(Rbs3)
(Rbs3)
(Rbs3)
(Rbs3)
(Rbs3)
(Rbs1)
(Rbs2)
(Rbs3)
(Rbs1 and Rbs3)
BSR susceptible
BSR susceptible
genotypes†
ancestral genotypes†
A3127
Adams
Beeson
Blackhawk
Bonus
Calland
Capital
Century
Clark
Corsoy
Dorman
Elgin
Ford
Hawkeye
Hood
IA 2021
Iroquois
Kent
Kenwood
Parker
Pella
PI 437.654
Shelby
Sturdy
Wayne
Lincoln
Mandarin Ottawa
Ogden
Roanoke
† The Germplasm Resources Information Network (GRIN), 1999.
DNA markers that can detect BSR resistance in a diverse range of soybean germplasm and discuss their
utility in soybean breeding programs.
MATERIALS AND METHODS
Genomic DNA Extraction
Forty-six BSR resistant or susceptible genotypes (Table
1) were identified by querying GRIN data [The Germplasm
Resources Information Network (GRIN), 1999] through SoyBase ACEDB version 4.3 ( />WebAce/webace?dbϭsoybase; verified April 26, 2000). Most
BSR resistant genotypes were derived from PI 84946-2 and
possess the Rbs3 or Rbs1 allele. Cultivars and PIs with other
sources of resistance were also included (Table 1). Seed for
each genotype was obtained from R. Nelson, curator of the
USDA Soybean Germplasm Collection, Urbana, IL, or from
the R. Shoemaker laboratory, Dept. of Agronomy, Iowa State
University, Ames, IA. Seedlings were grown in the greenhouse
and DNA was isolated by a method adapted from SaghaiMaroof et al. (1984). The first trifoliate was harvested, freezedried, and ground. The DNA was extracted from 750 mg dried
tissue with CTAB buffer followed by chloroform:isoamyl alcohol (24:1) separation and precipitated with 2/3 volume isopropanol, rinsed with 80% (v/v) ethanol:15 mM ammonium acetate solution. After being air-dried, the DNA was resuspended
in 1ϫ TE (Tris-EDTA) buffer.
PCR Primer Design
PCR primers were selected from DNA sequences by
OLIGO software (National Biolabs, St. Paul, MN). Oligonucleotide primers for K375.sp1 and BSR3.sp1 were designed
by means of the DNA sequences of RFLP probes K375 and
RGA2, respectively.
The Gm_ISb001 soybean genomic library (Marek and
Shoemaker, 1997) was probed with the K375 RFLP probe to
identify bacterial artificial chromosome (BAC) clones having
homology to the region of interest. The BACs identified were
sequenced from both ends and these sequences were used to
develop primers for PCR. PCR amplification products were
evaluated for fragment size polymorphism between BSR101
and PI437.654. PCR products not polymorphic in amplification
fragment size were screened for restriction site polymorphisms
by restriction enzyme digests. Markers polymorphic between
BSR101 and PI437.654 were considered for further evaluation
of their utility in detecting polymorphism at theRbs3 locus.
Satt244, a SSR marker, was developed according to procedures described in Akkaya et al. (1995) and Cregan et al.
(1999). Soybean SSRs were developed both from SSR containing sequences available in GenBank and from genomic
subclones of Williams soybean DNA. SSR containing subclones were identified by colony hybridization screening using
labeled oligonucleotide probes. Positive clones were rescreened and then sequenced to locate the SSR. Primers were
developed for more than 600 SSR markers including Satt244.
The primers were tested against Williams DNA and 10 additional soybean genotypes. Primers that identified a polymorphism between G. max (A81-356022) and G. soja (PI 468.916)
were mapped in a F2-derived mapping population. Because
Satt244 mapped to a region of linkage group J identified by
Lewers et al. (1999) to be significantly correlated with BSR
resistance in BSR101, it was chosen for further testing to
screen for resistance in a wide range of germplasm.
PCR Reaction Conditions
PCR reactions for the BSR3.sp1, K375.sp1, 14H13.sp1,
21E22.sp1, 21E22.sp2, 30L19.sp1, 35E22.sp1, and 98P22.sp2
markers were carried out in a 20-L reaction mixture containing 60 ng of genomic DNA, 0.5 M of each primer, 1ϫ
Gibco-BRL PCR buffer, 1.5 mM MgCl2, 100 M each of
dGTP, dTTP, dATP and dCTP, 0.5 U Taq Polymerase (GibcoBRL), and 0.5ϫ SCR dye [6% (w/v) sucrose, 100 M cresol
red]. The PCR conditions for BSR3.sp1 and 35E22.sp1 consisted of 94ЊC for 2 min followed by 35 cycles of 94ЊC for
1 min (denaturation), 58ЊC for 45 s (annealing), 72ЊC for 1 min
(extension), and a final extension at 72ЊC for 5 min. PCR
conditions for K375.sp1, 14H13.sp1, 21E22.sp1, 21E22.sp2,
30L19.sp1, and 98P22.sp2 were as described above with the
exception of the annealing temperatures which were as follows: for K375.sp1, 14H13.sp1 and 30L19.sp1 the annealing
temperature was 56ЊC; and for 21E22.sp1, 21E22.sp2, and
98P22.sp1 it was 62ЊC. Amplification products of 14H13.sp1,
21E22.sp1, 21E22.sp2, 30L19.sp1, 35E22.sp1, and 98P22.sp2
were digested with RsaI, MspI, HhaI, Hsp92II, HhaI, and
EcoRI restriction enzymes, respectively, at 2 U/L for 1.5 h
at 37ЊC.
SSR analyses were carried out in 20-L reactions with 60 ng
of genomic DNA, 0.15 M of each primer, 1ϫ Gibco-BRL
PCR buffer, 2 mM MgCl2, 200 M each of dGTP, dTTP,
dATP and dCTP, 0.75 U Taq Polymerase (Gibco-BRL), and
0.5ϫ SCR dye [6% (w/v) sucrose, 100 M cresol red). The
thermal cycling conditions for the SSR assay were 94ЊC for
1 min followed by 45 cycles of 94ЊC for 30 s, 47ЊC for 30 s,
and 68ЊC for 30 s.
Amplification and digestion products of these markers were
separated using a 2% (w/v) agarose gel in 1ϫ TAE (Tris/
acetate/EDTA) and visualized by ethidium bromide staining.
The samples were electrophoresed for 3 h at 90 V.
Molecular Marker Evaluation
PCR and enzyme digest products were compared to determine the efficacy of distinguishing BSR resistance in different
KLOS ET AL.: MARKER-ASSISTED SELECTION IN SOYBEAN
1447
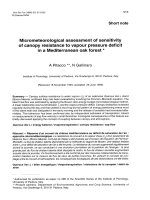
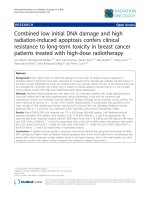
Fig. 1. Soybean Linkage Group J from the BSR101 by PI437.654 recombinant inbred line population showing: A. Marker association with brown
stem rot resistance as measured by foliar disease severity, and B. Map locations of new markers in relation to RGA2V-1 and K375I-1.
Associations are illustrated by a curve from QTL Cartographer. The horizontal bar indicates significance at P ϭ 0.05. Adapted from Lewers
et al. (1999).
cultivars and PIs. Restriction enzyme recognition site polymorphisms and polymorphic amplification products were observed between the parents of several mapping populations
including the parents of the population segregating for brown
stem rot resistance, BSR 101 and PI 437.654. The gene diver-
sity of a locus, defined by Weir (1990) as the amount of polymorphism in homozygous progeny of a self-fertilizing species,
has been used as an estimator of the polymorphism information content (PIC) value of a molecular marker (Anderson et al.,
1992). The PIC value of a PCR-based marker was calculated as
1448
CROP SCIENCE, VOL. 40, SEPTEMBER–OCTOBER 2000
Table 2. Primer sequences for DNA markers associated with BSR resistance
Marker
BSR3.sp1
K375.sp1
14H13.sp1
21E22.sp1
21E22.sp2
30L19.sp1
35E22.sp1
98P22.sp2
Satt244
Primer 1
Primer
5-CGATTGGTTTGGTTCTGGC-3
5-ACCATTAGGACTGAGTTTG-3
5-GTCACACACAAATTCACTAG-3
5-GCTTTTGCTCCGTTCAAGTCC-3
5-GCTTTTGCTCCGTTCAAGTCC-3
5-GAAGCTAATACGCCATAAAC-3
5-ACACTGTTTGGGACCGAATCA-3
5-TGGAGATCATTGGCTGT-3
5-GCGCCCCATATGTTTAAATTATATGGAG-3
5-TTTCATATAGCATGGATCAAC-3
5-GCTTGAATAGCGATCCTTC-3
5-TGGGTGTAGTCCGGGTTG-3
5GGCCACTCTCACCGATCT-3
5-GGCCACTCTCACCGATCT-3
5-CTTCACAGTCCCTTTTCAC-3
5-ATAGAAGAGCCCATCCGATAA-3
5-ACTGAAAGGTCGGGTAAA-3
5-GCGATGGGGATATTTTCTTTATTATCAG-3
adapted by Weir (1990, p. 125) from Nei (1987, p. 106–107):
1Ϫ
n
͚ P ij2
jϭ1
where Pij is the frequency of the jth PCR pattern for Genotype i.
In addition, PCR analyses using all nine markers were done
on a recombinant inbred line (RIL) population derived from
a cross between BSR 101 and PI 437.654 (Baltazar and Mansur,
1992) which are resistant and susceptible to BSR, respectively.
RILs were screened for BSR resistance by Lewers et al. (1999).
For mapping purposes, the banding patterns in the parental
genotypes and in the RILs were scored as A or B in 320 RILs.
The markers were added to the map reported by Lewers et
al. (1999) by Mapmaker 2.0 with the default parameters LOD
3.0 and maximum recombination of 30%. The ‘TRY’ and the
‘RIPPLE’ commands were used to confirm the map (minimum
LOD score of 2.0, window size of 3).
RESULTS
Marker Identification
The method of location-specific molecular marker
development, utilizing DNA sequences from RFLP
probes and BACs, was successful at generating markers
which mapped to the region of interest on soybean linkage group J (Fig. 1B). Twenty-nine PCR primer sets
developed from BAC end sequences were discarded
from further evaluation in this study due to lack of
polymorphism between BSR101 and PI437.654. The
markers BSR3.sp1, and K375.sp1 (Table 2), developed
from RFLP probe sequences were polymorphic in PCR
amplification size between BSR101 and PI437.654. Two
PCR primer sets developed from BAC sequences were
observed to amplify fragments polymorphic in size between BSR101 and PI437.654 (data not shown), but
these polymorphisms were not reproducible under stringent PCR conditions and so were discarded from further evaluation. Polymorphism between BSR101 and
PI437.654 was observed in six markers (14H13.sp1,
21E22.sp1, 21E22.sp2, 30L19.sp1, 35E22.sp1, and
98P22.sp2) developed from BAC end sequences after
restriction enzyme digest of the PCR product (Table
2). This study demonstrates the utility of BAC library
sequences in conjunction with an experimental population segregating for the gene of interest as a source of
new markers that are polymorphic among a large group
of genotypes.
Segregation Analysis
RILs derived from a cross between BSR 101 and
PI 437.654 were analyzed to confirm the usefulness of
markers to monitor BSR resistance during inbreeding,
i.e., to confirm linkage with Rbs3. A total of 320 RILs
were assayed with BSR3.sp1, K375.sp1, 14H13.sp1,
21E22.sp1, 21E22.sp2, 30L19.sp1, 35E22.sp1, 98P22.sp2,
and Satt244. The marker scores were used to map the
nine new markers against one another and to place them
in relation to the molecular genetic map reported by
Lewers et al. (1999) with the same set of RILs. Lewers
et al. (1999) mapped markers associated with one major
and one minor QTL in linkage group J (Fig. 1A). A
major gene (Rbs3) and a second gene with a minor
effect control BSR resistance in BSR101 (Eathington
et al., 1995). We believe that markers identified in this
study are at the major QTL (Rbs3 ) that was mapped by
Lewers et al. (1999) between RGA2V-1 and G8.15V-1
of linkage group J (Fig. 1). BSR3.sp1 was mapped near
marker RGA2V-1. The K375.sp1, 14H13.sp1, 21E22.
sp1, 21E22.sp2, 30L19.sp1, 35E22.sp1, and 98P22.sp2
markers mapped within the cluster of markers
AAGATG152E, AAGATG152M, K375I-1, and
ACAAGT260. Satt244 was mapped near the RFLP
markers K005V-2 and G815V-1. All of these markers
are in the region of linkage group J identified to have the
maximum correlation with BSR resistance controlled
byRbs3, in BSR 101 (Fig. 1; Lewers et al., 1999).
The BSR3.sp1, K375.sp1, 14H13.sp1, 21E22.sp1,
21E22.sp2, 30L19.sp1, 35E22.sp1, 98P22.sp2, and
Satt244 markers were successful at differentiating
among resistant and susceptible RILs. Three hundred
twenty RILs were inoculated with Phialophora gregata
in a glasshouse by Lewers et al. (1999) and rated for
foliar disease severity from 0 (healthy) to 10 (all leaflets
dead or missing). We compared their foliar severity
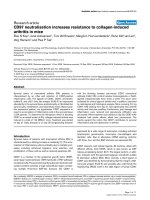
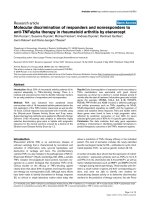
results with our marker evaluation of the RIL population. Figure 2 shows the number of RILs within each
BSR disease rating that were scored for the ‘A’ allele
(derived from the resistant parent) or the ‘B’ allele. This
figure indicates the number of RILs which would have
been incorrectly classified as resistant by the marker
allele score as the selection criteria. For example
BSR3.sp1 identified 148 RILs as potentially resistant
on the basis of the ‘A’ allele, but 41 of these have disease
severity ratings of 5 or greater (susceptible to highly
susceptible). 30L19.sp1 identified 132 potentially resistant RILs, and 34 of these were rated 5 or greater in
the greenhouse disease severity screen. A set of 44 RILs
was identified as highly resistant and a set of 49 RILs
as highly susceptible to BSR based on foliar symptoms
in relation to the parental genotypes (Lewers et al.,
1999). These markers were able to identify highly resis-
KLOS ET AL.: MARKER-ASSISTED SELECTION IN SOYBEAN
1449
Fig. 2. BSR foliar disease severity ratings (0 ϭ healthy to 10 ϭ most severe) (x axis) and the number of RILs possessing the ‘A’ allele or the
‘B’ allele ( y axis) for BSR markers BSR3.sp1, K375.sp1, 14H13.sp1, 21E22.sp1, 21E22.sp2, 30L19.sp1, 35E22.sp1, 98P22.sp2, and Satt244. The
‘A’ allele corresponds to that derived from the resistant parent. The ‘B’ allele corresponds to that derived from the sensitive parent.
1450
CROP SCIENCE, VOL. 40, SEPTEMBER–OCTOBER 2000
Table 3. Polymorphism information content (PIC) values and
frequency of BSR101 parental allele (‘A’) in 44 recombinant
inbred lines scored as highly resistant to brown stem rot on
the basis of foliar symptoms; the frequency of PI437.654 parental allele (‘B’) in 49 lines scored as highly susceptible, for nine
DNA markers on the basis of 46 genotypes.
Marker
PIC
Frequency of ‘A’ in
resistant RILs
Frequency of ‘B’ in
susceptible RILs
BSR3.sp1
K375.sp1
14H13.sp1
21E22.sp1
21E22.sp2
30L19.sp1
35E22.sp1
98P22.sp2
Satt244
0.38
0.52
0.49
0.38
0.39
0.34
0.36
0.27
0.57
0.91
0.98
0.95
0.98
0.98
0.98
0.95
0.98
0.93
0.86
0.96
0.96
0.98
0.98
0.96
0.98
0.93
0.98
tant genotypes with an accuracy of 90% or greater, and
susceptible genotypes with a greater than 85% accuracy
(Table 3). These markers will be particularly useful for
monitoring soybean populations segregating for Rbs3.
Evaluation in Soybean Germplasm
The DNA markers, BSR3.sp1, K375.sp1, 14H13.sp1,
21E22.sp1, 21E22.sp2, 30L19.sp1, 35E22.sp1, 98P22.sp2,
and Satt244, which were developed on the basis of polymorphism between BSR101 and PI437.654, were evaluated in a set of cultivars, PIs, and ancestral genotypes
identified as resistant or susceptible to brown stem rot
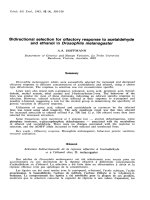
on the basis of GRIN data (Fig. 3). The markers differed
in the degree of polymorphism observed among the set
of genotypes evaluated. The PIC values (Table 3) signify
the possible usefulness of the markers as a means of
detecting a polymorphism between two soybean cultivars. The largest PIC value was observed for Satt244
and the smallest for 98P22.sp2. A larger PIC value indicates a greater likelihood that polymorphism will be
observed between any two genotypes. In a soybean
breeding program to transfer BSR resistance due to the
Rbs3 gene, a susceptible cultivar could be used as one
parent and a resistant cultivar with a dissimilar PCR
banding pattern could be used as the other parent. The
Fig. 3. Amplification banding patterns of BSR3.sp1, K375.sp1, 14H13.sp1, 21E22.sp1, 21E22.sp2, 30L19.sp1, 35E22.sp1, 98P22.sp2, and Satt244
markers in 46 soybean cultivars and PIS which are resistant or susceptible to BSR .
KLOS ET AL.: MARKER-ASSISTED SELECTION IN SOYBEAN
marker 35E22.sp1 had the second lowest PIC value, yet
it is apparent in a comparison of the banding patterns
of resistant and susceptible genotypes that this marker
may, along with 21E22.sp1, 21E22.sp2, and 30L19.sp1,
be one of the most useful as predictor of resistance in
a germplasm screening program (Fig. 3). None of the
markers differentiated among the different genes for
BSR resistance. Many of the BSR resistant soybean
lines included in this study have theRbs3 allele (Table
1). Soybean lines L78-4049 and PI 437.833 have BSR
resistance alleles Rbs1 and Rbs2, respectively; and PI
84946-2 has both Rbs1 and Rbs3 (Eathington et al., 1995;
Hanson et al., 1988; Willmot and Nickell, 1989; Sebastian and Nickell, 1985). The source of BSR resistance
in the remainder of the lines is unknown, but may be
due to the presence of one or more alleles for BSR
resistance, possibly including Rbs3. No marker or combination of markers from this set could be identified which
would differentiate among resistant lines with different
alleles (Fig. 3). Therefore, the use of these markers in
a breeding program for BSR resistance requires a parent
whose resistance is known to be due to the Rbs3 gene,
or a test of linkage between resistance and the marker
in the segregating progeny. For example, a marker
screening program in the progeny of a cross between
L78-4094 and any of the susceptible genotypes in Fig.
3, determined on the basis of the polymorphic 35E22.sp1
marker, would not select BSR resistant lines because
L78-4094 is resistant due to the Rbs1 allele (Table 1).
The greenhouse or field screening procedure for evaluating BSR resistance involves inoculating plants with
the causal pathogen and obtaining foliar and stem ratings for disease severity. This method is lengthy, often
involves destructive sampling, and disease symptoms
are affected by environmental conditions. Our objective
was to develop breeder-friendly markers for efficient
identification of BSR resistant plants in any soybean
population possessing one of the major BSR resistance
genes. The markers developed in this study will most
likely be useful for screening BSR resistance and allow
soybean breeders to rapidly transfer resistance derived
from Rbs3 to improved cultivars or new and improved
soybean lines. The markers described here are easy-touse, inexpensive, and highly informative. These markers
may also be used to more precisely identify the location
of the resistance gene for the purpose of map-based
cloning.
ACKNOWLEDGMENTS
The authors want to thank Dr. Kim S. Lewers and Clay
Baldwin for their help in developing the PCR assay of
K375.sp1 marker.
REFERENCES
Akkaya, M.S., R.C. Shoemaker, J.E. Specht, A.A. Bhagwat, and P.B.
Cregan. 1995. Integration of simple sequence repeat DNA markers
into a soybean linkage map. Crop Sci. 35:1439–1445.
Allington, W.B., and D.W. Chamberlain. 1948. Brown stem rot of
soybean. Phytopathology 38:793–802.
Anderson, J.A., G.A. Churchill, J.E. Autrique, S.D. Tanksley, and
M.E. Sorrells. 1992. Optimizing parental selection for genetic linkage maps. Genome 36:181–186.
1451
Bachman, M.S., C.D. Nickell, P.A. Stephens, and A.D. Nickell. 1997.
Brown stem rot resistance in soybean germ plasm from central
China. Plant Dis. 81:953–956.
Baltazar, M.B., and L. Mansur. 1992. Identification of restriction fragment length polymorphism (RFLPs) to map soybean cyst nematode
resistance genes in soybean. Soybean Genet. Newsl. 19:120–122.
Cregan, P.B., T. Jarvik, A.L. Bush, R.C. Shoemaker, K.G. Lark, A.L.
Kahler, N. Kaya. T.T. VanToai, D.G. Lohnes, J. Chung, and J.E.
Specht. 1999. An integrated genetic linkage map of the soybean
genome. Crop Sci. 39:1464–1490.
Doupnik, B. 1993. Soybean production and disease loss estimates for
North Central United States from 1989 to 1991. Plant Dis. 77:
1170–1171.
Eathington, S.R., C.D. Nickell, and L.E. Gray. 1995. Inheritance of
brown stem rot resistance in soybean cultivar BSR 101. J.
Hered. 86:55–60.
The Germplasm Resources Information Network (GRIN). 1999. National plant germplasm system (NPGS) [Online]. Available at
(verified April 26, 2000).
Hanson, P.M., C.D. Nickell, L.E. Gray, and S.A. Sebastian. 1988.
Identification of two dominant genes conditioning brown stem rot
resistance in soybean. Crop Sci. 28:41–43.
Heer, J.A., H.T. Knap, R. Mahalingam, E.R. Shipe, P.R. Arelli, and
B.F. Matthews. 1998. Molecular markers for resistance to Heterodera glycines in advanced soybean germplasm. Mol. Breed. 4:
359–367.
Lawson, D.M., C.F. Lunde, and M.A. Mutschler. 1997. Marker-assisted transfer of acylsugar-mediated pest resistance from the wild
tomato, Lycopersicon pennellii, to the cultivated tomato Lycopersicon esculentum. Mol. Breed. 3:307–317.
Lawson, W.R., K.C. Goulter, R.J. Henry, G.A. Kong, and J.K. Kochman. 1998. Marker-assisted selection for two rust resistance genes
in sunflower. Mol. Breed. 2:227–234.
Lewers, K.S., E.H. Crane, C.R. Bronson, J.M. Schupp, P. Keim, and
R.C. Shoemaker. 1999. Detection of linked QTL for soybean brown
stem rot resistance in ‘BSR 101’ as expressed in growth chamber
environment. Mol. Breed. 5:33–42.
Liu, X.C., and J.L. Wu. 1998. SSR heterogenic patterns of parents
for marking and predicting heterosis in rice breeding. Mol.
Breed. 4:263–268.
Marek, L. Fredrick, and R.C. Shoemaker. 1997. BAC contig development by fingerprint analysis in soybean. Genome 40: 420–427.
Mengistu, A., and C.R. Grau. 1986. Variation in morphological, cultural, and pathological characteristics of Phialophora gregata and
Acremonium sp. recovered from soybean in Wisconsin. Plant
Dis. 70:1005–1009.
Mohan, M., S. Nair, A. Bhagwat, T.G. Krishna, M. Yano, C.R. Bhatia,
and T. Sasaki. 1997. Genome mapping, molecular markers and
marker-assisted selection in crop plants. Mol. Breed. 3:87–103.
Nei, M. 1987. Molecular evolutionary genetics. Columbia University
Press, New York.
Nelson, R.L., C.D. Nickell, J.H. Orf, H. Tachibana, E.T. Gritton, C.R.
Grau, and B.W. Kennedy. 1989. Evaluating soybean germplasm
for brown stem rot resistance. Plant Dis. 73:110–114.
Nicholson, J.F., J.B. Sinclair, and P.N. Thapliyal. 1973. The effect of
rate of planting on incidence of brown stem rot in soybean. Plant
Dis. Rep. 57:269–271.
Saghai-Maroof, M.A., K.M. Soliman, R.A. Jorgenson, and R.W. Allard. 1984. Ribosomal DNA spacer length polymorphism in barley:
Mendelian inheritance, chromosomal location and population dynamics. Proc. Natl. Acad. Sci. (USA) 81:8014–8018.
Sebastian, S.A., and C.D. Nickell. 1985. Inheritance of brown stem
rot in soybeans. J. Hered. 74:194–198.
Sebastian, S.A., C.D. Nickell, and L.E. Gray. 1985. Efficient selection
for brown stem rot resistance in soybeans under greenhouse screening conditions. Crop Sci. 25:753–757.
Sinclair, J.B., and P.A. Backman (ed.) 1989. Compendium of soybean
diseases. APS, St. Paul, MN.
Van Berloo, R., and P. Stam. 1999. Comparison between markerassisted selection and phenotypical selection in a set of Arabidopsis
thaliana recombinant inbred lines. Theor. Appl. Genet. 98:113–118.
Waller, R.S., C.D. Nickell, D.L. Drzycimski, and J.E. Miller. 1991.
1452
CROP SCIENCE, VOL. 40, SEPTEMBER–OCTOBER 2000
Genetic analysis of the inheritance of brown stem rot resistance
in the soybean cultivar Asgrow A3733. J. Hered. 82:412–417.
Weir, B.S. 1990. Genetic data analysis: Methods for discrete genetic
data. Sinauer Assoc. Inc., Sunderland, MA.
Willmot, D.B., and C.D. Nickell. 1989. Genetic analysis of brown
stem rot resistance in soybean. Crop Sci. 29:672–674.
Young, R.A., M. Melotto, R.O. Nodari, and J.D. Kelly. 1998. Markerassisted dissection of the oligogenic anthracnose resistance in the
common bean cultivar, ‘G 2333’. Theor. Appl. Genet. 96:87–94.
Simple Sequence Repeat Diversity among Soybean Plant Introductions
and Elite Genotypes
James M. Narvel, Walter R. Fehr,* Wen-Chy Chu, David Grant, and Randy C. Shoemaker
ABSTRACT
The use of molecular markers to facilitate the introgression of
plant introduction (PI) germplasm into elite soybean [Glycine max
(L.) Merr.] cultivars will depend on the amount of polymorphism that
exists between elite genotypes and PIs. The objective of this study
was to assess the simple sequence repeat (SSR) diversity of 39 elite
soybean genotypes (Elites) and 40 PIs that were selected for high
yield potential. A total of 397 alleles were detected among the 79
genotypes at 74 SSR marker loci. The number of alleles detected
among the PIs was 30% greater than that detected among the Elites.
There were 138 alleles specific to the PIs that occurred across 60 SSR
loci and 32 alleles specific to the Elites that occurred across 27 SSR
loci. Average marker diversity among the PIs was 0.56 and ranged
from 0.0 to 0.84. Average marker diversity among the Elites was 0.50
and ranged from 0.0 to 0.79. Genetic similarity estimates based on
simple matching coefficients revealed more genetic diversity among
the PIs than among the Elites. The greatest genetic diversity was
between the PIs and Elites. The ability of SSRs to distinguish among
elite soybean genotypes and PIs with agronomic merit may assist with
the transfer of favorable alleles from PIs into elite soybean cultivars.
T
he limited genetic base of North American soybean cultivars is due to the contribution of fewer
than 20 plant introductions (PIs) to the primary gene
pool and to the repeated use of related parents in breeding programs (Gizlice et al., 1994). Expanding the genetic base of soybean may introduce unique favorable
alleles for polygenic traits. It is not possible at present to
evaluate directly alleles for polygenic traits in soybean;
therefore, incorporation of PIs with agronomic merit
into breeding programs has been used as an alternative
strategy (Thorne and Fehr, 1970; Vello et al., 1984;
Thompson and Nelson, 1998). It is not known if selection
of PIs for agronomic potential affects their diversity
relative to elite germplasm. Because most PIs have no
known pedigree, the genetic diversity among PIs or between PIs and elite genotypes (Elites) cannot be estimated by a coefficient of parentage analysis.
DNA marker analysis is an alternative method of
J.M. Narvel and W.R. Fehr, Dep. of Agronomy; Wen-Chy Chu, DNA
Sequencing and Synthesis Facility; and David Grant and R.C. Shoemaker, USDA-ARS-CICG, Dep. of Agronomy, Iowa State University, Ames, IA 50011. Journal Paper No. 18637 of the Iowa Agric.
and Home Econ. Exp. Stn., Ames, IA 50011. Project No. 3107, and
supported by the Hatch Act, the State of Iowa, and the Iowa Soybean
Promotion Board. Received 13 Oct. 1999. *Corresponding author
().
Published in Crop Sci. 40:1452–1458 (2000).
estimating the diversity of PIs that are candidates as
parents in a breeding program. The hypothesis is that
the more genetically diverse the PIs are from the elite
parents, the more likely they are to possess unique alleles for traits of interest. Several studies have measured
the diversity of PIs and Elites with restriction fragment
length polymorphism (RFLP) markers. Greater diversity has been detected in PIs than in Elites, but the level
of polymorphism has been low (Keim et al., 1989; Keim
et al., 1992). Amplified fragment length polymorphic
(AFLP) and random amplified polymorhpic DNA
(RAPD) markers have been shown to be more polymorphic in soybean than RFLPs (Powell et al., 1996).
Maughan et al. (1996) used 15 primer pairs for AFLP
analysis of a broad sample of 23 soybean accessions
including G. max and wild (Glycine soja Sieb. and Zucc.)
genotypes. Of the 759 AFLP fragments detected in their
study, 36% were polymorphic across all genotypes.
Within the group of G. soja genotypes, 31% were polymorphic. Only 17% were polymorphic within the G.
max group that included four PIs and 12 elite genotypes.
Thompson et al. (1998) used 125 primers for RAPD
analysis of 18 soybean ancestral lines and 17 PIs of
Maturity Group I to III that were selected for their
seed yield. They reported that 34% of the amplified
fragments detected were polymorphic across the 35 genotypes and indicated that this marker system may be
useful for introgressing favorable alleles from PIs into
elite breeding populations.
Simple sequence repeat (SSR) DNA markers have
been shown to be highly polymorphic in soybean (Akkaya et al., 1992; Diwan and Cregan, 1997). SSRs are
composed of a 1- to 6-base pair (bp) DNA sequence
that is repeated a variable number of times. SSRs are
amplified by PCR with primers that are complementary
to the conserved sequences that flank an SSR locus.
Polymorphic fragments (alleles) resulting from variations in SSR repeat length are separated electrophoretically to display genetic profiles of individuals. SSR alleles typically show monogenic-codominant inheritance
that enables classification of homozygotes and heterozygotes in a segregating population.
Akkaya et al. (1992) used several types of SSRs to
Abbreviations: AFLP, amplified fragment length polymorphism; bp,
base pair; cM, centimorgan; LG, linkage group; MG, maturity group;
RAPD, random amplified polymorphic DNA; QTL, quantitative trait
loci; SMC, simple matching coefficient; SSR, simple sequence repeat.