Beyond mean field dynamics of two mode bose hubbard model with linear coupling ramping
Bạn đang xem bản rút gọn của tài liệu. Xem và tải ngay bản đầy đủ của tài liệu tại đây (1.15 MB, 92 trang )
BEYOND MEAN-FIELD DYNAMICS OF
TWO-MODE BOSE-HUBBARD MODEL
WITH LINEAR COUPLING RAMPING
CHENG KOK CHEONG
NATIONAL UNIVERSITY OF SINGAPORE
2014
BEYOND MEAN-FIELD DYNAMICS OF
TWO-MODE BOSE-HUBBARD MODEL
WITH LINEAR COUPLING RAMPING
CHENG KOK CHEONG
(B.Sc. (Hons), NUS )
A THESIS SUBMITTED
FOR THE DEGREE OF MASTER OF SCIENCE
DEPARTMENT OF PHYSICS
NATIONAL UNIVERSITY OF SINGAPORE
2014
DECLARATION
I hereby declare that the thesis is my original work and it has been
written by me in its entirety.
I have duly acknowledged all the sources of information which have been
used in the thesis.
This thesis has also not been submitted for any degree in any university
previously.
Cheng Kok Cheong
June 4, 2014
Name
:
Degree
:
Supervisor(s) :
Department
:
Thesis Title
:
:
Cheng Kok Cheong
Master of Science
Associate Professor Gong Jiangbin
Department of Physics
Beyond Mean-Field Dynamics of Two-Mode Bose-Hubbard
Model with Linear Coupling Ramping
Summary
The mean-field Hamiltonian of two-mode Bose-Hubbard model with real
and imaginary coupling constants demonstrates pitchfork bifurcation in its
phase-space structure within certain interval of real coupling constant. Its
mean-field dynamics have been previously studied by Zhang et al [11]. It
was shown therein that when the real coupling constant is ramped adiabatically towards the pitchfork bifurcation critical point, the classical intrinsic
dynamical fluctuations assist in the selection between the two stable stationary points. Based on this finding, we set out to study the corresponding
quantum Hamiltonian with the real coupling constant ramped linearly. At
very slow ramping, the quantum system is able to resolve the energy difference of the two nearly degenerate lowest energy states. Therefore, it no
longer demonstrates self-trapping as what is predicted by the mean-field
dynamics. Such breakdown of mean-field within dynamical instability is
an example of incommutability between semiclassical and adiabatic limit.
To extend beyond the mean-field level, we employ the Bogoliubov backreaction method and the semiclassical phase space method to understand
how the second and higher order quantum fluctuations alter the system
dynamics. It turns out that both approaches yield good prediction on the
dynamics of population imbalance between the two modes and the fraction
of non-condensed atoms at fast and very slow ramping.
4
Acknowledgment
I am very grateful to Associate Professor Gong Jiangbin for his insightful
and inspiring supervision throughout this master project. Every discussion
with him taught me new physical ideas and cleared my doubts on certain
issues. His insights are always refreshing, and his sensitivity to physical
fallacy is unquestionable. Also, his generosity in letting students explore
physics on their own, yet not too much that they fall, has allowed me to
grow and continuously challenge myself with the right amount of support.
I also immensely appreciate his caring and forgiving nature as he is always
concerned about the future undertaking of his students and showed his understanding when I lost focus on my project at a certain point. Without
him, I would not have realized how much I can accomplish throughout this
journey. I also want to thank Professor Zhang Qi for all his meaningful
and useful input on the subject without which the general objective of the
project would not have been formed.
Last but not least, I will never leave out all physics department personnel who have unconditionally given me advice on all the administrative
procedures with which I was not familiar. These include different requirements for graduation, access to central printing system and most importantly access to the CSE high performance computer which allows me to
carry out various heavy numerical computations. All your help has tremendously shed my burden along the way.
My dearest family and friends, without your emotional support along
my long educational journey, I would not have become a better person.
With your ever-lasting love and support, I am still getting better.
June 4, 2014
5
Contents
1 Introduction
1
2 Quantum and Mean-Field Dynamics of Bose-Hubbard Model 6
2.1 The Bose-Hubbard Hamiltonian . . . . . . . . . . . . . . . . 6
2.1.1 Quantum Energy Spectrum and Eigenstates . . . . . 8
2.1.2 Time-Dependent Quantum Dynamics . . . . . . . . . 11
2.1.3 Non-Abelian Geometry Phase . . . . . . . . . . . . . 13
2.2 Mean-Field Correspondence of
Bose-Hubbard Hamiltonian . . . . . . . . . . . . . . . . . . 17
2.2.1 Classical Stationary Points and Energy Spectrum . . 18
2.2.2 Mean-field Classical Dynamics and Intrinsic Dynamical Fluctuation . . . . . . . . . . . . . . . . . . . . . 20
3 Beyond Mean-Field Dynamics
3.1 Second Order Dynamics . . . . . . . . .
3.2 Effects of Higher Order Moments . . . .
3.2.1 SU(2) Coherent States . . . . . .
3.2.2 Formulation of Method . . . . . .
3.2.3 Simulation Result and Discussion
.
.
.
.
.
.
.
.
.
.
.
.
.
.
.
.
.
.
.
.
.
.
.
.
.
.
.
.
.
.
.
.
.
.
.
.
.
.
.
.
.
.
.
.
.
.
.
.
.
.
.
.
.
.
.
25
25
33
34
37
43
4 Future Work and Development
52
5 Conclusion
62
Appendices
65
A Classical-Quantum Correspondence For Multilevel
A.1 Generalized Coherent States . . . . . . . . . . . . .
A.2 Multimode Lie Algebra . . . . . . . . . . . . . . . .
A.3 Multilevel Lie Algebra and its Coherent States . . .
A.4 Multimode to Multilevel Mapping . . . . . . . . . .
A.4.1 Coherent States Mapping . . . . . . . . . .
6
System
. . . . .
. . . . .
. . . . .
. . . . .
. . . . .
66
66
67
69
71
72
A.4.2 Projector Mapping . . . . . . . . . . . . . . . . . . . 73
A.4.3 Multimode and Multilevel Differential Algebra Mapping . . . . . . . . . . . . . . . . . . . . . . . . . . . 74
A.5 Husimi Distribution and Equation of Motion . . . . . . . . . 77
7
List of Figures
2.1
2.2
2.3
2.4
2.5
2.6
2.7
2.8
Energy spectrum of Hamiltonian (2.1) as a function of R
for N = 10 and 20, ∆ = 0.1 and c = 0.2. The right panel
includes only up to the 6-th lowest eigenvalues. . . . . . . .
Energy difference in ground and first excited state versus N
for different R. ∆ = 0.1 and c = 0.2 . . . . . . . . . . . . . .
Modulus square of the components of ground (blue, square,
solid line) and first excited states (red, circle, dashed line)
in Fock basis for different R. ∆ = 0.1 , c = 0.2 and N = 10.
Quantum evolution of population imbalance expectation value
for different high ramping speeds α. α = 0.001 (black, solid
line), α = 0.01 (red, dashed line) and α = 0.1 (blue, dotted
line). R0 = −0.18, ∆ = 0.1, N = 10 and c = 0.2. . . . . . .
Quantum evolution of population imbalance expectation value
for different low ramping speeds α. α = 0.000001 (black,
solid line), α = 0.00001 (red, dashed line) and α = 0.0001
(blue, dotted line). R0 = −0.18, ∆ = 0.1, N = 10 and
c = 0.2. . . . . . . . . . . . . . . . . . . . . . . . . . . . . .
Evolution of projection values |c01 |2 and |c02 |2 for N = 10.
Blue solid line - ground state; Red dashed line - first excited state. From top to bottom: theoretical non-Abelian
geometry phase simulation, actual quantum simulation for
α=0.01, 0.001, 0.0001 and 0.00001. ∆ = 0.1, and c = 0.2. .
Stationary mean-field energy spectrum for different R. Top
√
√
R2 + ∆2 ; Bottom solid line: − R2 + ∆2 ; Bottom
line:
2 +∆2
dashed line: − 2c − R 2c
. ∆ = 0.1, c = 0.2. The dashed line
is only valid between -0.173 and 0.173. . . . . . . . . . . . .
Phase space structure of Hamiltonian (2.22) for different R.
Top left: R = −0.2; Top right: R = −0.1; Bottom left:
R = 0.13; Bottom right: R = 0.19. ∆ = 0.1, c = 0.2. . . . .
8
8
9
10
12
12
16
20
21
2.9
Dynamics of population imbalance q against R for different fast ramping speeds. Black solid line: q-coordinates of
mean-field stationary points; Blue dashed line: α = 0.1; Red
dotted line: α = 0.01; Green dash-dotted line: α = 0.001.
∆ = 0.1, c = 0.2. . . . . . . . . . . . . . . . . . . . . . . . . 23
2.10 Dynamics of population imbalance q against R for different slow ramping speeds. Black solid line: q-coordinates of
mean-field stationary points; Blue dashed line: α = 0.0001;
Red dotted line: α = 0.00001; Green dash-dotted line: α =
0.000001. ∆ = 0.1, c = 0.2. . . . . . . . . . . . . . . . . . . 24
3.1
3.2
3.3
3.4
3.5
3.6
Mean-field trajectories for two different R at various initial
points. Left: R = −0.2; Right: R = −0.1. ∆ = 0.1, c = 0.2.
Dynamics of population imbalance sz at different ramping
speeds. Black solid line: mean-field stationary points; Blue
dashed line: α = 0.01; Red dotted line: α = 0.001; Green
dash-dotted line: α = 0.0001. ∆ = 0.1, c = 0.2 and N = 10.
Dynamics of population imbalance sz at for different N at
equal ramping speeds. Black solid line: mean-field stationary points; Blue dashed line: N = 10; Red dotted line:
N = 30; Green dash-dotted line: N = 100. ∆ = 0.1, c = 0.2,
α = 0.00001. . . . . . . . . . . . . . . . . . . . . . . . . . .
Evolution of relative population imbalance against R for different fast ramping speeds. Solid black line: Exact quantum
evolution; Blue dashed line: Backreaction-type evolution;
Red dotted line: mean-field evolution. Left to right: α=0.1,
0.01 and 0.001; ∆ = 0.1, c = 0.2, N = 10, R0 = −0.18. . . .
Evolution of population imbalance against R for different
slow ramping speeds. Solid black line: Exact quantum evolution; Blue dashed line: Backreaction-type evolution; Red
dotted line: mean-field evolution. Left to right: α = 10−4 , 10−5
and 10−6 ; ∆ = 0.1, c = 0.2, N = 10, R = −0.18 . . . . . . .
Exact quantum dynamics of lowest SPDM eigenvalues for
different ramping speeds. Bottom solid line: α = 0.1; Blue
dashed line: α = 0.01; Red dotted line: α = 0.001; Green
dash-dotted line: α = 0.0001; Top thick black solid line:
α = 0.00001. ∆ = 0.1, c = 0.2, N = 10. . . . . . . . . . . . .
9
26
27
27
30
31
32
3.7
3.8
3.9
3.10
3.11
3.12
3.13
3.14
Backreaction dynamics of lowest SPDM eigenvalues for different ramping speeds. Bottom solid line: α = 0.1; Blue
dashed line: α = 0.01; Red dotted line: α = 0.001; Green
dash-dotted line: α = 0.0001. ∆ = 0.1, c = 0.2, N = 10.
The evolution for α = 0.00001 is not indicated above as its
plot is excessively oscillating. . . . . . . . . . . . . . . . . .
Mean-field phase space structure and Husimi Distribution
for R = −0.2. Top left: Mean-field phase space; Top right:
Husimi distribution of ground state; Bottom left and right:
Husimi distribution of fifth and tenth excited states. ∆ =
0.1, c = 0.2 and N = 10. . . . . . . . . . . . . . . . . . .
Mean-field phase space structure and Husimi Distribution
for R = 0. Top left: Mean-field phase space; Top right:
Husimi distribution of ground state; Bottom left and right:
Husimi distribution of fifth and tenth excited states. ∆ =
0.1, c = 0.2 and N = 10. . . . . . . . . . . . . . . . . . .
Husimi Distribution for different N at R = −0.2. Top left:
N = 10; Top right: N = 20; Bottom left: N = 30; Bottom
right: N = 50. ∆ = 0.1, c = 0.2. . . . . . . . . . . . . . .
Evolution of Husimi distribution and classical ensemble at
different R for α = 0.1. Top: Husimi distribution; Bottom:
Classical ensemble. ∆ = 0.1, c = 0.2, M = 200. . . . . . .
Evolution of Husimi distribution and classical ensemble at
different R for α = 0.001. Top: Husimi distribution; Bottom: Classical ensemble. ∆ = 0.1, c = 0.2, M = 200. . . .
A qualitative pictorial understanding of IDF, assuming that
the stable stationary point moves downward in phase-space
at speed of vF . The orbits around the stationary points are
assumed to rotate in the clockwise direction. Top: before
bifurcation. Bottom: once after bifurcation. . . . . . . . .
Dynamics of population imbalance and SPDM lowest eigenvalues f for exact quantum evolution and classical Liouvillian dynamics. Left column: evolution of population imbalance; Right column: evolution of lowest SPDM eigenvalues. From top to bottom: α=0.1, 0.01, 0.001, 0.0001 and
0.00001. Black solid line: exact quantum calculation; Blue
dashed line: classical Liouvillian calculation. . . . . . . . .
10
. 33
. 43
. 44
. 45
. 46
. 47
. 48
. 51
4.1
Curves of f (z) and g(z) for two different N . Black solid
curve: f (z); Blue dashed curve: g(z). Left: N = 10; Right:
N = 30. ∆ = 0.1, c = 0.2. . . . . . . . . . . . . . . . . . . . 60
11
Chapter 1
Introduction
In 1924, Einstein predicted the phenomenon Bose-Einstein condensation
(BEC) - in a system of bosonic particles, a finite fraction of the particles
would condense into the same single-particle state under a certain temperature. Yet, Einstein’s prediction is based on a non-interacting bosonic
system. The first experimental realization of such theoretical prediction
came only more than half a decade later. Though in 1938, Fritz London
attempted to explain the superfluidity in liquid helium-4 as a manifestation of BEC in a strongly interacting atomic system. Eric Cornell and Carl
Wiemann produced the first condensate of weakly interacting atomic rubidium gas in 1995. Their Nobel-prize-winning achievement has henceforth
sparked an explosion of theoretical and experimental research on this new
system.
By employing laser cooling and magnetic evaporative cooling, alkali
atoms such as rubidium-87 and sodium-23 can be cooled into micro-Kelvin
to nano-Kelvin regime at which BEC can occur. Once cooled, the atoms
are confined in space within a trapping potential. There are few types
of traps which produce such trapping potential. Two examples are laser
traps and magnetic traps. Laser traps alter the atoms energy by exploiting the interaction between the laser field and the electric dipole moment
it induces on the atoms. For a magnetic trap, magnetic field with local
minimum in magnitude is generated. Consequently, atoms with magnetic
moment aligned opposite to the field will shift towards the local minimum
so as to reduce the interaction energy.
Formation of Bose-Einstein condensate allows observation of quantum
phenomena amplified to the macroscopic scale. To understand the dynamics of the weakly-interacting condensate, it is necessary to study its many1
body wavefunction Ψ(r1 · · · rN , t) which obeys the many-body Schr¨odinger
equation below.
N
2
[−
i=1
2m
∇2i + Vext (ri )]Ψ +
g0 δ(ri − rj )Ψ = i
i
∂Ψ
∂t
(1.1)
4π 2 a
Vext is the external trapping potential, g0 =
is the two-atom scatm
tering pseudopotential, a is the s-wave scattering length and m is the mass
of a condensate atom. However, evolution of such wavefunction under
Schr¨odinger equation is hard to be solved analytically or numerically as
the total number of atoms in a typical condensate ranges from a few hundreds up to a few billions. In the case of BEC near zero temperature, finite
fraction of atoms of order unity occupies the same single-particle state.
Under such regime, we can approximate the many-body wavefunction by a
Hartree-Fock Ansatz - a product of single-particle states:
N
Ψ(r1 · · · rN , t) =
χ0 (ri , t)
(1.2)
i=1
As a result, the dynamics of the single-particle state represent the collective dynamics of the condensate atoms. This approximation is the meanfield approximation. By taking the average of the Schr¨odinger equation and
replacing the wavefunction with the Ansatz above , we can obtain the celebrated time-dependent Gross-Pitaevskii equation (GPE) satisfied by the
common single-particle state.
2
∂χ0
= −
∇2 χ0 + Vext (r)χ0 + g0 |χ0 |2 χ0
(1.3)
∂t
2m
Note that the non-linearity of the Gross-Pitaevskii equation comes from
the two-atom interaction characterized by the scattering length. The GPE
has been applied to study various dynamics or properties of the BEC such
as the relaxation times of monopolar oscillations and the superfluid nature
of the BEC.
i
Another method of obtaining the GPE can be found in [1]. One starts
with the many-body Hamiltonian in its second quantized form below.
ˆ
H(t)
=
ˆ† −
dr Ψ
2
2m
∇2 + Vext (r) +
g0 ˆ † ˆ ˆ
ΨΨ Ψ
2
(1.4)
ˆ and Ψ
ˆ † are the boson field annihilation and creation operators annihilatΨ
2
ing and creating a particle at position r respectively. Under this formalism,
single-particle state χ0 (r, t) in the GPE is the expectation value of the field
ˆ and thus, it can be viewed as the classical limit of Ψ.
ˆ While
operator Ψ
ˆ evolves under the Heisenberg equation of motion, the GPE serves as the
Ψ
equation of motion for the classical field χ0 . Such point of view is analogous
to the semiclassical approximation in single particle quantum mechanics by
taking → 0, with 1/N playing the role of in our many-body context.
Considering the large number of atoms in the laboratory condensate, quantum correction is hard to observe and thus GPE manages to predict most
of the experimental results.
In this thesis, we are particularly interested in the case where the BEC is
trapped in a double-well potential with well-separated minima. Experimentally, one could first divide the condensate into two with high energy barrier
in between through a far-detuned laser. By switching off the double-well
trap, the two condensates are allowed to interfere with each other, creating
a two-slit atomic interference pattern. This observation clearly signifies the
existence of phase coherence over macroscopic scale. Also, if the condensate
is initially located in one well, it can tunnel between the two wells. Yet,
such quantum tunnelling can be suppressed depending on the macroscopic
non-linear interaction c = g0 N . Saying so, beyond a critical total number
of atoms while keeping g0 fixed, there will be a quantum transition from a
coherent tunnelling state to a self-trapping state.
Now, we suppose that the two wells are symmetrical and we define
Φ1 (r) = Φ(r − r1 ) and Φ2 (r) = Φ(r − r2 ) as the normalised single-particle
ground state wavefunctions of the single-well potential whose minima are
located at r1 and r2 respectively. Φ1 and Φ2 are assumed to not overlap
with each other so that they are almost mutually orthogonal. Here, we
also employ the two-mode approximation by approximating the bosonic
field operator in Hamiltonian (1.4) by
ˆ t) = aˆ1 Φ1 (r, t) + aˆ2 Φ2 (r, t)
Ψ(r,
(1.5)
where aˆ1 and aˆ2 annihilate an atom in the first and the second well respectively. Their adjoint operators are the corresponding creation operators.
Incorporating such approximation gives us a new expression for the Hamil-
3
tonian (1.4) below.
ˆ = E0 (aˆ1 † aˆ1 + aˆ2 † aˆ2 ) + R(aˆ1 † aˆ2 + aˆ2 † aˆ1 ) + U [(aˆ1 † )2 aˆ1 2 + (aˆ2 † )2 aˆ2 2 ] (1.6)
H
The parameters in the expression above can be evaluated through various
integrations:
E0 =
dr Φ†i (r, t) −
2
2m
∇2 + Vext (r) Φj (r, t) δi,j
(1.7)
2
R=
dr Φ†i (r, t)
U=
dr Φ†i (r, t)Φ†i (r, t)Φi (r, t)Φi (r, t)
−
2m
∇2 + Vext (r) Φj (r, t) (1 − δi,j )
(1.8)
(1.9)
where i, j are equal to 1 or 2. Equation (1.6) is the so-called Bose-Hubbard
model. It appears and has been studied in many different contexts such as
the non-linear directional coupler [2]. It also arises in solid state physics to
describe the transition from conducting to insulating state [3].
The mean-field dynamics of the two-mode BEC have been studied in
[4, 5]. It was shown from the mean-field dynamics that the system exhibits
two different regimes: (a) π-phase oscillation where the time-averaged of
relative phase between the two wells is π; (b) macroscopic quantum selftrapping where the average population imbalance is non-zero. However,
such mean-field studies do not account for the quantum collapse and revival sequence modulating the mean-field solution in the exact quantum
evolution [6]. Such collapse and revival in the many-body coherence arise
from the non-linear two-atoms interaction and the discrete quantum energy spectrum [7]. Moreover, mean-field approximation ignores the higher
moments of the quantum state, hence rendering some interesting physical
observables inaccessible. Also, near the mean-field dynamical instability,
mean-field dynamics deviate from quantum evolution on a time-scale logarithmic in N [8]. There are various existing efforts to capture the dynamics
of BEC beyond mean-field level. For instance, in order to calculate the
dynamics of BEC at very low temperature in a time-dependent trap, Y.
Castin and Rum use a systematic expansion up to the 3/2-power of the
fraction of non-condensed state [9]. This gives the linear dynamics of the
non-condensed particles. In addition, one can also truncate higher order
moments and derive the equations of motion for the second-order correlation functions. This has been done in [10] but such method suffers from
the lack of conservation in the total particle number. To overcome such
4
difficulty, Vardi et al. derived the Bogoliubov backreaction equations which
incorporate contribution from the second-order moments while conserving
total atoms number. We will apply this method in the future chapter,
hence relevant details will be given thereafter.
The motivation of current thesis is strongly related to a paper published
by Qi Zhang, Jiangbin Gong and C. H. Oh [11]. In this paper Zhang et al.
studied the mean-field dynamics of a Bose-Hubbard system with real and
imaginary coupling constants. The mean-field Bose Hubbard Hamiltonian
exhibits a pitchfork bifurcation within an interval of real coupling constant.
When the bifurcation occurs, the initially stable stationary point of the system turns unstable and two stable symmetry-connected stationary points
appear. Thus, when the real coupling constant is ramped at certain speed
up to the bifurcation critical point, the system has to choose between the
two stable stationary points. Zhang et al. point out that when the real
coupling constant is ramped adiabatically, the intrinsic dynamical fluctuation (IDF) can help the system determine which stable stationary point to
follow adiabatically. The result contests the usual negligence of the importance of IDF except in certain quantities capable of accumulating IDF. In
this thesis, we are going to study the dynamics of the quantum counterpart
of such mean-field Hamiltonian. This effort also contributes to the subject
of incommutability between the semiclassical and adiabatic limit. As such,
we will introduce in the next chapter the mathematical form of the relevant quantum Bose Hubbard Hamiltonian and give a detailed study of its
exact quantum dynamics. Then, the mean-field dynamics will be discussed
by following closely the argument provided in [11]. Through comparing
both dynamical regimes, we hope to take a glimpse at quantum effects
not accountable by mean-field dynamics. Since quantum fluctuations are
always ignored at the mean-field level, it is necessary to understand how
quantum moments of higher orders yield dynamical evolution totally different from the mean-field dynamics. Along this line, we will employ in
the third chapter two different methods which include the effects of second and higher order moments in their respective descriptions. These two
methods are the Bogoliubov backreaction method and the semiclassical
phase space approach. In our pursuit of a different possible understanding,
the last chapter is devoted to the 1/N -expansion method inspired from
the semiclassical approximation in the single-particle quantum mechanics.
However, such approach needs further extension and investigation beyond
the scope of this thesis.
5
Chapter 2
Quantum and Mean-Field
Dynamics of Bose-Hubbard
Model
2.1
The Bose-Hubbard Hamiltonian
In the previous introductory chapter, we have briefly gone through how
Bose-Hubbard model arises in the context of weakly-interacting Bose-Einstein
condensate confined within a double-well trap. Throughout this thesis, we
will adopt the following version of Bose-Hubbard Hamiltonian.
U
ˆ
H(t)
= −(R(t) + i∆)aˆ1 † aˆ2 − (R(t) − i∆)aˆ2 † aˆ1 − (aˆ1 † aˆ1 − aˆ2 † aˆ2 )2 (2.1)
2
In the equation above, the real coupling constant R(t) between the two
wells is allowed to change in time. Keep in mind that the rationale of
studying such time variation in R comes from the initial motivation of
this thesis. We have set out to study the quantum correspondence of the
classical mean-field dynamics exhibiting pitchfork bifurcation in which the
selection of stable stationary point is assisted by the intrinsic dynamical
fluctuation when R is ramped across the bifurcation region (see section 2.2).
The imaginary coupling constant ∆ can be achieved through phase imprinting on one well [12]. U is the on-site interaction strength. aˆj and
aˆj † (j = 1, 2) are the bosonic annihilation and creation operator of the first
and the second well satisfying the standard bosonic commutation relations
[aˆj , aˆk † ] = 1δj,k . The Hamiltonian (2.1) commutes with the total particles
ˆ = aˆ1 † aˆ1 + aˆ2 † aˆ2 . Thus, the total number of particles
number operator N
6
N is a conserved quantity throughout the evolution.
A convenient basis for most numerical calculations in the thesis is the
Fock states |n1 , n2 , where n1 and n2 are the number of particles in the
first and the second well respectively. The action of the annihilation and
creation operators on the Fock states is given as follows.
aˆ1 † |n1 , n2
√
n1 |n1 − 1, n2
√
= n1 + 1 |n1 + 1, n2
aˆ1 |n1 , n2 =
(2.2)
(2.3)
A complete analogous set of equations are satisfied by the bosonic operators
of the second well. As such, all Fock states normalised to unity can be
obtained from successively applying the creation operators on the vacuum
state |0, 0 .
1
(aˆ1 † )n1 (aˆ2 † )n2 |0, 0
(2.4)
|n1 , n2 = √
n1 !n2 !
We can also define the angular momentum operators Jˆx , Jˆy and Jˆz in the
Schwinger representation as below.
1
Jˆx = (aˆ1 † aˆ2 + aˆ1 aˆ2 † )
2
1
Jˆy = (aˆ1 † aˆ2 − aˆ1 aˆ2 † )
2i
1
Jˆz = (aˆ1 † aˆ1 − aˆ2 aˆ2 † )
2
(2.5)
(2.6)
(2.7)
The operators obey the SU(2) commutation relationships:
[Jˆu , Jˆv ] = i
ˆ
uvw Jw ,
u, v, w = 1, 2, 3
(2.8)
where we have redefined {Jˆx , Jˆy , Jˆz } as {Jˆ1 , Jˆ2 , Jˆ3 } and have used the Kronecker delta symbol uvw . Under this new representation, Hamiltonian (2.1)
can be rewritten as
2
ˆ
H(t)
= −2R(t)Jˆx + 2∆Jˆy − 2U Jˆz
(2.9)
The conservation of total particle number can be mapped into the conservation of J 2 = N2 ( N2 + 1) in the Schwinger representation.
7
2.1.1
Quantum Energy Spectrum and Eigenstates
Computed from the Fock basis, the Hamiltonian (2.1) is a tridiagonal hermitian matrix of dimension (N + 1) × (N + 1). The mn−th matrix element
is given by
ˆ
m|H|n
= − (R + i∆) (N − n)(n + 1) δm,n+1 (upper diagonal element)
− (R − i∆) n(N − n + 1)δm,n−1 (lower diagonal element)
U
− (2n − N )2 δm,n (diagonal element)
(2.10)
2
The eigenvalues of the matrix above constitute the energy spectrum of the
Hamiltonian at various values of R, ∆ and c = U N as the macroscopic
interaction strength.
N = 10
N = 10
0.3
−0.05
0.2
−0.1
0
E/N
E/N
0.1
−0.1
−0.2
−0.15
−0.2
−0.3
−0.4
−0.2
−0.15
−0.1
−0.05
0
0.05
0.1
0.15
−0.25
−0.2
0.2
−0.15
−0.1
−0.05
R
0
0.05
0.1
0.15
0.2
0.05
0.1
0.15
0.2
R
N = 20
N = 20
0.3
−0.05
0.2
−0.1
0
E/N
E/N
0.1
−0.1
−0.2
−0.15
−0.2
−0.3
−0.4
−0.2
−0.15
−0.1
−0.05
0
0.05
0.1
0.15
0.2
R
−0.25
−0.2
−0.15
−0.1
−0.05
0
R
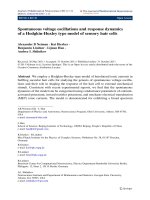
Figure 2.1: Energy spectrum of Hamiltonian (2.1) as a function of R for
N = 10 and 20, ∆ = 0.1 and c = 0.2. The right panel includes only up to
the 6-th lowest eigenvalues.
Figure 2.1 above demonstrates the eigenvalues of the Hamiltonian versus different values of real coupling constant R for two different total number of particles 10 and 20. It is observed that the energy spectrum is
symmetrical about R = 0 and the energy spacing between the lower-energy
states diminishes as N increases. Around R = 0, we observe that the energy
spectra of the ground and first excited state cluster together. For larger
8
N , even the third and forth lowest energy states exhibit similar behaviour.
Such energy pair clustering in the lower energy states occurs over larger
range of R around R = 0 for increasing N . Since eigenvalues degeneracy
is not allowed for tridiagonal hermitian matrices of non-zero off-diagonal
elements, such energy pair clustering only indicates the existence of nearly
degenerate low-energy eigenstates for range of R near zero. This fact can
be further reinforced by the figure below.
R = −0.2
R = −0.15
0.025
0.015
0.02
0.01
∆E
∆E
0.015
0.01
0.005
0.005
0
10
20
30
40
50
60
70
80
90
0
10
100
20
30
40
50
N
R = −0.1
−3
x 10
60
70
80
90
100
70
80
90
100
N
R=0
−4
x 10
7
8
6
7
6
5
5
∆E
∆E
4
4
3
3
2
2
1
0
10
1
20
30
40
50
60
70
80
90
0
10
100
N
20
30
40
50
60
N
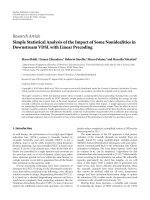
Figure 2.2: Energy difference in ground and first excited state versus N for
different R. ∆ = 0.1 and c = 0.2
Figure 2.2 above shows that the energy difference between the ground
and the first excited states at different values of R converges to zero for large
N . The convergence demonstrates an exponential behaviour, as consistent
with the result in [13]. Yet, faster convergence is seen for R nearer to 0.
At N = 10, the value of ∆E at R = 0 is already one order of magnitude
lower than the value at R = −0.1. This observation suggests a complete
degeneracy of the first two lowest states in the case of N = ∞. Such
convergence to zero signifies the transition of quantum dynamics into its
corresponding classical mean-field dynamics at large N . From the figure,
we observe a relatively more significant energy difference at N = 10 for
various R. Thus, to study the quantum effect not captured by the meanfield approach, it is justified to compare the quantum dynamics at N = 10
with the classical mean-field dynamics for most subsequent calculations in
9
this thesis.
R = −0.2
R = −0.15
0.18
R = −0.1
0.16
0.16
0.14
0.14
R = −0.05
0.18
0.2
0.16
0.18
R=0
0.25
0.16
0.14
0.2
0.12
0.14
0.12
0.12
0.1
0.12
0.15
|cn|2
0.08
0.08
|cn|2
|cn|2
|cn|2
0.1
|cn|2
0.1
0.1
0.08
0.08
0.1
0.06
0.06
0.06
0.06
0.04
0.04
0.04
0.02
0.02
0
0
5
n
10
0
0.04
0.02
0
5
n
10
0
0.05
0.02
0
5
n
10
0
0
5
n
10
0
0
5
10
n
Figure 2.3: Modulus square of the components of ground (blue, square,
solid line) and first excited states (red, circle, dashed line) in Fock basis for
different R. ∆ = 0.1 , c = 0.2 and N = 10.
Next, we are interested in the structure of the eigenstates of the ground
and first excited state. To do this, we plotted Fig 2.3 to demonstrate the
modulus square of the eigenstates components in terms of the Fock basis
for N = 10. The different n’s represent the quantum number n1 in the Fock
state |n1 , n2 . By conservation of total number of atoms, n2 can be obtained by n2 = N − n1 . We note that the modulus square of the coefficients
for the two lowest states are symmetrical about n = 5. For the first excited
state, there are always two maxima for any values of R, and the maxima
shift away from n = 5 as R approaches zero. On the other hand, the only
maximum of the ground state coefficients modulus square develops into two
maxima as R goes to zero, and the peak becomes even more pronounced.
Also, the eigenfunctions structure of the two lowest states become more and
more similar to each other, suggesting the occurrence of near-degeneracy
discussed earlier. In the large N limit, such difference vanishes. The superposition of such nearly-degenerate states produces quantum state localised
in one particular well for R near to zero. If the initial population is located
in one well, then the system will take exponentially long to tunnel to the
other well. This is the well-known self-trapped state in the mean-field limit.
10
2.1.2
Time-Dependent Quantum Dynamics
The evolution of a quantum state |Ψ(t) under the effect of Hamiltonian
(2.1) has never been studied before and it obeys the Schr¨odinger equation
ˆ
i |Ψ(t) = H(t)|Ψ(t)
.
(2.11)
As mentioned earlier, the total number of atoms is a conserved quantity
for such Hamiltonian obeying the SU(2) symmetry. Thus, we can represent
the quantum state in the Fock basis which conserves the total number of
atoms:
N
|Ψ(t) =
cn (t)|n, N − n
(2.12)
n=0
In the rest of this thesis, we shall take = 1. Also, the time dependence of
the Hamiltonian arises from the time-varying parameter R(t) = αt + R0 .
R0 is the initial value of R, and R is ramped to its final value at linear
speed α. Plugging in this representation into the Schr¨odinger equation and
comparing coefficient of each basis state, we obtain the following equation
of motion satisfied by all cn (t)’s.
i
dcn (t)
= − (R(t) + i∆) (N − n + 1)n cn−1 (t)
dt
U
− (2n − N )2 cn (t)
2
− (R(t) − i∆) (n + 1)(N − n) cn+1 (t)
(2.13)
Hence, the quantum evolution, supplied with initial condition, can be readily solved by Runge-Kutta algorithm employed in the ODE package of Matlab.
Figure 2.4 and 2.5 show the quantum evolutions of the population imbalance expectation value for different ramping speeds α with N = 10. The
initial state is the energy ground state of the Hamiltonian at R0 . Since
aˆi † aˆi represents the expectation value of the population in the i − th well,
2 ˆ
Jz = aˆ1 † aˆ1 − aˆ2 † aˆ2 is the expectation value of relative population
N
of the first well with respect to the second well.
For intermediate ramping speeds ( 0.00001 ≤ α ≤ 0.01), we observe a
notable increase in the population imbalance for R between -0.1 and 0.1.
Beyond R = 0.1, the population imbalance oscillates around zero, signifying
a quantum tunnelling between the two wells. The amplitude of such quan11
1
0.8
2<Jz>/N
0.6
0.4
0.2
0
−0.2
−0.4
−0.1
0
0.1
0.2
0.3
0.4
R
Figure 2.4: Quantum evolution of population imbalance expectation value
for different high ramping speeds α. α = 0.001 (black, solid line), α = 0.01
(red, dashed line) and α = 0.1 (blue, dotted line). R0 = −0.18, ∆ = 0.1,
N = 10 and c = 0.2.
0.9
0.8
0.7
0.6
2<Jz>/N
0.5
0.4
0.3
0.2
0.1
0
−0.1
−0.1
0
0.1
0.2
0.3
R
Figure 2.5: Quantum evolution of population imbalance expectation value
for different low ramping speeds α. α = 0.000001 (black, solid line), α =
0.00001 (red, dashed line) and α = 0.0001 (blue, dotted line). R0 = −0.18,
∆ = 0.1, N = 10 and c = 0.2.
tum tunnelling decreases, while its frequency increases with lower ramping
speed. Also, the peak of the population imbalance decreases with slower
ramping as shown in Figure 2.5. In the limiting case of vanishing ramping
speed (α = 10−6 ), there is essentially no population imbalance throughout
12
0.4
the evolution. In the case of very fast ramping (α = 0.1), the population
imbalance steadily increases and settles at a long-range oscillation.
An intuitive explanation of the observation above can be given by the
structure of the energy spectrum and eigenstates discussed in previous section. From Figure 2.3, it is clear from symmetry that the expectation value
of the population imbalance in the ground state at any R is zero. In the
adiabatic limit of very slow ramping, the quantum state at any instant
would follow the instantaneous ground state of the Hamiltonian. Such account explains why we have almost equal population in two wells all the
time when the ramping is slow enough (Fig 2.5). As the ramping becomes
faster, adiabatic following becomes harder to implement and contribution
from higher energy state to the instantaneous quantum state becomes more
apparent. Likelihood of such contribution is further enhanced if the energy
spacing between the ground state and higher energy state diminishes. As
seen from Fig 2.1, energy pair clustering only occurs between R = −0.1
and 0.1. Thus, in the earlier phase of the ramping from R = −0.18, larger
energy spacing ∆E still allows adiabatic following to occur at higher ramping speed. Yet, once R is ramped across the energy pair clustering region,
energy spacing becomes significantly small. Adiabaticity breaks down and
the instantaneous quantum state begins to incorporate contribution from
the first excited state. Superposition of the ground and first excited state
hence produces a non-zero population imbalance. At very fast ramping,
even contribution from the second and higher excited states kicks in, further altering the dynamics of the population imbalance. More mathematically stringent verification of such claim will be provided by the concept of
non-Abelian geometry phase in the next section.
2.1.3
Non-Abelian Geometry Phase
Non-Abelian geometry phase is the generalization of the usual concept of
Berry phase to the degenerate subspace manifolds. We will only provide
a review of its mathematical formulation by following closely Chapter 7 of
[14].
Suppose En (R), n = 1, · · · , M are the energy eigenvalues of a general
ˆ
Hamiltonian H(R).
R = R(t) is a set of time-varying parameters defining
the Hamiltonian. We consider a particular En (R), which is P -fold degenerate for any R. Also, we require that the degenerate subspaces Hn (R) and
13
Hm (R) of the energy eigenvalues En (R) and Em (R) not to intersect each
other for all R.
We assume an ideal adiabatic quantum evolution - an initial energy
eigenstate |n, p; R(0) ∈ Hn (R(0)) evolves such that at any instant t, it
remains an energy eigenvector of degenerate subspace Hn (R(t)). If we
define |n, p; R(t) , p = 1, · · · , P as the orthonormal energy eigenstates of
the degenerate subspace, adiabaticity assumption permits us to write the
quantum state at any instant t as
P
cnp (t)|n, p; R(t)
|Ψ(t) =
(2.14)
p=1
Substituting ansatz above into the Schr¨odinger equation, we obtain the
system of differential equations for cnp :
P
dcnp (t)
+
dt
iEn (R(t))δpq + n, p; R(t)|
q=1
d
|n, q; R(t)
dt
cnq (t) = 0
(2.15)
The solution of this equation can be written as
P
t
cnp (t) =
(−iEn (R(τ ))1dτ + iAnP (R(τ )))
T exp
0
q=1
cnq (0)
(2.16)
pq
where the matrix AnP is defined element-wise as:
d
|n, q; R(τ ) dτ
dτ
= i n, p; R|d|n, q; R
[AnP ]pq (R(τ )) = i n, p; R(τ )|
(2.17)
The time-ordering exponential of any matrix M(τ ) is a compact written
form of the following expressions:
t
T exp
M(τ )dτ
0
+∞
τ0
=
τ1
i=0
+∞
=
i=0
0
1
i!
τi−1
dτ2 · · ·
dτ1
0
τ0
τ0
τ0
dτ2 · · ·
dτ1
0
dτi M(τ1 )M(τ2 ) · · · M(τi )
0
0
dτi Tˆ [M(τ1 )M(τ2 ) · · · M(τi )]
(2.18)
0
in which τi < τi−1 < · · · < τ1 < τ0 = t. Tˆ-operator in the expression above
14