INVESTIGATION OF ELECTRIC AND THERMOELECTRIC PROPERTIES OF GRAPHENE NANORIBBON
Bạn đang xem bản rút gọn của tài liệu. Xem và tải ngay bản đầy đủ của tài liệu tại đây (2.55 MB, 74 trang )
INVESTIGATION OF ELECTRIC AND
THERMOELECTRIC PROPERTIES OF
GRAPHENE NANORIBBON
ZHANG KAIWEN
(M. Sc, NANJING UNIV)
A THESIS SUBMITTED
FOR THE DEGREE OF MASTER OF SCIENCE
DEPARTMENT OF PHYSICS
NATIONAL UNIVERSITY OF SINGAPORE
(2012)
DECLARATION
I hereby declare that this thesis is my original work and it has been
written by me in its entirety. I have duly acknowledged all the sources of
information which have been used in the thesis.
This thesis has also not been submitted for any degree in any university
previously.
1
ACKNOWLEDGEMENTS
I met a lot of friends during my life of study and research in Singapore.
These friends, not only accompanied me to pass through for the five years, but
also helped me when I most needed.
First and foremost, I would like to dedicate my deepest gratefulness to my
supervisor Prof. Li Baowen. He is a rigorous physicist and talented scholar. I am
very proud to be his student. What I have learned from him are not only the
physics, but more importantly, the skill to deal with the real world.
I‟d like to thank my supervisor Dr. Özyilmaz Barbaros who brought me to
the world of graphene and guided me on experiments. He builds a lab with
dedicated instruments and provides us with most convenient experimental
environment.
My sincere thanks to Dr. Zhang Gang and Dr Xu Xiangfan who give me
their patient guidance and meticulous help. They helped me with all the
background acknowledge on physics and taught me all the skills and technology
on experiments.
Thanks to Dr. Daniel. S. Pickard, who gives me a lot of useful advice
when we work together, and Dr Manu Jaiswal for helpful discussion on my
projects. Thanks to my collaborators from HIM lab, Dr.Viswanathan Vignesh,
Miss Wang Yue, Miss Hao Hanfang, and Mr. Fang Chao
2
Thanks to my labmates Dr. Surajit Saha, Dr. Lee Jonghak, Dr.R.S.S.
Mokkapati. Mr. Ho Yuda, Mr. Toh Chee Tat, Mr. Gavin Koon Mr. Jayakumar
Balakrishnan, Dr. Ni Guangxin and his wife, Mr. Alexandre Pachoud, Mr.
Hennrik Anderson. Mr. Ahmet Avsar, Mr. Orhan Kahya, Mr. Wu Jing, Mr.
Huangyuan, Mr. Zhang Shujie, Mr. Ibrahim Nor, Miss Yeo Yuting, Miss Zhao
Yuting, Mr. Tan, Junyou.
I‟d like to thank Dr. Yang Nuo, Dr. Yao Donglai, Dr. Zhang Lifa and his
wife, Dr. Chen Jie and his wife, Dr. Xie Lanfei, Dr. Ma Fusheng, Dr. Shi Lihong,
Dr. Ni Xiaoxi, Mr. Liu Sha and his wife, Miss Zhu Guimei, Mr. Zhang Xun.
Miss Ma Jing, Miss Liu Dan. They are not only my collegers but also close
friends with so many wonderful memories during the life in Singapore.
The financial support from the National University of Singapore is
gratefully acknowledged.
My special thanks to my husband Mr. Zhao Xiangming whose love
completed and enriched my life.
Last but not least, thanks to my parents. Their support and understand
give me all the courage to seek improvement in life. 爸爸,妈妈,谢谢你们。
3
LIST OF PUBLICATIONS
1. K. W. Zhang, X. M. Zhao, X.F. Xu, V. Vignesh, John T.L. Thonge, V.
Venkatesan, Daniel S. Pickard, B. W. Li, B. Özyilmaz, Graphene
Nano-ribbon Transistors Fabricated by Helium Ion Milling, going to submit
to APL, 2012
2. X. F. Xu, Y. Wang, K. W. Zhang, X. M. Zhao, S. Bae, M. Heinrich, C. T.
Bui, R. G. Xie, John T. L. Thong, B. H. Hong, K. P. Loh, B. W. Li and B.
Öezyilmaz, arXiv:1012.2937, Phonon Transport in Suspended Single Layer
Graphene , submitted to nature material
3. K. W. Zhang, X. M. Zhao, X.F. Xu, V. Vignesh, John T.L. Thonge, V.
Venkatesan, Daniel S. Pickard, B. W. Li, B. Özyilmaz, Ultranarrow Graphene
Nanoribbon Fabricated by Helium Ion Milling, (poster)APS March meeting,
USA, 2011
4
TABLE OF CONTENTS
Chapter 1
1.1
Introduction .......................................................................... 15
Graphene: background and literature review .......................... 15
1.1.1 Graphene in carbon family .............................................. 15
1.1.2 Electronic properties of graphene.................................... 17
1.1.3 Band structure in graphene .............................................. 18
1.1.4 Band gap in graphene nanoribbon (GNR) ....................... 19
1.2
Thermoelectrical properties of graphene ................................. 21
1.2.1 Seebeck coefficient and the figure of merit ZT ............... 21
1.2.2 Thermoelectrical properties in graphene ......................... 23
1.3
Chapter 2
2.1
Objective and scope of this thesis ........................................... 24
Experimental techniques ...................................................... 26
Preparation of graphene........................................................... 26
2.1.1 Micromechanical exfoliation ........................................... 26
2.2
Experimental
techniques
for
graphene
patterning
and
characterization ........................................................................................ 27
2.2.1 Electron beam lithography .............................................. 27
2.2.2 Reactive Ion etching ........................................................ 30
2.2.3 Helium Ion Microscope ................................................... 31
2.2.4 Raman spectroscopy ........................................................ 32
2.2.5 Atomic force microscopy ................................................ 34
5
2.3
Experimental techniques for electrical studies ........................ 35
2.3.1 Low temperature vacuum system .................................... 35
Chapter 3
Graphene nanoribbon patterned by Helium ion Lithography
……………………………………………………………..37
3.1
Introduction ............................................................................. 37
3.2
Experimental Method .............................................................. 38
3.2.1 Graphene device fabrication ............................................ 39
3.2.2 Helium ion lithography(HIL) .......................................... 40
3.2.3 Raman spectroscopy and electrical measurement ........... 42
3.3
Experimental Result ................................................................ 42
3.3.1 HIM pattering on suspended graphene ............................ 42
3.3.2 HIM pattering on supported graphene for electrical
measurement .................................................................................... 43
3.3.3 Raman spectroscopy characterization ............................. 44
3.3.4 Electrical properties characteristic .................................. 47
3.4
Chapter 4
Conclusion ............................................................................... 52
Thermal Power in Graphene nanoribbon ............................. 54
4.1
Introduction ............................................................................. 54
4.2
Sample preparation .................................................................. 55
4.2.1 Device fabrication ........................................................... 55
4.2.2 Graphene nanoribbon fabrication .................................... 57
6
4.3
Measurement and the Result ................................................... 58
4.3.1 Temperature
coefficient
of
Resistance(TCR)
for
thermometers.................................................................................... 58
4.3.2 Thermal power in graphene stripe. .................................. 59
4.3.3 Thermal power in graphene nanoribbon. ........................ 61
4.4
Chapter 5
Conclusion ............................................................................... 64
Conclusion and outlook ....................................................... 66
5.1
Thesis summary ....................................................................... 66
5.2
Future work ............................................................................. 67
7
SUMMARY
Graphene has been discovered in lab for only eight years. Its excellent
properties make the research of this new material very important, not only for
the fundamental physics but also for the application. Even more, the energy
band gap opening in graphene nanoribbon (GNR) makes it a potential
application material in semiconductor field.
In this thesis, we developed a method to fabricate ultra-narrow GNRs
which is called helium ion Lithography (HIL) using helium ion microscope
(HIM). Suspended GNRs with widths down to 5nm and supported GNRs with
widths down to 20nm are patterned by directly modifying graphene strips
through surface sputtering by helium ions.
The temperature dependent conductance measurements on supported
Graphene Field Effect Transistors (GFETs) show an estimated energy gap of
13mev for 60nm wide GNR. Detailed 2D conductance measurements at low
temperature reveal an enhanced characteristic energy scale for the disorder
potential, which can be attributed to the damage on graphene lattice induced by
helium ion bombardment and is further confirmed by Raman spectroscopy
measurement.
In addition, we also investigated the thermoelectric properties of GNR.
GNR on Si/SiO2 substrate was fabricated by plasma etching method because of
its easy and economical manipulation. Seebeck coefficient S of GNR with
8
width of ~70nm and length of 1μm was measured as a function of the back gate
voltage at different ambient temperatures. At low temperatures, the Seebeck
coefficient increases with increasing temperature, which can be explained by
electron-hole puddles localized. However, at high temperatures, the Seebeck
coefficient shows a decreasing with increasing temperature which indicates an
energy gap exists. Compared with the thermoelectric properties in bulk
graphene sheet, the magnitude of S is enhanced. Its optimized value occurred at
150K, which might due to the enhanced quantum confinement effect in GNR.
9
LIST OF FIGURES
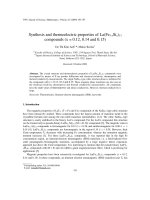
Figure 1.1 Graphene is the base for other dimensional graphitic materials:
0D buckyball, 1D carbon nanotube and 3D graphite (taken form
reference3). ........................................................................................... 16
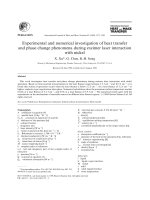
Figure 1.2 The atoms arrangement of graphene22 ........................................ 18
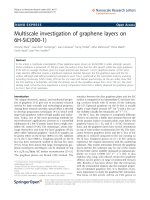
Figure 1.3 The band structure of (a) single layer graphene (b) bilayer
graphene33 ............................................................................................ 19
Figure 1.4 The diagram of the Seebeck coefficient of a material (Picture
taken from wikipedia) .......................................................................... 21
Figure 1.5 The diagram of thermoelectrical (a) generator and (b) cooler
(Picture taken from wikipedia) ............................................................ 22
Figure 2.1 Exfoliated single layer graphene on 300nm SiO2 substrate ....... 27
Figure 2.2 The process flow of standard E-beam lithography ..................... 28
Figure 2.3 Photograph and schematic of our scanning electron microscope
(Nova NanoSEM 230). ......................................................................... 29
Figure 2.4(a) EBL pattern of alignment mark, 4 marks indicated by the red
circle (b) EBL pattern of Hall bar electrode (c) EBL pattern of two
terminal device (d) EBL pattern of 4 terminal device. ........................ 30
Figure 2.5 The operation diagram of Helium Ion Microscpope. (Picture
taken from wikipedia) .......................................................................... 32
Figure 2.6 The Energy level diagram showing the states involved in
Raman signal. (Picture taken from wikipedia) .................................... 33
Figure 2.7 Typical Raman spectrum of single layer graphene ..................... 34
Figure 2.8 Block diagram of atomic force microscope (Picture taken from
wikipedia) ............................................................................................ 35
Figure 2.9 Picture of low temperature system, the inset shows the details
inside the probe .................................................................................... 36
Figure 3.1 Optical image of supported graphene with electrode defined by
standard E-beam lithography ............................................................... 39
Figure 3.2 Direct exfoliating of graphene on pre-patterned SiO2 substrate.
10
The scale bar is 10 μm ......................................................................... 40
Figure 3.3 Demonstration of Helium ion lithography on supported
graphene stripe. .................................................................................... 41
Figure 3.4(a) HIM-image on suspended GNRs with width of 20nm and
10nm respectively. Scale bar: 500nm (b) HIM-image of a suspended
graphene nanoribbon with varying widths fabricated by helium-ion
milling. Scale bar: 100nm. ................................................................... 43
Figure 3.5 Zoom in AFM image of the 60nm wide nanoribbon. Scale bar:
200nm. ................................................................................................. 44
Figure 3.6 (a) Raman map of integrated 2D-line intensity for helium-ion
milled graphene ribbon. The white dash line emphasizes the cutting
trace (b) Raman map of integrated G-line intensity (c) Raman map of
integrated D-line intensity. ................................................................... 45
Figure 3.7 Raman spectrum for Location A(Loc A)marked by Blue cross
in Fig. 3.6a and Location B(Loc B)marked by black cross in Fig. 3.6a.
The scale bars for all images are 700nm. ............................................. 46
Figure 3.8 The conductance of GNR vs. back-gate for different
temperatures from T = 6.5 K to 400 K ................................................. 48
Figure 3.9 Minimum conductance of GNR with W=60nm and L=250nm at,
Gmin vs. 1/T with fits to NNH (red curve) and VRH (blue curve).
Black dots denote experimental data ................................................... 49
Figure 3.10 Conductance vs. back-gate voltage at different source-drain
bias at T=4.3 K. .................................................................................... 50
Figure 3.112D plot of Conductance of graphene nanoribbon with width of
60nm as a function of Vsd and Vbg at T=4.3 K. .................................... 51
Figure 4.1 Optical image of thermal power device, 1 is heater, 2 and 3 is
thermometers........................................................................................ 57
Figure 4.2 Etching process for graphene nanoribbon. 1) PMMA is spin
coated on top of graphene sheet; 2) etching pattern is exposure to
electron beam in SEM chamber; 3) after development, cross section
picture shows over dose of etching. 4) exposed part of graphene is
etched by O2 plasma............................................................................. 58
Figure 4.3 Seebeck coefficient (S) of graphene with width of 5um and
length of 7um as a function of backgate Vbg at temperature 15k, 50k,
11
100k, 130k,170k, 210k, 250k and290k. ............................................... 60
Figure 4.4 Seebeck Coefficient of graphene stripe at fixed backgate Vbg =
1v( Red triangle) and -50V(blue dot)................................................... 61
Figure 4.5Resistance of GNR as a function of back gate voltage V𝑏𝑔 at
different temperatures 10k, 50k, 195k, 250k, and 300k. Inset is the
optical picture of the device and AFM picture of the GNR. The scale
bar is 500nm ......................................................................................... 62
Figure 4.6 Seebeck coefficient S of GNR (W=70nm, L=1μm) as a function
of back gate Vbg at different temperatures 15k, 50k, 200k, 250k, and
300k...................................................................................................... 63
Figure 4.7 Seebeck Coefficient of graphene stripe at fixed backgate
Vbg~3v( Red triangle) and 40V(blue dot) ............................................ 64
12
LIST OF ABBREVIATIONS
Si
Silicon
2D
Two Dimensional
SLG
Single Layer Graphene
BLG
Bilayer Graphene
ExG
Exfoliated Graphene
GNR
Graphene Nano-ribbon
GFET
Graphene Field Effect Transistor
GNR-FET
Graphene Nanoribbon Field Effect Transistor
SiO2
Silicon Dioxide
STM
Scan Tunneling Microscope
CVD
Chemical Vapor Deposition
EBL
E-Beam Lithography
SEM
Scanning Electron Microscope
PMMA
Poly(methyl methacrylate)
NPGS
Nanometer Pattern Generation System
Cr
Chromium
Au
Gold
RIE
Reactive Ion Etching
K
Kelvin
13
T
Tesla
EF
Fermi Level
SMU
Source Measurement Unit
DOS
Density of States
Al
Aluminum
HIM
Helium Ion Microscope
HIL
Helium Ion Lithography
AFM
Atomic Force Microscopy
EMF
Electromotive Force
14
Chapter 1 Introduction
Graphene, which is only one-atom thick, is now considered to be the
world‟s thinnest material1. This strictly two-dimensional (2D) material was
thought to be not stable and could not exist in nature. Once it was discovered
in the lab, it has attracted tremendous interest and is believed to be a wonderful
material for next generation electronics. This flat monolayer of carbon atoms,
tightly packed into two dimensional honeycomb lattice, is the basic building
block for graphitic materials of all other dimensionalities. The discovery of
graphene opens a new research era for material science and its application.
1.1 Graphene: background and literature review
1.1.1
Graphene in carbon family
As the thinnest known material in the universe, graphene has attracted the
most enthusiasm and attention in the world. This novel material was
experimentally founded by Geim‟s group using mechanically exfoliation
method with scotch tape in 20041, 2. This truly two dimensional material acts as
the „building block‟ of other carbon family members, shown in Fig 1.13: it can
be wrapped into zero dimensional buckminsterfullerene(C 60); it can also be
rolled up into widely used one dimensional carbon nanotubes, which have
been extensively investigated for device applications in the last two decades4;
the three-dimensional graphite in pencils can also be realized by simply
stacking graphene sheets5.
15
Figure 1.1 Graphene is the base for other dimensional graphitic materials: 0D buckyball,
1D carbon nanotube and 3D graphite (taken form reference3).
All of these carbon materials have been used in many applications much
earlier before graphene emerged, yet many of their electronic and magnetic
properties originate from the properties of graphene. Indeed, graphene has
been theoretically studied to describe other carbon-based materials for around
sixty years before it became a reality6, 7.
Two dimensional crystals were believed to be thermodynamically
unstable and unable to exist in nature8, 9, while numerous attempts at obtaining
two dimensional crystals were failed10. The reason that people believed it only
exists theoretically is that the thermal fluctuation in 2D crystal causes the
lattice dislocations or defects at finite temperature to destabilize the crystal
structure.3, 6, 7, 11 However, half a century later, Geim and his colleague cleaved
the one-atom-thickness layer from bulk graphite by mechanically exfoliation2.
This
relatively
simple
technique
involves
repeated
peeling
off
three-dimensional graphite, since graphene layers are only weakly coupled.
16
Taking advantage of the same method, the team has also managed to obtain
free-standing two dimensional crystals of other materials such as single-layer
boron nitride12. Afterwards, numerous research groups from all around world
investigated this new born material13-18. The excellent properties making
graphene one of the hottest topics in physics in recent years and a graphene
“gold rush” has started since then.
1.1.2
Electronic properties of graphene
Carbon-based systems show an unlimited number of different structures
with variety of physical properties4, 19. Among systems with only carbon atoms,
graphene plays an important role since it is the basis for understanding of the
electronic properties in other allotropes. The discovery of both single layer
graphene (SLG) and bilayer graphene (BLG) has revolutionized the physics of
low dimensional systems and led to novel nanoscale device applications2, 20, 21.
Within the last eight years, it helped create one of the most successful
interdisciplinary research efforts driven by graphene‟s outstanding electronic,
chemical, optical, and mechanical properties.
17
Figure 1.2 The atoms arrangement of graphene22
Graphene is composed of carbon atoms arranged on a honeycomb
structure, and can also be thought of benzene rings stripped out from their
hydrogen atoms23, which are shown in Fig 1.2. Every carbon atom has three
nearest neighbors with an interatomic distance of 1.42 angstrom. Each atom
has one s and three p orbitals, among which, only the perpendicular p orbital
contributes to conductivity and hybridizes to form valence and conduction
bands. Because the two sublattices give different contributions in the
electronic structure, a pseudo-spin24 is defined for the relative contribution of
the A and B sublattices, which consequently introduces chirality to graphene21,
25
.
1.1.3
Band structure in graphene
The primary shape of graphene band structure consists of two conical
valleys that touch each other at the symmetry point in the Brillouin zone, which
18
is called Dirac point. As shown in Fig. 1.3A, the energy spectrum varies linearly
with the magnitude of momentum away from the Dirac point3. From a purely
basic science point of view, the massless, chiral, Dirac-like electronic spectrum
of single layer graphene with two linear energy bands touching each other at a
single point is the fundamental basis for the observation of many exotic
phenomena.
The energy spectrum of bilayer graphene is quite different from single
layer. Although it only adds one additional layer, the entirely quantum
phenomena changed based on the massive nature of bilayer‟s chiral Dirac
fermions26-32. By broking the sublattice symmetry, the spectrum is made of
four massive Dirac bands (two conduction bands, two valence bands) and has
hyperbolic dispersion relation. In this situation, the band gap opens29, as
shown in Fig. 1.3B.
Figure 1.3 The band structure of (a) single layer graphene (b) bilayer graphene33
1.1.4
Band gap in graphene nanoribbon (GNR)
The band gap opening in bilayer graphene makes it a potential material in
19
semiconductor field27, 34, 35.
In spite of broking A-B symmetry in bi-layer
graphene, quantum confinement induced by cleaving graphene to quasi
one-dimensional GNR36-40, is considered as another widely used way to create
energy band gap in graphene based devices. Theoretical works using
Zone-folding approximation41, π-orbitial tight-binding models42, 43 and first
principle calculations44,
45
predict the band gap Eg of a GNR scaling as
Eg = α/W with the GNR width W, where α ranges between 0.2-1.5,
depending on the model and the crystallographic orientation46. However, these
theoretical estimates can neither explain the experimentally observed energy
gaps of etched nanoribbons of widths beyond 20 nm, which turn out to be
larger than predicted, nor explain the large number of resonances found inside
the gap39, 47, 48. On the other hand, numerous methods are invented to fabricate
GNR, including plasma etching48,
49
, atomic force microscopy anodic
oxidation50, scanning tunneling microscopy lithography51, as well as chemical
methods including chemical derived techniques52-54 and anisotropic etching55.
However, these processes presently lack control over the width, orientation
and layer number of graphene. Recently, Helium-ion lithography (HIL) shows
powerful ability for patterning GNR because of its high resolution56,
57
.
Suspended GNR with width of 10nm was achieved by this method57, while
there is lack of study on the GNR‟s properties. In my thesis, GNR fabricated
by HIL will be studied.
20
1.2 Thermoelectrical properties of graphene
1.2.1
Seebeck coefficient and the figure of merit ZT
The energy loss in industry is a great waste. Approximately 90 per cent of
the world‟s power is generated by heat engines that use fossil fuel combustion
as a heat source. The heat engine typically operates at 30-40 per cent efficiency.
As a result, roughly 15 terawatts of heat is lost to the environment58.
Thermoelectric device could potentially convert part of this low-grade waste
heat to useful electricity.
The thermopower or Seebeck coefficient, represented by S, of a material
measures the magnitude of an induced thermoelectric voltage in response to a
temperature difference across that material as shown in Fig. 1.4.
S=−
∆𝑉
∆𝑇
Figure 1.4 The diagram of the Seebeck coefficient of a material (Picture taken from
wikipedia)
At the atomic scale, the applied temperature gradient causes charged
carriers in the material to diffuse from the hot side to the cold side. Based on
21
this mechanism, thermoelectric cooler or generator is built, as shown in Fig. 1.5.
Carriers flow through the n-type element, crosses a metallic interconnect, and
passes into the p-type element. If a power source is provided, the thermoelectric
device acts as a cooler. Electrons in the n-type element move opposite the
direction of current and holes in the p-type element will move in the direction of
current, both removing heat from one side of the device. When a heat source is
provided, the thermoelectric device works as a power generator.
Figure 1.5 The diagram of thermoelectrical (a) generator and (b) cooler (Picture taken
from wikipedia)
For a material to be a good thermoelectric cooler or generator, it must have
a high thermoelectric figure of merit, ZT. The figure of merit is defined by:
ZT = S^2 ∗ σ/к
Where S is the Seebeck coefficient, σ is the electrical conductivity, and к is
the thermal conductivity. It has been challenging to increase ZT>1, since the
parameters
of
ZT are
generally interdependent58-60.
Increasing
the
thermoelectric power S for a material also leads to a simultaneous decrease in
22
the electrical conductivity. Also, an increase in the electric conductivity leads to
a comparable increase in the electronic contribution to the thermal conductivity.
Thus, bulk materials have a limited ZT. The highest ZT for bulk material report
to date is about 2.4 in Be2Se361-63. However, recent studies have suggested that
the value of ZT may become significantly higher by incorporating
nanostructures into bulk materials or use low dimensional structures. The use
of low-dimensional systems for thermoelectric application is mainly due to: a)
enhance the density of states near E , leading to an enhancement of the
Seebeck coefficient; b) decrease of phonon conductivity by increasing the
boundary scattering.
1.2.2
Thermoelectrical properties in graphene
Graphene, which is a 2D material, can provide such quantum confinement
effect for the application on thermoelectric material. Large thermopower has
been discovered experimentally in single layer graphene64. Unfortunately, due
to the large thermal conductivity in graphene15,
65-67
, figure of merit in
graphene is much smaller than 1, which prevents the graphene from heat
engineering application. On the other hand, Theoretical works have proved
that thermopower can be significantly enhanced in functional graphene
material, such as GNR68-71, graphane68, 72, 73 (Hydrogenated graphene), due to
band gap opening. Although this enhancement has not been observed in
23
gapped dual gate bilayer graphene due to charge puddles near the CNP74, the
optimized value occurs at 100 Kevin provides an opportunity for low-T
thermoelectric application. As a result, experiment work is also needed to
investigate the thermoelectric properties in gapped GNR.
1.3 Objective and scope of this thesis
In the first part of this thesis, the main focus is to pattern graphene sheet in
to quasi-one dimensional graphene nanoribbon with the help of helium ion
beam sputtering. Band structure is modified after the ion beam cutting and the
energy gap opens. The effect of helium ion bombardment to graphene is
analyzed. The second part investigates the thermoelectrical properties changes
in graphene nanoribbon compared to graphene sheets.
The thesis is organized as follows: Chapter 2 introduces the methods of
preparing graphene samples and an overview on experimental techniques used
in this thesis. Experimental results are presented in Chapter 3 and Chapter 4. In
chapter 3, we introduce the method of preparing graphene nanoribbon from
graphene sheet both on suspended substrate and supported substrate. We show
that the width of the GNR in this method can be narrowed down to 5nm on
suspended samples and 20nm on supported ones. Electrical properties
characterization of the supported GNR with width of 60nm shows the energy
band gap opening in later part of this chapter. In chapter 4, we study the
thermoelectric properties of graphene based devices. First, we study the
24