Spatio temporal dynamics of the urban heat island in singapore 3
Bạn đang xem bản rút gọn của tài liệu. Xem và tải ngay bản đầy đủ của tài liệu tại đây (4.33 MB, 25 trang )
90
While all stations posted a minimum UHIraw that is less than 0◦ C, for minimum UHImax , 12 stations had positive values. The fact that less stations have
negative minimums is expected as UHImax does not consider daytime values. All
of the minimum values of UHIraw in urban stations occur during daytime, which
is likely due to shading effects from buildings. Three stations posted minimum
UHImax values greater than 1.5◦ C (S44, S45 and S46), although little can be established from this as all three stations had less than eight valid nights of data and
thus may not be representative.
Table 4.6: Mean, minimum and maximum values of UHImax and UHIraw .
Summary across all stations
Mean of station minimums
Mean of station means
Mean of station maximums
Overall minimum
Overall maximum
UHImax
-0.40
2.71
4.83
-2.44
6.46
UHIraw
-2.98
1.81
5.09
-4.44
6.70
UHIM AX intensity and time of occurrence
The maximum UHIraw value measured across all stations and time intervals
is 6.70◦ C, occurring on 30th July 2009 at 03:10 local time at S22 (Table 4.7). The
maximum of UHImax was registered at 6.46◦ C at 22:20 local time on 24th April
2009, at S22. The latter value is deemed to be the UHIM AX due to its stricter
filtering requirements. Although non-ideal conditions usually dampen rather than
increase UHI intensities, unequal antecedent conditions (Φa ) can result in higher
than expected intensities (as discussed earlier).
91
Table 4.7: Maximum UHI intensities and their time of occurrence for all stations and their available dataset across the entire study period (Feb 2008 to Jun
2011), Refer to Appendix B for the UCZ classes.
Stn
Description
S01
S02
S03
S04
S05
S06
S07
S08
S09
S10
S11
S12
S13
S14
S15
S17
S18
S19
S20
S21
S22
S23
S24
S25
S27
S28
S29
S30
S31
S32
S33
S34
S36
S37
S38
S39
S40
S41
S42
S43
Coastal
Industrial
Forest
Park
Low-rise residential
High-rise residential
High-rise commercial
High-rise residential
Coastal
Forested/agricultural
Clearing
Industrial
Low-rise residential
High-rise residential
Low-rise residential
High-rise residential
Low-rise commercial
Low-rise residential
Open
Low-rise residential
High-rise commercial
Rural
Low-rise residential
Low-rise industrial
Rural
Rural
Urban park
Large park
Low-rise residential
Low-rise residential
Low-rise residential
Reservoir
Open grass
High-rise residential
High-rise residential
Open grass patch
Low-rise residential
Med-rise commercial
Low-rise residential
Low-rise commercial
(mock-up)
Med-rise commercial
Low-rise residential
High-rise commercial
S44
S45
S46
Max
UHIraw
4.75
5.22
2.26
3.50
5.42
4.76
6.44
5.93
5.36
4.04
5.00
5.69
6.19
6.10
5.95
6.30
5.35
5.72
4.86
5.17
6.70
2.88
6.20
6.32
0.88
3.20
5.27
4.90
5.78
4.51
5.07
3.81
5.30
5.62
6.03
2.86
6.43
6.01
6.20
4.04
Date and time
of occurrence
2008-05-05 22:50
2009-04-25 00:10
2008-07-31 05:10
2011-05-10 01:10
2008-09-25 20:20
2008-05-19 06:30
2009-07-31 07:30
2009-04-24 22:20
2008-05-19 07:30
2009-08-03 08:00
2008-05-19 07:20
2009-07-30 01:50
2009-04-24 21:50
2009-07-31 07:30
2009-07-31 05:20
2009-04-24 22:40
2008-04-01 21:10
2009-04-24 23:00
2008-07-03 07:50
2009-04-24 23:10
2009-07-30 03:10
2008-04-03 08:50
2009-07-31 08:00
2009-07-31 07:30
2008-05-19 22:00
2008-09-23 09:10
2009-04-24 23:10
2009-08-03 05:20
2009-07-31 07:50
2009-08-03 08:00
2008-06-12 21:50
2009-08-03 08:20
2009-08-03 07:50
2009-07-31 05:00
2009-07-31 03:40
2009-01-19 08:50
2009-07-31 07:30
2009-07-31 05:40
2009-07-31 07:00
2009-08-03 08:20
Max
UHImax
4.55
2.10
5.03
6.36
5.28
3.76
4.95
5.55
6.06
5.30
4.74
6.59
2.56
6.14
6.30
2.09
4.48
5.75
4.43
5.03
3.75
5.16
1.94
5.80
6.18
3.27
Date and time
of occurrence
2009-07-31 06:00
2008-05-17 23:40
2008-05-19 03:30
2009-07-31 06:20
2009-04-24 22:20
2008-05-18 04:10
2008-05-19 06:50
2009-07-31 05:40
2009-04-24 22:20
2008-10-11 02:00
2008-05-19 06:40
2009-07-31 06:50
2008-03-28 01:50
2009-07-31 06:30
2009-07-31 05:20
2011-04-17 22:10
2009-07-30 23:00
2009-07-31 06:20
2009-04-24 23:50
2008-10-11 01:20
2009-04-24 20:50
2009-07-31 04:30
2009-02-19 06:50
2009-02-19 06:50
2009-07-31 06:50
2009-07-30 22:20
LCZ
5.67
5.36
5.80
2011-05-09 21:10
2011-05-10 23:00
2011-05-09 21:40
-
-
12
3
12
BG
3B
A
B
3
4D
1
1
GB
A9
BF
2
3
12
3
1E
3
3
5D
6
12
BA
5
8
BA
BA
B1
BG
31
6D
3
DG
D8
1D
1
D
2
3
21
6A
92
Table 4.7 includes both “rural” and “urban” sites in an effort to capture
heat island differences across the entire spectrum of land use. A few points to note
include (i) UHImax filtering see less unexpected time of maximum UHI values than
UHIraw filtering; (ii) stations found in rural and vegetated areas tend to have maximum UHIraw occurring close to sunrise; and (iii) most of the maximum values for
both UHIraw and UHImax are found during the April-May (Pre-SW monsoon) and
July-Sept (SW monsoon) period.
Oke (1981) states that UHIM AX typically occurs 3 to 5 hours after sunset,
which in Singapore’s case, would be 22:00 to 00:00 hrs. This is consistent with the
maximum of UHImax , which occurred at 22:20 hrs local time. The peak occurrence
of UHI in Singapore, however, varies between stations and time of year. It is noted
that some stations and months see UHI values that peak around sunrise. However,
care has to be taken when interpreting values close to sunrise and sunset as rapid
changes to meteorological conditions mean that artefacts may arise (Oke, 2006).
Detailed discussion of temporal variations in time of maximum UHI occurrence is
covered in Section 4.3.2.
The UHIM AX value in this study (6.46◦ C) is approximately half a degree
less than that reported by Chow and Roth (2006), which was 7.07◦ C. Apart from
the slight difference in magnitude, the time of occurrence (present study: 22:20
hrs, Chow and Roth: 22:00 hrs), time of year (24th April, 17th May) and location
of occurrence (both in Orchard Road) are almost identical. Unsurprisingly, past
studies in Singapore have all identified the location of UHIM AX to be within the
CBD (Nieuwolt, 1966; Singapore Meteorological Services, 1986; Goh and Chang,
1998; Wong and Chen, 2005; Chow and Roth, 2006; Priyadarsini et al., 2008). Of
interest is the general increase in reported UHIM AX intensities with time, from 3
93
to 5◦ C in the earlier studies to approximately 7◦ C in more recent studies, a trend
echoed in the neighbouring country of Malaysia (Elsayed, 2011; Roth and Chow,
2012).
4.3
Temporal variability of the urban thermal environment
There are several temporal scales at which climatological and meteorological variability operate. The focus of this section on distinctive temporal patterns and
therefore the diurnal, seasonal and inter-annual scales will be of greatest interest;
they represent cyclical patterns as opposed to, for example, a weekly scale. UHI
intensities referred to in this section are UHIraw values unless otherwise stated.
4.3.1
Diurnal variability of air temperature
An hourly box-and-whiskers plot of ensemble mean air temperature (across all
stations and the entire study period) illustrates that the range of measured air
temperature across all the stations changes throughout the course of a day. The
interquartile range (75th percentile - 25th percentile) begins to increase as the sun
sets and is largest in the night (19:00 - 06:00 hrs), exceeding 1◦ C during each hour
(Figure 4.7). The same applies for the full range (max - min), even after taking
outliers into consideration. During daytime (07:00 - 18:00 hrs), the interquartile
range decreases as the sun rises and most hours have a sub-1◦ C range, especially
around solar noon (13:00 hrs).
This finding is in agreement with earlier discussions on the effects of urban
influence on the diurnal air temperature cycle. Temporal variations are most dis-
95
(a)
✂✄☎✆✝✞✟
✂✄☎✞✟✠
30
Air temperature (°C)
Location
✁
28
Rural (S16)
24
Low-rise
Residential (S15)
High-rise
Residential (S08)
Commercial (S22)
Commercial (S07)
26
Forest (S03)
Urban park S29
00 01 02 03 04 05 06 07 08 09 10 11 12 13 14 15 16 17 18 19 20 21 22 23
Local Time
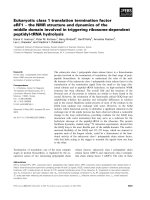
Figure 4.8: Ensemble mean hourly air temperatures for selected stations across
all weather conditions and for the entire study period (Feb 2008 to Jul 2011).
The selected stations are representative of sites of common land use types, such
as forest (S03), rural (S16), commercial (S22 & S07), low-rise residential (S15),
high-rise residential (S08) and urban park (S29).
residential areas, which may be shaded. One striking behaviour is that the rural
station has air temperatures not unlike the urban sites during solar noon (13:00 hrs).
Relationship between air temperature, cooling rate and UHI intensity
The hourly cooling rate can be mathematically defined as the rate of change
of air temperature between each hourly interval (Equation 4.1).
−(Ti − Ti−1 )
(4.1)
where i = current time-step and i − 1 = previous time-step
The relationship between air temperature, cooling rate and UHI intensity is shown
in Figure 4.9 for three sites. Cooling begins for all three stations at 14:00 hrs. The
maximum cooling rates are reached around 18:00 and 19:00 hrs. The cooling rates
begin to fall after sunset when K* becomes zero but remain positive during this
entire period, stabilizing around midnight. Negative cooling rates (i.e. warming
96
rates) occur after sunrise. The highest warming rates are observed before solar
noon for all three stations, at 09:00 hrs at the rural and low-rise residential stations
and 11:00 hrs at the commercial station. This is possibly due to greater solar access
from a nearly overhead sun and hence warming potential is greatest closer to noon
in the high-rise commercial area.
As discussed previously, a distinct difference between urban and non-urban
sites is the magnitude of their rates of cooling. This can be seen in the much higher
rates of cooling for the rural site between 14:00 to 23:00 hrs compared to the two
other urban sites (Figure 4.9). The openness of the rural site with low re-absorption
of L↑ and lower daytime heat storage flux, unlike in urban areas, contribute to the
higher cooling rates. Furthermore, reduced rural µ during drier periods contributes
to increased cooling potential. The cooling rate differential gives rise to the establishment of the UHI. When the cooling rate of the rural station exceeds that of the
urban stations (approximately 14:00 - 23:00 hrs), the effective UHI intensity (note
that ∆Tu−r used here is unfiltered for weather effects as discussed in Section 2.1)
increases, in this case peaking at around 01:00 and 02:00 hrs.
Conversely, the UHI intensity will begin falling after sunrise when warming
rate becomes larger in rural areas than urban areas. In the case of the commercial
station (S07), UHI intensities are negative from 12:00 to 14:00 hrs, creating an
urban cool island. This is attributed to shading from direct K ↓ by tall buildings
during daytime. The low-rise residential station (S15) also experiences lower UHI
intensities during the day but the intensities remain positive due to a lack of shading.
98
4.3.2
Seasonal change in UHI characteristics
The focus of this section is to explore the seasonal variation of UHIraw while specific
relationships between synoptic weather elements and heat island intensity will be
covered in a later section (Section 4.7). As discussed in Section 3.1, the weather
conditions in Singapore follow a monsoonal pattern (refer to Tables 3.1 and Figure
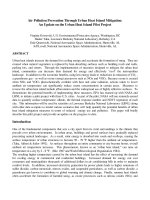
3.2). Figure 4.10 shows the monthly mean values for the entire study period. There
appears to be a usual trend, which sees the pre-south-west (PSW) intermonsoon
and south-west (SW) monsoon periods having the highest heat island intensities.
The pre-north-east (PNE) usually experiences a drop in UHI intensity before the
lowest values occur during the north-east monsoon (NE).
Nocturnal mean UHIraw (°C)
29.0
4
28.5
3
28.0
2
27.5
1
27.0
0
Air temperature at Changi Met Station (°C )
5
Monsoon
period
NE
PNE
PSW
SW
26.5
−1
2008
2009
2010
2011
Time
Figure 4.10: Boxplot of mean monthly nocturnal (19:00 - 07:00 hrs) UHIraw
for all stations together with air temperature measured at Changi Meteorological
Station (red dashed line). Only stations with more than 24 months of data are
used in order to prevent skewed results. Note that there is no data for September
2009, October 2009 and June 2011.
The warmer months have higher nocturnal mean UHIraw intensities while the
wet monsoon (NE) sees lower intensities. High precipitation rates during the cooler
months lead to an increase in the rural thermal admittance (µ). This is despite the
filtering out of intervals with rainfall as surface moisture levels may still be high
99
due to build up of soil moisture during the rainy season. As discussed in Section
2.1, this contributes to the “dampening” of UHI intensities (Runnalls and Oke,
2000; Chow and Roth, 2006). Warmer months also tend to have less cloud cover
and lower wind speeds, which may contribute to higher UHIraw intensities. Specific relationships between the weather variables and UHI are covered in Section 4.7.
It is clear that the diurnal characteristics of the heat island undergo changes
across the year, in terms of magnitude, agreement across stations (i.e. SD), onset,
peak and decline (Figures 4.11, 4.12 and 4.13). The plots include measurements
from all weather conditions. To ensure consistency, stations with less than 80%
observed month-hours (observations at a given hour of a given month in any year,
i.e. 12 months×24 hours= 288 month-hours) during the study period are removed
(Table 4.8).
Table 4.8: Omitted stations and percentages of month-hour observed.
Stn
% month-hour
S06
67.0
S09
33.7
S18
72.2
S20
75.0
S27
8.7
S33
69.1
S39
25.4
S42
60.4
S44
32.6
S45
32.3
S46
32.3
In terms of magnitude, the months in the middle of the year, from April to
October, typically have a higher number of stations having mean UHIraw intensities that exceed 4◦ C during the night (Figure 4.11). In contrast, months during the
north-east monsoon (December to March) see lower heat island intensities (< 4◦ C).
January and February see the UHI intensities increase at a somewhat slow
rate starting at just before sunset, typically reaching the peak just before sunrise
(Table 4.9 and Figure 4.13). This creates diurnal UHI curves that are skewed towards sunrise, which is unlike usual descriptions of UHI peaking a few hours after
sunset. These two months are characterised by relatively strong winds throughout
103
The thick cloud cover and relatively high levels of surface moisture and µ
towards the end of the rainy season are also important to the shape of the UHI
curve during these months. The difference in cooling rate between urban and rural
areas determines the slope of the curve at the start of the night. Months with
high precipitation rate and wind speeds may see urban areas cooling at a faster
rate than usual after sunset, results in slow UHI development (i.e. gentler slopes
around sunset during December, January and February). As the sun rises, the UHI
intensities drop rapidly in a few hours before stabilizing at noon.
Table 4.9: Time of maximum UHIraw hourly ensemble for each month of the
year.
month of year
hour of UHImax
monsoon
01
07
NE
02
07
NE
03
05
NE
04
05
06
00
00
00
PSW PSW SW
07
04
SW
08
07
SW
09
01
SW
10
23
PNE
11
23
PNE
12
03
NE
A transition occurs around March and the shape of the diurnal curves from
April to June are rather symmetrical with peaks for most stations occurring around
midnight, which is five hours after sunset. Synoptic air temperatures are higher,
wind speeds and precipitation rates are generally lower during this period. The
lower rural µ due to reduced soil moisture creates larger relative difference in cooling potential between rural and urban areas, creating a more “ideal” heat island
formation conditions. During July and August, the typical peak heat island occurrence moves later and takes place closer to sunrise than sunset, although the
diurnal curves are still rather symmetrical compared to January and February.
In September and October, the peak intensities of UHI occur earlier in the
night, prior to midnight. This may be the opposite of the above-mentioned effect.
Lower wind speeds and relatively drier conditions reduces the cooling rate of urban
areas relative to rural areas resulting in quicker development of UHI (i.e. steeper
104
UHI curve at the start of the night). As the north-east monsoon returns in December, the diurnal UHIraw curves are dampened starting from November.
In terms of agreement across stations, the months during the north-east
monsoon have the smallest interquartile range through the day (Figure 4.12). This
suggests that conditions such as strong winds, wet surfaces and low air temperatures
reduce the variability between different stations (and result in a later peak of UHI
as discussed above). Hotter and/or drier months with lower wind speeds (such as
May, June and October) have a larger interquartile range with somewhat earlier
peaks. The ‘dampening’ of UHI intensities in the NE monsoon relative to the
SW monsoon is in agreement with previous studies by Singapore Meteorological
Services (1986), Goh and Chang (1998) and Chow and Roth (2006). The reduction
of UHI intensities attributed to a decrease in soil moisture content due seasonal
rainfall changes has also been also reported in other tropical cities such as Mexico
and Gabarone (Jauregui, 1997 and Jonsson, 2004, respectively). The relatively high
variability in rural µ values is a likely driving force behind UHI variability in the
tropics (Roth, 2007).
4.3.3
Inter-annual trending and cycles of UHI intensities
Beyond the seasonal variability of UHI intensities, variations may also occur at
the inter-annual scale (Pigeon and Masson, 2009). Inter-annual trends in UHI can
be identified by first removing the seasonal trends. As such decomposition is very
sensitive to noise and outliers, this analysis will only be conducted at the station
level for stations with good data continuity.
Seasonal-trend decomposition procedure based on loess (STL) (Cleveland
105
et al., 1990) is used to decompose the UHI series into a seasonal signal, a trend
signal and a remainder (or residual). This procedure is often used for decomposing
climate data (e.g. Dufresne and Bony, 2008; Capilla, 2008). Plots for S07, S15, S22
and S24, demonstrate seasonal double-maxima patterns (except S15 which has a
single peak)(Figures 4.14 and 4.15). The range of values for monthly mean UHI
for the stations are all approximately 1.2◦ C, with the seasonal trend accounting for
variances greater than 0.8◦ C for stations S07, S22 and S24. For station S15, the
seasonal trend has a range of ∼0.6◦ C.
After removing the seasonality, a second background signal emerges with a
range of >0.2◦ C for S07, S22 and S24 and <0.15◦ C for S15. Making the assumption
that the characteristics of station surroundings do not undergo any changes, this
background signal is treated as the inter-annual trend. In the case of the S07, S22
and S4, while the ranges are above the threshold for error of the sensor, they do
not account for much variance and are not consistent between the stations.
Based on the above analysis, although seasonal trends are distinct, interannual trends are not pronounced unlike in cities such as Shanghai (Zhang et al.,
2010). However, as this study covers a period of less than four years, a longer study
may yield clearer results.
2.0
0.0
−0.6
2.00
−0.4
0.0
residual
0.4
1.85
trend
seasonal
0.4
1.4
data
2.6
106
1.0
1.5
2.0
2.5
3.0
3.5
4.0
3.0
3.5
4.0
0.3
0.0
−0.3
2.08
−0.2
0.2
residual
2.02
trend
seasonal
data
1.6 2.0 2.4 2.8
time
1.0
1.5
2.0
2.5
time
Figure 4.14: The decomposition of monthly mean UHI signal into seasonal,
trending and residual components for S07 (above) and S15 (below). y-axis units
are in degrees celsius while x-axis units are in years.
0.4
2.50
−0.3
0.0
residual
0.3
2.40
trend
2.60
−0.4
0.0
seasonal
data
1.8 2.2 2.6 3.0
107
1.0
1.5
2.0
2.5
3.0
3.5
4.0
3.0
3.5
4.0
2.2
0.0
−0.4
2.15 2.25 2.35
−0.2
0.2
residual
trend
seasonal
0.4
1.6
data
2.8
time
1.0
1.5
2.0
2.5
time
Figure 4.15: The decomposition of monthly mean UHI signal into seasonal,
trending and residual components for S22 (above) and S24 (below). y-axis units
are in degrees celsius while x-axis units are in years.
108
4.3.4
Temporal autocorrelation
Temporal autocorrelation analysis was conducted to test for temporal dependence
of UHI. As the UHI dataset exhibits strong diurnal trends, this cyclical trend is
first removed before testing for autocorrelation. Input data for autocorrelation tests
have to be complete datasets, thus stations S22 and S15 were chosen as they represent high-rise and low-rise urban areas and also have one of the more complete
datasets (96 and 95% respectively). Mean hourly data from the period February
2008 to December 2008 (335 days) is chosen to achieve a complete dataset. ∆Tu−r
were chosen to represent UHI as gaps in the time-series will occur with filtering.
Furthermore, lag relationships may be due to factors such as weather conditions
and are thus useful to the analysis. Isolated missing data points are interpolated
using linear approximation (na.approx function in the zoo package in R).
For both stations, the 48-hour autocorrelation function (ACF) plots (Figure
4.16) show that observations occurring within four hours of each observation have
the highest ACFs (>0.30) and the ACF for the same hour on the day before is
∼0.30 for both stations. This suggests that ∆Tu−r values within four hours before
a specific hour are more likely to be related than the value at the same hour on the
day before. Given that diurnal trends have already been removed, the remaining
significant self-correlations suggest that UHI values exhibit strong lagged relationships in the span of a few hours which may be related to soil surface moisture and
rural µ values. Over a longer time span, auto-correlations are significant (DurbinWatson test: p < 0.001) around the same time of day up to approximately 25 days
before each hourly interval, after which ACF values diminish.
109
2-day ACF
S15
ACF
0.4
0.2
0.4
0.0
0.0
0.2
ACF
0.6
0.6
0.8
0.8
1.0
1.0
S22
0.0
0.5
1.0
1.5
2.0
0.0
0.5
1.0
Lag
1.5
2.0
Lag
ACF
0.4
0.2
0.4
0.0
0.0
0.2
ACF
0.6
0.6
0.8
0.8
1.0
1.0
50-day ACF
0
10
20
30
40
50
0
10
20
30
Lag
40
50
Lag
0.6
ACF
0.2
0.4
0.4
0.2
0.0
0.0
ACF
0.6
0.8
0.8
1.0
1.0
335-day ACF
0
50
100
150
200
Lag
250
300
0
50
100
150
200
250
300
Lag
Figure 4.16: 2-day (first row), 50-day (second row) and 335-day (third row)
ACF plots for S15 and S22. Bars beyond the blue dotted lines are statistically
significant. Each lag interval is one day. Note that the first value is 1.0 as it is
the correlation at lag 0 (i.e. self-correlation).
110
4.4
Spatial variability of the thermal environment
Thermal conditions vary not only temporally but also spatially. Spatial variability
can be attributed to two factors. The first is a difference in location within Singapore, i.e. geographical differences. A second spatial consideration is that of land
use and urban morphology. As with the section on temporal variability, specific
relationships between landscape or urban factors will be discussed later. Multidimensional methods such as multiple linear regression and geographically-weighted
regression are known to provide better spatialization of UHI (Szymanowski and
Kryza, 2009). However, these methods require good predictors for multidimensional model building which is beyond the scope of this study. For interpolation
methods that require only the observation data, ordinary kriging and IDW are typical methods. While ordinary kriging is often preferred, the low number of sample
points makes semivariogram estimation difficult and thus IDW is the method chosen.
The difference between the mean daytime and night-time spatial patterns of
heat (and cool) islands is shown in Figure 4.17. For inclusiveness, values from all
stations are used to create the maps. The inverse distance-weighted (IDW) spatial
interpolation method, with distance decay parameterised as the second power, is
used to generate the maps from the station data (and for all other interpolated
maps from here on). The isotherms have a fixed interval of 0.5◦ C and the colour
scale kept identical where possible. Care must be taken when interpreting these
maps as they do not consider any form of weighting and assume distance to be
the sole influencing factor. For example, a small cool park would not show up on
the map unless it is represented by a station. For comparison purposes, Figure 3.6
shows the extent of urbanisation in the study area.
113
The daytime mean UHIraw intensities are rather similar across large parts of
the island and the isotherms are generally far apart from each other. Small cool
islands (UHIraw <0) can be found in the rural north-west and the central catchment
area. Small heat islands of low intensity can be found in residential and industrial
areas across the island. Interestingly, the core of the city does not have a distinctive
heat island formation, possibly due to the amount of tall buildings providing shade
at the street level. The largest mean daytime UHIraw intensity is just above 1.5◦ C
and is located in the middle of the island in a large and dense low-rise residential
area where S05 and S19 are found.
The night-time situation is very different. The night-time mean UHIraw is
most pronounced over the city centre and extends to a considerable extent to the
north and east. Other pockets of warm areas are also present in the industrial areas
near the north and the south-western coast. Night-time mean UHIraw intensities
exceed 3.5◦ C in several areas around the island. A very small cool spot can be seen
within the commercial core, associated with a park. The central catchment and
rural north-west are also relatively cool. Steep isolines suggest that the thermal
gradient is significantly larger at night than during the day. This is to be expected
due to the different rates of cooling between different land uses.
In terms of extreme values, irrespective of time of occurrence, the minimum
UHIraw values across the island are quite consistent as deduced from the limited
number of isolines (Figure 4.18). The lowest minimum value of UHIraw is found at
the station in the central catchment forest. High minimum values of UHIraw are
found at the rural north-west as the reference site is located there. The maximum
values of UHIraw are above 5 ◦ C for most of the island with the lowest values found
in the rural north-west and the central catchment region.
114
4.5
Spatio-temporal variability of the thermal environment
Simultaneous variations across spatial and temporal dimensions are highlighted in
this section. As with the previous section, for inclusiveness, values from all stations
are used to create the maps. All other cartographic elements are identical to maps
in the previous section. Note that UHI values discussed in this section are ensemble
values which represent mean behaviour at various time scales.
4.5.1
Spatial variation of ensemble mean hourly UHI across
a diurnal cycle
Beginning at solar noon (13:00 hrs), we can see distinctive cool islands (∼-0.5◦ C)
around the central catchment area, the rural north-west and in pockets along the
coast (Figure 4.19). Highest mean intensities are weak (∼1◦ C) and occur over lowrise residential and industrial areas. At 15:00 hrs, the cool islands become more
prominent and heat islands remain weak, creating high negative gradients. By 17:00
hrs, the cool islands can be seen to diminish and island-wide variation in UHIraw is
at its minimum.
As the sun begins to set at 19:00 hrs the UHIraw values begin to increase
across the island. A heat island develops in the city area in the south but pockets of
warm islands also develop in other parts while the footprint of cool islands shrink.
At 21:00 hrs, ensemble heat island intensities increase strongly before stabilising at
maximum levels (∼4◦ C) from 23:00 to 07:00 hrs, consistent with previous discussion on variations in time of peak monthly UHI intensities occurrence (Table 4.9).