Characterization and testing of nanofluid cooling technology for electronic systems
Bạn đang xem bản rút gọn của tài liệu. Xem và tải ngay bản đầy đủ của tài liệu tại đây (4.97 MB, 211 trang )
Characterization and Testing of Nanofluid Cooling
Technology for Electronic Systems
Xue Zhengjun
NATIONAL UNIVERSITY OF SINGAPORE
2005
Characterization and Testing of Nanofluid Cooling
Technology for Electronic Systems
Xue Zhengjun
(B. Eng, Shanghai Jiao Tong University)
A THESIS SUBMITTED
FOR THE DEGREE OF MASTER OF ENGINEERING
DEPARTMENT OF MECHANICAL ENGINEERING
NATIONAL UNIVERSITY OF SINGAPORE
2005
Abstract
Name:
Xue Zhengjun
Degree:
Master of Engineering
Dept:
Mechanical Engineering
Thesis Title: Characterization and Testing of Nanofluid Cooling Technology for
Electronic Systems
Abstract
A Nanofluid is an innovative type of highly efficient heat transfer fluid, which was
made by dispersing nanometer-sized metallic or non-metallic particles in various base
fluids. With their superior thermal properties, nanofluids are expected to be a
promising coolant candidate for thermal management systems of next generation high
heat dissipation electronic systems.
In this research, one apparatus for thermal conductivity measurement using the steadystate parallel-plate method was fabricated. Nanofluids with different nanoparticle-base
fluid combinations and different nanoparticle volumetric fractions were calibrated.
A microchannel heat sink (MCHS) liquid cooling test rig was used to investigate the
thermal performance improvement of nanofluid-cooled liquid cooling systems. The
thermal performance of the MCHS cooling system was measured and calculated in
terms of junction-to-inlet and heatsink base-to-inlet thermal resistances. Thermal
resistances and pressure drop across the MCHS with different working fluids under
different flowrates ranging from 0.1 L/min to 0.8 L/min were measured and compared.
Moreover, numerical simulations were conducted to evaluate the convective heat
transfer enhancement of nanofluids within and beyond the range of the current
experiments.
Keywords: Nanofluid, Thermal Conductivity, Microchannel Heat Sink, Thermal
Contact Resistance, Electronics Cooling
Acknowledgements
Acknowledgements
First and foremost, the author would like to express his sincere appreciation and
gratitude to his supervisors, Prof. Andrew Tay A. O. and Dr. Zhang Hengyun, for their
invaluable guidance, suggestions and encouragement throughout the course of his
candidature.
Also, the author would like to extend his thanks to the laboratory technologists of
Nano/Microsystems Integration Laboratory and Thermal Process Laboratory 1 & 2 for
their full support and great assistance in experiment preparation throughout the
duration of this project.
Special thanks to his laboratory colleagues and friends for their kind help and
enlightening advice during the two years’ study and experimentation at NUS.
Last but not least, the author wants to express his deepest appreciation to his family
members and girlfriend for their immense support, love and encouragement.
i
Table of Contents
Table of Contents
Acknowledgements………………………………………………………...……………i
Table of Contents……………………………………………………………………….ii
Summary……………………………………………………………………………….iv
List of Tables………………………………………….……………………………….. v
List of Figures………………………………………………………………………….xi
Nomenclature….……………………………………………………………………...xvi
CHAPTER 1: Introduction……………………………………………………………..1
1.1
Project Background…………………………………………………………1
1.2
Motivation for the Work……………………………………………………6
1.3
Objective of the Work………………………………………………………7
1.4
Organization of the Thesis………………………………………………….8
CHAPTER 2: Literature Review…...………………………………………………….. 9
2.1
Nanofluids Synthesis Techniques…………………………………………..9
2.1.1 Introduction…………………………………………………………9
2.1.2 Two-step Method………………………………………………….10
2.1.3 One-step Method…………………………………………………..12
2.2
Thermal Conductivity Measurement Methods………………………….... 13
2.2.1 Steady-state Parallel-plate Methods……………………………….13
2.2.2 Transient Hot-wire Method………………………………………. 15
2.2.3 Quasi-steady-state Method……………………………………….. 18
2.2.4 Temperature Oscillation Method………………………………….19
2.3
Experimental Study of Thermal Conductivity of Nanofluids……………..21
2.3.1 Nonmetallic Nanoparticles………………….……………………. 21
ii
Table of Contents
2.3.2 Metallic Nanoparticles…………………………………………….23
2.3.3 Nanotubes…………………..…………………………………….. 24
2.4
Models for Predicting Thermal Conductivity of Nanofluids……………...25
2.5
Potential Mechanisms of Thermal Conductivity Enhancement in
Nanofluids…………………………………………………………………29
2.5.1 Microscopic Motions……………………………………………... 29
2.5.2 Liquid Layering at Liquid/Particle Interface……………………... 30
2.5.3 Interfacial Resistance……………………………………………...31
2.5.4 Heat Transportation in Nanoparticles……………………………..32
2.5.5 Effects of Nanoparticle Clustering……………………………….. 33
2.6
Other Important Thermal Properties………………………………………34
2.6.1 Density…………………………………………………………….34
2.6.2 Specific Heat………………………………………………………34
2.6.3 Viscosity………………………………………………………….. 35
2.7
Convective Heat Transfer of Nanofluids………………………………….36
2.7.1 Single Phase Heat Transfer of Nanofluids………………………...36
2.7.2 Two Phase Heat Transfer of Nanofluids…………………………..39
2.8
A Brief Review on Microchannel Heat Sink……………………………... 41
2.9
Closure…………………………………………………………………….44
CHAPTER 3: Thermal Conductivity Characterization of Nanofluids…..…………… 45
3.1
Introduction………………………………………………………………..45
3.2
Nanofluids Preparation…………………………………………………… 45
3.2.1 Nanoparticle Materials and Base Fluids………………………….. 45
3.2.2 Nanofluids Preparation Procedure………………………………...47
3.2.3 Stability of As-prepared Nanofluids………………………………49
iii
Table of Contents
3.3
Experiment Design and Operation Principles……………………………..50
3.3.1 Apparatus for Thermal Conductivity Testing……………………..50
3.3.2 Experimental System Construction………………………………. 53
3.3.3 Experiment Procedures……………………………………………55
3.3.4 Data Reduction…………………………………………………… 56
3.3.5 Experimental System Calibration………………………………… 57
3.4
Results and Discussion…………………………………………………… 59
3.4.1 One Typical Experiment Run and Its Data Reduction…………… 59
3.4.2 Summary of Experimental Results……………………………….. 61
3.4.3 Comparison with Experimental Results from Literature and
Theoretical Model Prediction…………………………………….. 68
3.4.4 Error Analysis……………………………………………………..71
3.5
Numerical Simulation……………………………………………………..75
3.5.1 Governing Equations……………………………………………... 75
3.5.2 Boundary Conditions……………………………………………... 77
3.5.3 Simulation Results and Discussion………………………………. 79
3.6
Closure…………………………………………………………………….84
CHAPTER 4: Experimental Characterization of Nanofluid-Cooled Microchannel Heat
Sink Cooling System……………………………………….………… 85
4.1
Introduction………………………………………………………………..85
4.2
Design of Experiment and Operating Priciples……………………........... 85
4.2.1 Thermal Test Section……………………………………………...85
4.2.2 Construction of Experimental System……………………………. 89
4.2.3 Instrumentation and Measurements……………………………….91
4.2.3.1 Micropump……………………………………………... 91
iv
Table of Contents
4.2.3.2 Heat Exchanger……………………………………….....91
4.2.3.3 Power Supplies…………………………………………. 91
4.2.3.4 Flow Meter………………………………………………92
4.2.3.5 Pressure Transducer……………………………………..92
4.2.3.6 Temperature Measurement……………………………... 93
4.2.4 Experiment Procedures and Data Reduction……………………... 95
4.2.4.1 Experiment Procedures………………………………….95
4.2.4.2 Data Reduction…………………………………………. 96
4.3
Experimental Results and Discussion……………………………………..98
4.3.1 Experimental Results of Al2O3-water Nanofluids………….……. 99
4.3.2 Experimental Results of SiC-water Naofluids…………………...103
4.3.3 Experimental Results of Nanofluids at High Temperature………107
4.3.4 Experimental Results of Single Channel Heat Sink…………….. 109
4.3.5 Error Analysis……………………………………………………116
4.4
Closure…………………………………………………………………...117
CHAPTER 5: Numerical Simulation of Microchannel Heat Sink Cooling System…118
5.1
Introduction………………………………………………………………118
5.2
Theoretical Analysis …………………………………………………..... 118
5.2.1 Thermal Resistance Network Analysis…………………………..118
5.2.2 Hydrodynamic Analysis………………………………………… 121
5.2.3 Thermal Performance Analysis…………………………………. 124
5.3
Numerical Model………………………………………………………... 125
5.3.1 Model Geometry…………………………………………………125
5.3.2 Governing Equations……………………………………………. 127
5.3.3 Boundary Conditions……………………………………………. 128
v
Table of Contents
5.3.4 Coolant Properties………………………………………………. 129
5.3.5 Simulation Results Calculation…………………………………..130
5.4
Simulation Results and Discussion………………………………………131
5.4.1 Validation of Numerical Model………………………………….131
5.4.1.1 Pressure Drop…………………………………………..132
5.4.1.2 Junction-to-inlet Thermal Resistance…………………. 133
5.4.1.3 Discussion……………………………………………...133
5.4.2 Simulation Results for Nanofluids……………………………….138
5.4.2.1 Al2O3-water Nanofluids………………………………..138
5.4.2.2 SiC-water Nanofluids…………………………………. 142
5.5
Closure…………………………………………………………………...146
CHAPTER 6: Conclusion………………………………………………………..…..147
REFERENCES……………………………………………………………………… 149
APPENDICES……………………………………………………………………… 157
vi
Summary
Summary
Great advances of today’s leading edge high performance and multi-functional
electronic devices have led to great challenges in thermal management. Although
various enhanced heat transfer mechanisms were introduced to meet the stringent
requirements of electronic cooling systems, the poor thermal properties of
conventional heat transfer fluid become one of the main constraints. The great
development of emerging nanotechnology in nanopowder preparation process
enabled us to disperse nanometer-sized particles in traditional heat transfer fluids
to form an innovative type of heat transfer fluid, which was called nanofluid. With
its remarkably high thermal conductivity, nanofluid was expected to be a
promising candidate as the working medium for thermal management systems of
next generation high heat flux electronic systems. This research intended to
characterize the thermal conductivity of nanofluids and test the thermal
performance improvement of liquid cooling system induced by the application of
nanofluids.
One apparatus for thermal conductivity measurement using steady-state parallelplate method was fabricated. Nanofluids with different nanoparticles-base fluid
combination and different nanoparticles volumetric fractions were calibrated.
Effective thermal conductivity values predicted by different theoretical models
were compared with the obtained experiment results. Various mechanisms
contributed to the significant increase in thermal conductivity of nanofluids were
also discussed.
vii
Summary
A microchannel heat sink (MCHS) liquid cooling test rig was used to investigate
the thermal performance improvement of liquid cooling system utilizing
nanofluids. Thermal performance of the nanofluid-cooled MCHS system was
measured and calculated in terms of chip junction-to-heatsink inlet and heat sink
base-to-heat sink inlet thermal resistances. Thermal resistances and pressure drop
penalty across the MCHS with different working fluid under different flowrates
ranging from 0.1L/min to 0.8/min were measured and compared. Numerical
simulations of the MCHS liquid cooling system using commercial software
(FLUENT) was conducted to evaluate the convective heat transfer enhancement of
nanofluids within and out of current experiment range.
Extensive experiment and simulation results in this study strongly indicated the
potential of nanofluids as a superior working media. Further, the nanofluid-cooled
MCHS liquid cooling system was proved to be feasible and efficient for thermal
management of high heat dissipation electronic systems.
Thesis Advisors:
1. Dr. Andrew A.O. Tay, Professor, Department of Mechanical Engineering,
National University of Singapore.
2. Dr. Zhang Hengyun, Senior Research Engineer, Institute of Microelectronics.
viii
List of Tables
List of Tables
Table 1.1
Comparison of thermal conductivity values for representative solids
and liquids at room temperature and 1atm…………………………..4
Table 2.1
Summary of theoretical models for effective thermal conductivity
prediction of a mixture…………………………………………......28
Table 3.1
Physical and chemical properties of base fluids used in current
experiments……………………………….………………………..46
Table 3.2
Physical and Chemical Properties of Nanoparticles Used in Current
Experiments at Room Temperature and 1atm…………………….. 47
Table 3.3
Specifications of Power Supplies………….…………………….... 54
Table 3.4
Thermal Conductivity of DI Water and Ethylene Glycol……….....58
Table 3.5
Heater Power Inputs for Thermal Conductivity Testing of 1 vol%
SiC-water Nanofluid……………………………………………..... 59
Table 3.6
Summary of Experimental Results of Thermal Conductivity
Characterization……………….…………………………………... 62
Table 3.7
PTFE Spacer Deformation Calculation………………………….... 72
Table 3.8
Analysis of Experimental Uncertainty for Thermal Conductivity
Measurement………………………..………………………….......75
Table 3.9
Simulation Inputs of One Typical Case…………………………....79
Table 3.10
Summary of Simulation Results………….……………………...... 83
Table 4.1
Summary of MCHS Parameters……….………………………...... 86
Table 4.2
Specifications of Power Suplies……….………………………...... 92
Table 4.3
Experimental Results Summary of Al2O3-water Nanofluids…........99
Table 4.4
Experimental Results of SiC-water Nanofluids…………………..103
Table 4.5
Summary of the Experimental Results at High Working
Temperature…………………………….………………………... 108
Table 4.6
Experimental Results Summary of Aluminium Single Channel Heat
Sink……………………………………………………………..... 110
Table 4.7
Experimental Results Summary of Copper Single Channel Heat
Sink………………………………….………………………….... 114
ix
List of Tables
Table 4.8
Analysis of Experimental Uncertainty for Thermal Resistance..... 117
Table 5.1
Summary of MCHS Geometry Parameters…………………….... 123
Table 5.2
Calculation of Results of the Pressure Drop across Thermal Test
Section…………………………….…………………………....... 124
Table 5.3
Experimental, Simulation and Theoretical Results of MCHS Cooling
System Using DI water…………….…………………………...... 132
Table 5.4
Property Summary of Al2O3-water Nanofluids………………...... 138
Table 5.5
Summary of Simulation Results of Al2O3-water Nanofluids……. 138
Table 5.6
Property Summary of Al2O3-water Nanofluids……………….....143
Table 5.7
Summary of Simulation Results for SiC-water Nanofluids……... 143
x
List of Figures
List of Figures
Figure 1.1
Temperature differences attainable as a function of heat flux for
various heat transfer modes and coolants…………...…….………… 3
Figure 1.2
Evolution of air/liquid cooling capabilities... …………………………...3
Figure 2.1
Schematic of thermal conductivity measurement apparatus using steady
state parallel plate method………………….………………………….. 14
Figure 2.2
Schematic diagram of transient hot-wire apparatus for measuring
thermal conductivities of nanofluids………………………………. 16
Figure 2.3
Schematic diagram of apparatus for measuring thermal conductivity
using quasi-steady state method………………..………………….. 19
Figure 2.4
The fluid volume for analysis……………………………………… 20
Figure 2.5
Schematic diagram of apparatus for measuring thermal conductivity
using transient oscillation method…..……………………………... 20
Figure 2.6
Effective thermal conductivity enhancement due to liquid layering at
liquid/particle interface ……………………….……………………31
Figure 2.7
Effective thermal conductivity enhancement due to increased
effective volume……………………..…………………………….. 33
Figure 2.8
A typical liquid-cooled microchannel heat sink cooling system…... 42
Figure 3.1
SEM image of 50nm SiC nanoparticle…………………………….. 46
Figure 3.2
2 vol% Al2O3-water nanofluid……………………………………...49
Figure 3.3
2 vol% CuO-water nanofluid……………………………………….49
Figure 3.4
2 vol% SiC-water nanofluid after being placed stationary for two
weeks…………………………………………………..…………... 50
Figure 3.5
Schematic layout of the apparatus for liquid thermal conductivity
measurement…………………………..…………………………… 51
Figure 3.6
Experiment apparatus with sample loading………………………...52
Figure 3.7
Assembled experiment apparatus……....………………………….. 52
Figure 3.8
Schematic diagram of experiment system…………………………. 53
Figure 3.9
Picture of the experiment system…………………………………...54
Figure 3.10 Thermal conductivity calculation theory…………………………... 56
xi
List of Figures
Figure 3.11 Temperature history at different location (1 vol% SiC-water
nanofluid)….......................................................................................60
Figure 3.12 Temperature difference between hot plate and cold plate…………. 60
Figure 3.13 Changing of thermal conductivity with time (1 vol% SiC-water
nanofluid…………………………………………………………… 61
Figure 3.14 Effective thermal conductivity of SiC-water nanofluids…………... 63
Figure 3.15 Ratio of thermal conductivity of SiC-water nanofluid to that of D.I.
water …………………………………..…………………………... 63
Figure 3.16 Effective thermal conductivity of Al2 O3-water nanofluids………... 64
Figure 3.17 Ratio of thermal conductivity of Al2O3-water nanofluids to that of
D. I. water………………………………………………………….. 64
Figure 3.18 Effective thermal conductivity of CuO-water nanofluids…………. 65
Figure 3.19 Ratio of thermal conductivity of CuO-water nanofluids to that of
D. I. water ……………………………………………………..…... 66
Figure 3.20 Effective thermal conductivity of SiC-ethylene glycol nanofluids... 66
Figure 3.21 Ratio of thermal conductivity of SiC-ethylene glycol nanofluids to
that of ethylene glycol…………………………………………..…. 67
Figure 3.22 Experimental Results and HC model predictions for SiC-water
nanofluids………………………………………………………….. 70
Figure 3.23 Experimental results and HC model predictions for Al2O3-water
nanofluids………………………………………………………….. 70
Figure 3.24 Experimental results and HC model predictions for CuO-water
nanofluids …………………………………………………………. 71
Figure 3.25 Experimental results and HC model predictions for SiC-ethylene
glycol nanofluids…………………………………………………... 71
Figure 3.26 Half cross section of the fabricated experiment apparatus………… 75
Figure 3.27 Boundary conditions of numerical simulation……………...………77
Figure 3.28 Mesh of numerical model………………………………………….. 79
Figure 3.29 Temperature contour of the apparatus……………………………... 80
Figure 3.30 Temperature distribution at r=0.027m…...…………………………81
Figure 3.31 Velocity magnitude contour of the experiment apparatus………….81
Figure 3.32 Velocity vector plot of simulation results…………………………..82
xii
List of Figures
Figure 3.33 Plot of simulation results……………………….………………….. 84
Figure 4.1
Schematic diagram of the thermal test section (side and cross section
view) ………………………………………………………………. 85
Figure 4.2
Dimensions of MCHS………………………………………………86
Figure 4.3
Picture of the copper single channel heat sink……………………...87
Figure 4.4
Picture of the thermal test board……………………………………88
Figure 4.5
Picture of assembled thermal test section…………………………..88
Figure 4.6
Schematic diagram of MCHS cooling system……….……………..90
Figure 4.7
Picture of MCHS cooling system…………….……………………. 90
Figure 4.8
Picture of the HG0024 Micropump………………………………... 91
Figure 4.9
Picture of side and top views of compact heat exchanger…………. 91
Figure 4.10 Picture of volumetric flow meters…………………….…………… 92
Figure 4.11 Picture of pressure transducer….…………….……………………..93
Figure 4.12 Picture of Keithley 2400 source meter…………………………….. 94
Figure 4.13 Picture of HP34970A data logger…………………………………. 94
Figure 4.14 Thermal resistances of D.I. water-cooled MCHS cooling system...100
Figure 4.15 Pressure drop across the MCHS (D.I. water).……………………. 101
Figure 4.16 R ji of Al2O3-water nanofluid-cooled MCHS cooling system……..101
Figure 4.17 Improvement of R ji in Al2O3-water nanofluid-cooled MCHS cooling
system …………………………………….……………………… 102
Figure 4.18 Pressure drop across the MCHS (Al2 O3-water nanofluids).………103
Figure 4.19 R ji of 1 vol% SiC-water nanofluid-cooled MCHS cooling
system…………………………………………………………….. 104
Figure 4.20 Improvement of R ji in SiC-water nanofluid-cooled MCHS cooling
system.……………………………………………………………. 104
Figure 4.21 Pressure drop across the MCHS (1 vol% SiC-water nanofluids)… 105
Figure 4.22 R ji as a function of time (2 vol% and 3 vol% SiC-water
nanofluids)…………………………………..……………………. 106
xiii
List of Figures
Figure 4.23 Pressure drop across the MCHS as a function of time (2 vol% and 3
vol% SiC-water nanofluids).………………………………..……. 106
Figure 4.24 Picture of the clogged MCHS……………………………………..107
Figure 4.25 R ji and R jb for aluminium SCHS at two different installations…..111
Figure 4.26 Pressure drop for aluminium SCHS at two different installations……
……………………………………………………………………. 111
Figure 4.27 R jb of aluminium SCHS at different mounting pressure conditions…
……………………………………………………………………. 112
Figure 4.28 R ji of aluminium SCHS at different mounting pressure conditions…
……………………………………………………………………. 112
Figure 4.29 R ji of copper SCHS for different coolants.……………………….115
Figure 4.30 Pressure drop of copper SCHS for different coolants……………. 115
Figure 5.1
Thermal resistance network of MCHS cooling system…………... 119
Figure 5.2
Geometric model of MCHS cooling system………………………125
Figure 5.3
Mesh of the numerical model……………..……………………… 126
Figure 5.4
Mesh of the microchannels and heat sink fins…………………….127
Figure 5.5
Experiment, numerical simulation and theoretical analysis results of
pressure drop across the thermal test section……………………...132
Figure 5.6
Comparison of R ji from experimental results and numerical
simulation ….…………………………………………………….. 133
Figure 5.7
Temperature distribution of water-cooled MCHS at flowrate of
0.0516 l/min-1……………………………………………………. 134
Figure 5.8
Temperature distribution of water-cooled MCHS at flowrate of
0.0516 l/min-2……………………………………………………..134
Figure 5.9
Temperature contour of the bottom surface of thermal test chip…
……………………………………………………………………. 135
Figure 5.10 Temperature contour of the central surface………………………. 136
Figure 5.11 Pressure contour of the central surface……………………………136
Figure 5.12 Velocity magnitude contour of cross section 1mm from heat sink
base plane………………………………………………………….137
Figure 5.13 Streamline of coolant in MCHS and inlet/outlet ports…………… 137
xiv
List of Figures
Figure 5.14 R ji of Al2O3-water nanofluid-cooled MCHS cooling system……..139
Figure 5.15 Pressure drop of D.I. water and Al2O3 -water nanofluid-cooled MCHS
cooling system…………………………………………...……….. 140
Figure 5.16 Experimental and simulation results of R ji for MCHS cooling system
using 2~3 vol% Al2O3-water nanofluids.………………………… 140
Figure 5.17 Experiment and simulation results of pressure drop across thermal
test section for MCHS cooling system using 2~3 vol% Al2O3-water
nanofluids……………………………………………………...…. 141
Figure 5.18 Comparison of simulation results for MCHS cooling system using
different coolant specific heat value……………………..……….. 142
Figure 5.19 R ji of D.I. water and SiC-water nanofluid-cooled MCHS cooling
system.…………………………………………………………….144
Figure 5.20 Pressure drop of D.I. water and SiC-water nanofluid-cooled MCHS
cooling system.………………………………………..………….. 144
Figure 5.21 Experiment and simulation results of R ji for MCHS cooling system
using 1 vol% SiC-water nanofluid……..………………..……….. 145
Figure 5.22 Experimental and simulation results of pressure drop across thermal
test section for MCHS cooling system using 1 vol% SiC-water
nanofluid……….………………………………………..……….. 145
xv
Nomenclatures
Nomenclatures
Symbols
A
Surface area of upper plate, m2
Ach
Channel cross section area, m2
Ah
Surface area of lower surface of hot plate, m2
As
Surface area of spacers, m2
b
Channel height, m
cp
Specific heat at constant pressure, J/kg K
c pnf
Specific heat of nanofluid at constant pressure, J/kg K
c pp
Specific heat of particle at constant pressure, J/kg K
Dh
Hydraulic diameter, m
e
Relative uncertainty
ek
Relative uncertainty of thermal conductivity
eR
Relative uncertainty of thermal resistance
f app
Apparent friction factor
h
Local heat transfer coefficient, W/(m2-0C)
H
Mean curvature
keff
Effective thermal conductivity, W/m-K
k 'eff
Thermal conductivity, W/m-K
kl
Thermal conductivity of liquid, W/m K
klayer
Thermal conductivity of liquid nanolayer, W/m-K
kp
Thermal conductivity of particle, W/m-K
xvi
Nomenclatures
k pe
Equivalent thermal conductivity of solid particle-liquid nanolayer
structure, W/m-K
ks
Thermal conductivity of spacer, W/m K
n
Empirical shape factor, n = 3/ψ
Nu
Nusselt number
p
Pressure, Pa
q
Heat flux, W/m2
Q
Heating power, W/m2
r
Diameter of solid particle, m
Rbi
Inlet-to-heat sink base thermal resistance, 0C/W
Rbulk
Coolant bulk thermal resistance resistance, 0C/W
Rc
Contact thermal resistance, 0C/W
Rheat sin k
Thermal resistance of heat sink, 0C/W
R jb
Junction-to-heat sink base thermal resistance, 0C/W
R ji
Junction-to-inlet thermal resistance, 0C/W
R jr
Junction-to-reservoir thermal resistance, 0C/W
Rsi
Thermal test chip conductive thermal resistance, 0C/W
Rspr
Thermal spreading resistance, 0C/W
Rcond
Conduction thermal resistance, 0C/W
Rconv
Convection thermal resistance, 0C/W
Rconstr
Constriction thermal resistance, 0C/W
Re
Reynolds number
xvii
Nomenclatures
Rei
Reynolds number at heat sink inlet
Reo
Reynolds number at heat sink outlet
T
Temperature, 0C
Ta
Ambient temperature, 0C
Th
Mean temperature of lower hot plate surface, 0C
Ti
Temperature of the liquid at MCHS inlet port, 0C
Tj
Thermal test chip junction temperature, 0C
Tl
Mean temperature of upper cold plate surface, 0C
Tr
Temperature of reservoir, 0C
Tref
Reference temperature, 0C
wch
Channel width, m
ww
Channel wall width, m
X
Axial distance along the channel, m
X+
Dimensionless axial distance along the channel, X /(Re Dh )
Greek Symbols
α
Channel aspect ratio, wch / b
β
Ratio of the liquid nanolayer thickness to nanoparticle radius, h / r
γ
Thermal conductivity ratio, klayer / kl
δ
Spacer thickness/distance between plates, m
δR
Overall uncertainty
µ
Dynamic viscosity of liquid, kg/m-s
µl
Dynamic viscosity of liquid, kg/m-s
xviii
Nomenclatures
µ nf
Dynamic viscosity of nanofluid, kg/m-s
υ
Kinetic viscosity, m2/s
ρ
Density, kg/m3
σ
Surface tension, N/m
φ
Volumetric fraction, vol%
ψ
Sphericity, surface area/volume
ω
Angular velocity, rad/s
Subscripts
ch
Channel
f
Fluid
g
Gas
nf
Nanofluid
p
Particle
lam
Laminar
turb
Turbulent
xix
CHAPTER 1
Introduction
CHARPTER 1: INTRODUCTION
1.1
Project Background
Since the first transistor was invented in 1947 and the first integrated circuit (IC) was
developed independently twelve years later, the development of IC technology has
largely kept pace with Moore’s Law during the last four decades, with performance
doubling roughly every 18 months. The ever-increasing demand for high performance,
multifunctional and miniaturized IC devices has led to an exponential increase in
transistor density, clock speed and, hence, a tremendous increase in the heat flux
dissipated. Thermal management has increasingly become one of the main constraints
in the development of leading edge highly integrated electronic devices and systems.
As the latest International Technology Roadmap for Semiconductors predicts (ITRS,
2003), cooling levels of next generation high performance electronic components such
as processors, CMOS and Bipolar devices are projected to reach the 100~150W range
and the dissipated heat flux may approach 100W/cm2 in the near future. In the other
hand, compared with the high heat dissipation, the upper junction temperature limit of
most cost-performance and high-performance electronic components is lower than
100oC (NEMI, 2002). Highly elevated junction temperatures and the associated
thermal environment could lead to overheating, reducing component performance and
drastic acceleration in failure rate, which was probably caused by thermally-induced
mechanical creep in bonding materials, parasitic chemical reactions and dopant
diffusion etc. It has been well documented that the failure rate of a silicon chip could
be doubled for every 10 oC to 20oC increase in junction temperature (Tummala, 2001).
Therefore, providing high performance cooling solutions to sustain high heat flux and
simultaneously maintain components working temperature within tolerable range has
1
CHAPTER 1
Introduction
become one of the biggest challenges in the thermal management of electronic
systems.
In view of the great challenges in thermal management, various conventional and
enhanced thermal management strategies have been introduced to meet the stringent
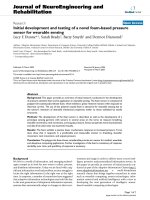
cooling requirements of state-of-the-art IC devices. As it can be seen in Figure 1.1,
different cooling techniques can be used to remove heat from chips but each technique
and coolant leads to a distinct variation of the chip-to-fluid temperature difference
with heat flux. At a typical allowable temperature difference of 60 oC, the combined
free convection and radiation cooling of air is effective only at heat fluxes below
0.05W/cm2 and forced convection cooling in air is unlikely to provide a heat removal
capability in excess of 1W/cm2. Consequently, large heat sinks are widely adopted to
facilitate the dissipation of high heat fluxes from component surfaces. However, with
the constraints in dimension, spreading resistance and low air-side heat transfer
coefficient, the heat rejection limit of traditional fan-heatsink air cooling system can
only go up to 50W/cm2 (Saini and Webb, 2002). As shown in Figure 1.2, for
electronic components with heat flux approaching or exceeding 10W/cm2, attention
should be turned to various direct and indirect liquid cooling strategies with or without
phase change. For electronic components with extremely high heat flux which may be
beyond 50W/cm2, advanced cooling mechanisms such as pool boiling, jet
impingement, spray cooling and microchannel heat sink have been proposed.
One major constraint in electronic cooling is the inherently poor thermal performance
of conventional heat transfer fluids. Although various enhanced cooling strategies
have been introduced, the poor thermal properties, especially the low thermal
conductivity, of traditional coolants significantly limit the efficiency of heat removal
mechanisms.
2
CHAPTER 1
Introduction
Figure 1.1: Temperature differences attainable as a function of heat flux for various heat
transfer modes and coolants (Tummala et al., 1996-1997).
Figure 1.2: Evolution of air/liquid cooling capabilities (Tummala et al., 1996-1997).
Conventional heat transfer fluids have very low thermal conductivity especially when
compared to most solids. As can be seen in Table 1.1, even for a good coolant such as
water, its thermal conductivity is only around 0.62 W/m-K at room temperature and
3