Development of a bioreactor for in vitro engineering of soft tissues
Bạn đang xem bản rút gọn của tài liệu. Xem và tải ngay bản đầy đủ của tài liệu tại đây (8.08 MB, 151 trang )
DEVELOPMENT OF A BIOREACTOR FOR IN-VITRO
ENGINEERING OF SOFT TISSUES
KYAW MOE
NATIONAL UNIVERSITY OF SINGAPORE
2005
DEVELOPMENT OF A BIOREACTOR FOR IN-VITRO
ENGINEERING OF SOFT TISSUES
KYAW MOE
(B.Eng. (Hons.), YTU, Yangon)
A THESIS SUBMITTED
FOR THE DEGREE OF MASTER OF ENGINEERING
DEPARTMENT OF MECHANICAL ENGINEERING
NATIONAL UNIVERSITY OF SINGAPORE
2005
ACKNOWLEDGEMENT
I am really pleased to express my sincere appreciation and gratitude to many
peoples in National University of Singapore and this dissertation would not have been
existed without the much assistance of them.
First, I would like to express my deepest gratitude and heartfelt thanks to my
project supervisors: Associate Professor Toh Siew Lok, Deputy Head, Division of
Bioengineering, National University of Singapore, Associate Professor Tay Tong Earn
and Associate Professor Goh Cho Hong, James, Research Director, Department of
Orthopaedic Surgery, National University of Singapore, for their mutual support, care and
invaluable advices throughout the course of this study. Their knowledge and technical
expertise regarding the project play significant role in completion of dissertation with
achievements in time.
Then, my special thanks go out to Assistance Professor Dietmar W.Hutmacher
and Mr. Ng Kee Woei for the supply of Human Dermal Fibroblasts cells and advice in the
cell culturing.
I also would like to express my sincere thanks to Associate Professor Michael
Raghunath and Dr Ricardo Rodolfo Lareu for their technical advice.
I owe my thanks to Dr Ouyang Hongwei, Dr Ge Zigang (Orthopaedic Diagnostic
Centre), Dr Sambit Sahoo (Division of Bioengineering) and Mr. Kwan Meng Sang
(Vincent) for their invaluable advice and assistance in this study.
I also would like to express my appreciation to Ms Lee Yee Wei (Laboratory
Officer, Tissue Repair Lab), Mr Zhang Yan Zhong (Laboratory Officer, Biomechanics
i
Lab), Mr Cecep Lukman Hakim (Research Engineer) and Mohammad Zahid Hossain
for their kind help and support.
My special thanks also go out Mr. Peter Cheong Theam Hock, Mr. Abdul
Malik and Mr. Chiam Tow Jong, from Applied Mechanics Division, for their technical
support.
I would like to express my heartfelt thanks to my parents and my families for their
understanding, moral support and love during my study period.
Last but not least, I would like to express my sincere gratitude to Ms Cho Kyi
Lwin @ Sun Li Hua for her mutual support, encouragement, patience and understanding,
without which this project would not be succeed.
ii
SUMMARY
The injuries of the ligament and tendon are very common. Surgical reconstruction is often
recommended because of poor intrinsic healing. The current methods of surgical
treatment, including allografts, autografts and synthetic graft replacement exhibit limited
success. Some limitations for these methods are donor site morbidity, rejection, infection,
and fatigue failure. Tissue engineering offers the possibility of replacing damaged human
tissue with functional neotissue (engineered tissue) with similar mechanical and functional
characteristics. One approach of tissue engineering for replacing damaged tissue is to
culture the cell–scaffold composite in a bioreactor in-vitro for a period of time before
transplantation.
The aim of this research is to design a bioreactor and to investigate the effect of cyclic
strain on cell growth and effect of strain frequency on cellular morphology. A bioreactor
was designed and fabricated using polycarbonate. Human dermal Fibroblast cells (HDFs)
seeded on knitted PLGA scaffolds were strained with 1.8% strain and 0.1 Hz frequency.
After two weeks straining at 4 hours per day, cell seeded scaffolds were harvested and
analyzed for cell morphology, cell proliferation rate and RT-PCR analysis.
When compared with unstrained samples, the shapes of cells are more elongated in
strained sample and show alignment due to cyclic straining. The mean nuclei lengths of
cells from strained and unstrained samples are 8.05 ± 2.39 µm and 7.46 ± 2.35 µm
respectively. The cell proliferations in strained samples are also higher than in unstrained
samples. The mRNA level of Collagen type I, collagen type III and Tenascin-C are also
higher in strained sample. These show that cyclic mechanical straining has positive effects
on cell growth.
iii
TABLE OF CONTENTS
i
Acknowledgement
Summary
iii
Table of contents
iv
Nomenclature
ix
List of figures
x
List of tables
xv
Chapter
Chapter
1.
Introduction
1
1.1
Objectives of this Study
2
1.2
Thesis Organization
2
2
Literature Survey
4
2.1
Ligament and Tendon
4
2.2
Biochemical Constituents
6
2.3
Biomechanics
7
2.3.1
Structural Properties
7
2.3.2
Viscoelastic Properties
9
2.4
Tendon/Ligament Injury
11
2.4.1
Prevalence
11
2.4.2
Mechanism of injury
11
2.4.3
Healing and Re-injury
13
iv
Chapter
Chapter
2.5
Current Therapy for Ligament
15
2.6
Tissue Engineering
16
2.6.1
Cells
17
2.6.2 Scaffolds
18
2.6.3
Bioreactor
19
2.7
Existing Straining Bioreactors
19
2.7.1
Cell Stretcher
19
2.7.2
Cell Straining system driven by Linear Actuators
21
2.7.3
Straining system driven by a Crank Mechanism
23
2.7.4 Spool design Bioreactor
25
2.7.5
Advanced Bioreactor
26
3
Preliminary Study
31
3.1
Scaffold preparation and Cell Culture
31
3.2
Bioreactor setup and Cell seeding
32
3.3
Cyclic Straining and Histology examination
33
3.4
Results and discussion
35
3.4.1
Transverse section
35
3.4.2
Longitudinal Section
36
4.
Design and Fabrication of Bioreactor
40
4.1
Design Criteria
40
4.2
Material selection
41
4.3
Proposed Bioreactor design
43
v
Chapter
4.4
Fabricated Bioreactor design
45
4.4.1
Overall design
46
4.4.2
The Actuating System
47
4.4.3
Petri Dish- Base Assembly
49
4.4.4
The clamping system
51
4.4.5
The Control system
52
4.4.6
Load and Displacement Monitoring system
53
5
Experimental Work
55
5.1
Cell Culture
55
5.2
Scaffold Preparation
56
5.3
Bioreactor Setup
58
5.4
Cell seeding
60
5.5
Assessment of the Engineered Tissue
62
5.5.1
Cell attachment, proliferation (SEM/ LSCM)
62
5.5.2
Cell proliferation studies (Alamar Blue Assay)
64
5.5.3
Cell morphology, ECM (Histology with H&E staining)
65
5.5.4
PCR Analysis of ECM Proteins
68
5.5.4 RNA Extraction using Qiagen RNeasy Kit®:
.1
5.5.4 Reverse Transcriptase–PCR using “Qiagen® One-Step
.2
RT-PCR Kit”
68
5.5.4
.3
Analysis of RT-PCR products by Agarose Gel
Electrophoresis
71
5.5.5
Collagen Assay (Soluble & Insoluble)
73
5.5.5
.1
Collagen Assay (Soluble collagen released into Medium)
74
69
vi
Chapter
Chapter
References
5.5.5
.2
Collagen Assay (Insoluble collagen deposited on the
scaffold)
75
5.5.6
Immunohistochemistry (Antibody Staining)
76
5.5.7
Biomechanical Testing
78
6.
Results and Discussions
81
6.1
Cell attachment, proliferation (SEM/ LSCM)
81
6.2
Cell proliferation studies (Alamar Blue Assay)
84
6.3
Cell morphology (Histology with H&E staining)
85
6.3.1
Transverse section
85
6.3.2
Longitudinal Section
86
6.3.3
Comparative Study on Different Frequency of Straining
(0.1 Hz & 1 Hz)
90
6.4
PCR Analysis of ECM Proteins
92
6.5
Collagen Assay (Soluble & Insoluble)
96
6.5.1
Collagen Assay (Soluble collagen released into Medium)
96
6.5.2
Collagen Assay (Insoluble collagen deposited on the
scaffold)
97
6.6
Immunohistochemistry (Antibody Staining)
98
6.7
Biomechanical Testing
100
7.
Conclusions and Recommendations
103
7.1
Conclusions
103
7.2
Recommendations for Future Research
105
107
vii
112
Publication
Appendix
A
Technical drawing of the Bioreactor
113
Appendix
B
Technical Specifications of RVDT
121
Appendix
C
Technical Specifications of Load cell
122
Appendix
D
Technical Specifications of the 5 Phase stepper motor
124
Appendix
E
Technical Specifications of Controller
127
Appendix
F
Program for Stepper Motor
129
Appendix
G
Alamar Blue Assay Protocol
130
Appendix
H
Data Analysis for mechanical testing
133
viii
NOMENCLATURE
ACL,
Anterior Cruciate Ligament
CMFDA/CFDA,
5-Chloromethyl Fluorescein Diacetate
DMEM,
Dulbecco’s Modified Eagle’s Medium
DNA
deoxy-ribonucleic acid
dNTP,
deoxynucleotides
ECM,
Extracellular Matrix
FBS,
Foetal Bovine Serum
GAPDH,
Glyceraldehyde Phosphate Dehydrogenase
ILM,
Inverted Light Microscopy
LAD
Ligament-Augmentation Device
LSCM,
Laser Scanning Confocal Microscopy
mRNA
messenger ribonucleic acid
PBS,
Phosphate Buffered Saline
PCR,
Polymerase Chain Reaction
PGA,
Poly (glycolic acid)
PLA,
Poly (lactic acid)
PLGA,
Poly (lactide-co-glycolide)
PLLA,
Poly (l-lactic acid)
RT-PCR,
Reverse-Transcriptase-mediated PCR
SD,
Standard Deviation
SEM,
Scanning Electron Microscopy
UTS,
Ultimate Tensile Strength
ix
List of Figures
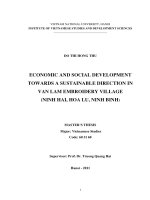
Figure 2.1
(a) Tendons of the foot (b) Ligaments of the knee joints.
4
Figure 2.2
Schematic diagram of the structural hierarchy of ligament.
5
Figure 2.3
A typical (a) load-elongation curve and (b)stress- strain curve for
tendon/ Ligament.[Woo et al, 1998]
7
Figure 2.4
Cyclic load-elongation behavior shows that during cyclic
loading, the loading and unloading curves do not follow the same
path and create hysteresis loops indicating the absorption of
energy; [Weiss et al, 2001].
10
Figure 2.5
Graph showing the stress-strain curve for tendon. Wavy lines
indicate the wavy configuration of the tendon at rest, straight
unbroken lines indicate the effect of tensile stresses, one or two
broken lines indicate that the collagen fibers are starting to slide
past one another as the intermolecular cross-links fail, and the set
of completely broken lines indicate macroscopic rupture due to
the tensile failure of the fibers and the interfibrillar shear failure.
[Maffullin, 1999]
12
Figure 2.6
Re-injury in tendon and ligaments may occur when the pain-level
is lower than pain threshold and healing is not complete.[Woo et
al,1988]
14
Figure 2.7
Schematic of the cell stretcher. The cell stretch membrane is
placed in between the PEEK slider components and clamped
with PTFE clamps.[Yost et al, 2000]
21
Figure 2.8
Schematic diagram of the cell straining system, showing the
arrangement for data acquisition and control.[Cacou et al, 2000]
23
Figure 2.9
(a) Perspex mold, containing a 20 × 5 mm removable central
island, used to cast cell-seeded collagen gel constructs (b)
Schematic indicating the position of the cell seeded gel construct
within the culture chamber. [Cacou et al,2000 and Catherine et
al, 2003]
23
Figure 2.10
Apparatus utilized to subject scaffolds to cyclic strain. The
scaffolds were subjected to cyclic strain by periodic movement of
a crank back and forth as an eccentric disk that was driven by a
motor and connected to the crank rotated.[Kim et al, 2000]
25
x
Figure 2.11
Spool design bioreactor
25
Figure 2.12
An overview of the bioreactor (left), the cylindrical testing
compartment (middle) and the collagen gel scaffold (right).
[Altman et al, 2001]
26
Figure 2.13
(a)Schematic illustration of the bioreactor system, (b)
environmental chamber prior to closure to show the internal
silicone hose coils and gas inlet distribution manifold. [ Altman
et al, 2002]
30
Figure 2.14
Functioning bioreactor system includes: (a) peristaltic pump,(b)
environmental gas chamber and, (c) the two bioreactors
containing 24 vessels. [Altman et al, 2002]
30
Figure 3.1
Tubular form and Sheet form scaffold used in preliminary study
32
Figure 3.2
Cell seeded scaffolds; (a) unstrained samples, (b) bioreactor for
sheet form scaffold,(c) bioreactor for tubular form scaffold
33
Figure 3.3
Explanation of cell orientation angle
35
Figure 3.4
Transverse section of tubular form scaffolds from strained group
after two weeks of straining shows cell growth was mainly found
at the periphery;(a) 40X magnification ,scale bar = 500 µm, (b)
100X magnification, scale bar = 250 µm
35
Figure 3.5
Transverse section of sheet form scaffolds from strained group
after two weeks straining (Magnification 100X, scale bar = 200
µm)
36
Figure 3.6
Longitudinal section of tubular form scaffolds and sheet form
scaffolds after two weeks of cyclic straining; (a & c) Strained
samples, (b& d) Unstrained sample.
38
Figure 4.1
Proposed Bioreactor design.
44
Figure 4.2
(a) Spool assemble parts, (b) Scaffolds clamp system
45
Figure 4.3
Schematic Diagram of the bioreactor
45
Figure 4.4
Design of Bioreactor
46
Figure 4.5
Picture of Bioreactor
47
xi
Figure 4.6
Schematic Diagram of the bioreactor; Blue Colour showing the
original length of scaffold.
48
Figure 4.7
Photos of Petri Dish-Base Assembly
50
Figure 4.8
Petri dish-base Assembly; (a) before assembly (b) After assembly
50
Figure 4.9
The clamping system on the spool and petri dish
51
Figure 4.10
Clamping fixture for unstrained sample
52
Figure 4.11
Control system: (a) Control unit and switch box, (b) Inside the
control unit
52
Figure 4.12
Photos for load and displacement monitoring system.
54
Figure 5.1
HDFs; Human Dermal Fibroblasts at sub-confluence
(Magnification 100X, scale bar = 200 µm)
55
Figure 5.2
Knitting machine used to fabricate knitted scaffolds from PLGA
fibres; Inset: Bundle of PLGA yarn.
57
Figure 5.3
Scaffold in custom-made U-shaped stainless steel K wire frame;
Inset: Curly Scaffold without K wire frame
57
Figure 5.4
(a) Bioreactor setup with scaffolds in BSC (b) Clamping fixture
for unstrained samples
58
Figure 5.5
Experimental Setup (a) strained samples (b) Unstrained samples
(c) Data acquisition and Control system
59
Figure 5.6
Filling with fibrin glue onto the strained samples scaffolds
61
Figure 5.7
Scaffolds after cells seeding (a) Strained samples (b) Unstrained
samples
61
Figure 5.8
SEM, JEOL JSM-5800LV scanning electron microscope, Inset:
JFC-1200 Fine coater, JEOL
63
Figure 5.9
(a) Microtome to section paraffin block (b) Paraffin embedded
scaffolds
66
Figure 5.10
Colour selection was used to select the cell nuclei of interest ;(a)
Before colour selection, (b) after colour selection.
67
Figure 5.11
Gel Documentation system (Gel Doc 2000, Bio Rad)
72
xii
Figure 5.12
Detection and measuring the average density of PCR product
Bands; E=strained sample band, C=unstrained sample band, N=
negative control band (no RNA template)
73
Figure 5.13
Cryostat (Leica CM 3050 S)
77
Figure 5.14
Universal testing machine (UTM) (Instron® 3345 Tester)
Inset: Close up view of sample on clamp
79
Figure 5.15
Samples for Mechanical Test with Masking tape
80
Figure 6.1
Cell attachment on the PLGA scaffolds after two weeks straining
(Magnification 40 X).(a) Unstrained sample, rounded pore shape,
(b) Strained sample, elongated pore shape, red colour arrow
shows the direction of straining
81
Figure 6.2
SEM digital image done on Day 17.(left) Unstrained sample
(right) Straining sample showing slightly higher cell density
82
Figure 6.3
LSCM images in different magnification (100X & 200X): (a, c)
Unstrained sample, (b, d) Straining sample showing slightly
higher cell density
83
Figure 6.4
Comparison of % Reduction of Alamar Blue on both groups at
different times
84
Figure 6.5
Transverse Section Histology in different magnification;(left
column) unstrained sample, (right column) strained sample
85
Figure 6.6
Longitudinal sections Histology of scaffold at Day 17;(a,
c)unstrained sample,(b, d) strained samples
86
Figure 6.7
Graph showing cell nuclei length from different groups
89
Figure 6.8
% of cells in each orientation angles for all groups
89
Figure 6.9
Longitudinal sections Histology of scaffolds in different
frequency at Day 17; ( a, c) Strained sample with 1Hz, (b, d)
Strained samples with 0.1 Hz
90
Figure 6.10
Graph showing cell nuclei length from different strain frequency
groups
91
Figure 6.11
% of cells from different frequencies strained groups in each
orientation angle
91
xiii
Figure 6.12
Gel-electrophoresis images after separation of RT-PCR products
;(a) sample-1, (b) Sample-2. E: Strained scaffold, C: Unstrained
scaffold, N : negative control (no DNA template)
93
Figure 6.13
The resulting data of RT-PCR for Collagen type I, Type III and
Tenascin-C expressed as a ratio of Unstrained sample
94
Figure 6.14
Total soluble collagen production from strained and unstrained
scaffold between 1st to 3rd day and 15th to 17th day.
96
Figure 6.15
Amount Insoluble collagen
unstrained scaffold at day 17
97
Figure 6.16
Immunohistochemistry (Antibody Staining) (left column)
Unstrained sample, (right column) Strained sample.
(Magnification 200X, scale bar = 50 µm)
Figure 6.17
Load-Extension graph for PLGA scaffold at day 0: Thick line
segment show the segment of most linear region of the graph
101
Figure 6.18
Load-Extension graph for cell seeded PLGA scaffold at day
10(top) Unstrained samples( bottom) Strained samples: Thick
line segments show the segments of most linear region of the
graph
102
Figure G-1
Absorbance spectre of alamar blue at 600nm and 570nm
130
Figure H-1
Calculation of gradient between two successive points
134
Figure H-2
Graph of percentage gradient change versus extension. Region of
least change in gradient can be deduced to be between X=4.0mm
and X= 7.5 mm
134
Figure H-3
The blue colour line is the best fitted straight between X= 4mm
and X= 7.5mm. Gradient of this blue line yields the elastic
stiffness of the scaffold.
134
deposited from strained and
99
xiv
List of Tables
Table 2.1
Extracellular matrix composition of tendons and ligaments
(modified fromHarrison’s Principle of Internal Medicine
[Fauci et al,2001] )
6
Table 2.2
Structural properties of human tendons and ligaments (UTS:
Ultimate Tensile Strength; E: Young’s modulus) [Woo et al
,1998]
9
Table 3.1
Percent of cells in each orientation angle for all sample groups
39
Table 4.1
Physical properties of various suitable plastics; (· · mean steam
Autoclavable, X mean not autoclavable) [extracted from
www.nuncbrand.com]
43
Table 5.1
Primer sequences used in RT-PCR; 1: Forward primer; 2:
Reverse primer; bp: base pairs; AT: Annealing Temperature;
Cycle: number of PCR cycles; GAPDH: Glyceraldehyde
Phosphate Dehydogenase.
70
Table 5.2
Grouping of specimens for immunohistochemistry.
77
Table-6.1
The result data of RT-PCR products: S: strained sample , US:
unstrained sample
94
Table 6.2
Ultimate Tensile Force and Structural Stiffness for each groups
(mean ± SD)
101
Table G-1
Alamar Blue reading and % reduction calculation for Day 3
132
Table G – 2
Alamar Blue reading and % reduction calculation for Day 17
132
xv
Chapter 1. Introduction
Ligaments and tendons are connective tissues in the body, joining bone to bone and bone
to skeletal muscles, respectively and transmitting tensile forces between them. Injuries to
ligaments and tendons are among the most common injuries in the body. Surgical
reconstruction is often recommended because of poor intrinsic healing. The current
methods of surgical treatments are allografts, autografts and synthetic graft replacement.
Despite many improvements in these techniques, there remains significant limitation in
our management of these conditions and substitutes are far from ideal and each technique
has their specific problems and limitations. Some limitations for these methods are donor
site morbidity, rejection, infection, and fatigue failure.
Advances in tissue engineering now allow for new approaches to treat these ligament and
tendon injuries. Tissue engineering offers the possibility of replacing damaged human
tissue with functional neotissue (engineered tissue) with similar mechanical and functional
characteristics. Currently there are two approaches to tissue engineering: one is to implant
a cell–scaffold composite directly into the injured site, as such, the body acts like a
“bioreactor”; the other is to culture the cell–scaffold composite in a bioreactor in-vitro for
a period of time before transplantation. The in vitro bioreactor allows controlled
introduction of biochemical and physical regulatory signals to guide cell differentiation,
proliferation, and tissue development. As such, engineering of tissue ex vivo in a
bioreactor offers several exciting prospects, such as better understanding of tissue
development and the mechanisms of disease, off-the-shelf provision of essential
transplantable tissue, and possible scale-up for commercial production of engineered
tissues.
1
Mechanical stress plays a significant role in tissue formation and repair in vivo. Recently,
more focus has been given to the utilization of mechanical signals in vitro either in the
form of shear stress generated by fluid flow, hydrodynamic pressure or as direct
mechanical stress applied to the cell seeded scaffold.
Most of the previous studies are done on the investigation of the effect of mechanical
stress on cell seeded collagen matrices. Only a few researchers [Altman et al, 2002 and
Kwan, 2003] study the effect of cyclic mechanical strain on the cell seeded biodegradable
polymer scaffolds. Therefore in this research, knitted PLGA scaffold was chosen to study
the effect of cyclic mechanical strain on that cell seeded scaffolds.
1.1 Objectives of this Study
In this study, an attempt is made in designing a bioreactor for the study of the effect of
mechanical straining parameters on cellular morphology, to provide a better understanding
of condition for the in-vitro growth of engineering tissue by using knitted PLGA scaffold.
The objectives are:
(1) to design and fabricate a bioreactor for in-vitro engineering tissue and
(2) to investigate the effect of cyclic mechanical strain on fibroblast cell growth in-vitro
condition
1.2 Thesis Organization
The present chapter describes the background and objectives of this study. A brief
summary of relevant literature survey on ligament and tendon tissues and existing
bioreactor are discussed in chapter 2. The preliminary studies on the effect of cyclic
2
mechanical strain on different scaffold forms are described in chapter 3. Chapter 4
describes the design and fabrication of the new bioreactor. Next, description of
experimental work is given in chapter 5. In chapter 6, the results of the experiments and
discussion are presented. Finally the conclusions and recommendation for future study are
provided in chapter 7.
3
Chapter 2. Literature Survey
2.1 Ligament and Tendon
Ligaments and tendons are soft collagenous tissues. Ligaments connect bone to bone and
tendons connect skeletal muscles to bone. The function of ligament is to maintain the
stability of the joints in the musculoskeletal system and tendons serve to transmit tensile
loads between muscles (Figure 2.1). Contraction of a muscle results in transmission of the
load from muscle, via its tendon, to a bone across a joint, resulting in movement of the
bone around the joints. This subjects the ligaments between the bones to strain. Thus,
tendons operate to bring around movements of the joints, and ligaments prevent excessive
movement of the joints and thereby provide stability.
(a)
(b)
Figure 2.1: (a) Tendons of the foot (b) Ligaments of the knee joints.
4
Ligaments and tendons are collagenous tissues with their primary building unit being the
tropocollagen molecule [Viidik, 1973]. Tropocollagen molecules are organized into long
cross-striated fibrils that are arranged into bundles to form fibers. Fibers are further
grouped into bundles called fascicles which group then together to form the ligament
(Figure 2.2). Collagen fiber bundles are arranged in the direction of functional need and
act in conjunction with elastic and reticular fibers along with ground substance, which is a
composition of glycosaminoglycans (GAG) and tissue fluid, to give ligaments their
mechanical characteristics. In unstressed ligaments, collagen fibers take on a sinusoidal
pattern. This pattern is referred to as a "crimp" pattern and is believed to be created by the
cross-linking or binding of collagen fibers with elastic and reticular fibers.
Figure 2.2: Schematic diagram of the structural hierarchy of ligament.
5
2.2 Biochemical Constituents
The major constituents of ligaments and tendon are collagen, elastin, glycoproteins,
protein polysaccharides, glycolipids, water and cells [Akeson et al, 1984]. Water makes up
about 55% of wet weight of tendons and 60-80 % of wet weight of ligaments. Collagen is
arranged in the form of fibers within a matrix of GAGs, thus imparting “fiber reinforced
composite” like properties to the tissues [Ker et al, 1999]. The approximate compositions
are given in Table 2.1.
Table 2.1: Extra cellular matrix composition of tendons and ligaments (modified from
Harrison’s Principle of Internal Medicine [Fauci et al, 2001])
Major constituents
Approximate amount,
% dry weight
Characteristics or
functions
Type I collagen
80
Bundles of fibrils
Type III collagen
5-15
Type IV collagen, laminin,
nidogen
<5
Types V, VI, and VII
collagens
Elastin, fibrillin
Fibronectin
Proteoglycans, hyaluronate
<5
<5
<5
0.5
Thin fibrils
In basal laminae under
epithelium and endothelium
VII forms anchoring
fibrils; others unknown
Provides elasticity
Associated with collagen
fibers and cell surfaces
Provide resiliency
6
2.3 Biomechanics
The main function of ligaments and tendons is to transmit tensile loads across joints,
largely in a uniaxial direction. Consistent with this function, their structure of aligned
collagen fibers provides for load bearing primarily in one direction and contributes to
highly anisotropic material properties. Their properties are usually described in the axial
direction, and can be classified into two sub categories (1) structural properties and
(2) viscoelastic properties.
2.3.1 Structural Properties
Structural properties of tendons/ligaments are extrinsic measures of the tensile
performance of the overall structure. As a result, they depend on the size and shape of the
tendons/ligaments, in addition to the variations of the unique properties from tissue to the
insertion into bone. These properties are obtained by loading a tendon/ligament to the
failure limit and are represented in the resulting load-elongation curve and stress- strain
curve as shown in Figure 2.3.
(a)
(b)
Figure 2.3: A typical (a) load-elongation curve and (b) stress- strain curve for
tendon/ligament. [Woo et al, 1998]
7
From the load-elongation curve (Figure 2.3(a)) the ultimate load P0 (N) is the highest
load placed on the complex before failure; the ultimate elongation (mm) is the maximum
elongation of the complex at failure; the stiffness (N/mm) is the slope of the loadelongation curve between two defined limits of elongation; and energy absorbed at
failure (N-mm) is the area under the entire curve which represents the maximum energy
stored by the complex. At forces above 50% of ultimate load, tissue stiffness was nearly
constant, and a pronounced “toe region” was observed only at forces below ~25% of
ultimate load. Stiffness increased as the muscle–tendon unit was lengthened.
The cross-sectional areas of tissues are measured with laser micrometry method, which
was employed for accurate measurement of the tissues without deforming the cross
section of tissues [Lee et al, 1988]. Figure 2.3(b) represents a typical stress-strain curve for
tendons/ligaments. The ultimate tensile strength (UTS; N/mm2) is the maximum stress
achieved; the ultimate strain is the strain at failure; the Young’s modulus (E; N/mm2 or
MPa) is the tangent modulus in the linear region of the stress–strain curve; the strain
energy density (MPa) is the area under the stress-strain curve. The peak stress to which a
tendon is subjected varies according to its anatomical site and the species. Values obtained
vary with the testing protocol and conditions, and are enumerated in Table 2.2 for some
tendons and ligaments.
Among adult mammalian limb tendons, the stress-in-life ranges from 10 to 70 MPa, with
the most common stress value being approximately 13 MPa. Higher values of stress-in-life
are found in few tendons such as the human Achilles tendon (67 MPa) [Ker et al, 2000].
The data for ultimate tensile strength in a ramp test to rupture are mostly in the range 50–
8