Dielectric behaviours of pb1 3x 2laxtio3 (PLT a) based ferroelectrics derived from mechanical activation
Bạn đang xem bản rút gọn của tài liệu. Xem và tải ngay bản đầy đủ của tài liệu tại đây (11.14 MB, 194 trang )
DIELECTRIC BEHAVIOURS OF
Pb1-3x/2LaxTiO3 (PLT-A)-BASED
FERROELECTRICS DERIVED FROM
MECHANICAL ACTIVATION
SOON HWEE PING
(B. Appl. Sci. (Hons.), NUS)
A THESIS SUBMITTED
FOR THE DEGREE OF MASTERS OF SCIENCE
DEPARTMENT OF MATERIALS SCIENCE
NATIONAL UNIVERSITY OF SINGAPORE
2004
ACKNOWLEDGEMENTS
I would like express my heartfelt appreciation to my academic advisor, Associate
Professor John Wang, for his constant guidance and full support throughout the entire
course of this project. I would also like to thank Dr. Xue Junmin for his invaluable
advices and suggestions towards the completion of this research work. Moreover,
their great efforts on building up the team spirit of the research group are always
appreciated.
A special word of appreciation also goes to all my colleagues in the Advanced
Ceramics Lab for making the laboratory a memorable and fun place to work in. By
sharing experiences and having regular discussions, particularly in the weekly held
group seminars, great improvements have been made for my research work,
presentation skills and self-management. I would also like to acknowledge all the
laboratory technologists and staff of the Materials Science Department for their kind
assistance.
A special thanks also goes to my close friends for their moral support and regular
encouragement. Last but not least, I would like to acknowledge my indebtedness to
my beloved parents for their understanding, patience and support for all the time.
I
Table of content
TABLE OF CONTENT
ACKNOWLEDGEMENTS ..................................................................... I
TABLE OF CONTENT .......................................................................... II
SUMMARY .............................................................................................. V
LIST OF TABLES ................................................................................ VII
LIST OF FIGURES ............................................................................ VIII
PUBLICATIONS .................................................................................. XV
CONFERENCE PARTICIPATIONS ................................................ XV
CHAPTER 1 A REVIEW ON STRUCTURE AND
FERROELECTRICITY OF ABO3 PEROVSKITES ........................... 1
1.1 Structure of ABO3 Perovskites ............................................................................1
1.2 Typical Dielectric Behaviours of ABO3 Perovskites...........................................2
1.2.1 Normal Ferroelectricity.............................................................................3
1.2.2 Relaxor Ferroelectrics...............................................................................8
1.2.3 Quantum Paraelectricity .........................................................................13
1.2.4 Crossover from Quantum Paraelectricity to Quantum Ferroelectricity
and to Relaxor...................................................................................................16
1.3 Doping PbTiO3 with La3+ and Valence Two Cations........................................20
1.4 Space Charge Polarization .................................................................................23
II
Table of content
CHAPTER 2 MOTIVATIONS AND OBJECTIVES OF RESEARCH
PROJECT ................................................................................................ 28
CHAPTER 3 EXPERIMENTAL PROCEDURES ............................. 31
3.1 Mechanical Activation, Sintering and Post-sinter Annealing............................33
3.2 X-ray Diffraction (XRD) ...................................................................................35
3.2.1 Working Principles of XRD .....................................................................35
3.2.2 Triaxial Strain Measurements .................................................................38
3.3 Scanning Electron Microscopy (SEM) ..............................................................42
3.4 Transmission Electron Microscopy (TEM) .......................................................43
3.5 Dielectric Properties...........................................................................................45
3.6 Secondary Ion Mass Spectrometry (SIMS) .......................................................47
CHAPTER 4 SYNTHESIS OF PLT-A................................................. 49
4.1 Mechanical Activation .......................................................................................49
4.1.1 Phase Formation .....................................................................................49
4.1.2 Particle Size and Morphology .................................................................52
4.2 Sintering Behaviours..........................................................................................54
4.2.1 Sintering Temperature .............................................................................54
4.3 Phases and Microstructures of Pb1-3x/2LaxTiO3 (PLT-A) ...................................57
4.4 Dielectric Properties of Pb1-3x/2LaxTiO3 (PLT-A) ..............................................61
4.5 Remarks .............................................................................................................65
CHAPTER 5 POST-SINTER ANNEALING OF PLT-A20 ............... 67
5.1 Phases and Microstructures of PLT-A20 upon Post-sinter Annealing ..............67
5.2 Dielectric Properties of Post-sinter Annealed PLT-A20 ...................................71
III
Table of content
5.3 Remarks .............................................................................................................85
CHAPTER 6 PLT-A20 WITH Ca2+, Sr2+ AND Ba2+
SUBSTITUTIONS .................................................................................. 87
6.1 Nomenclature.....................................................................................................88
6.2 PLT-A Composition for Study...........................................................................89
6.3 PLT-A20 Substituted with Ca2+, Sr2+, and Ba2+ ................................................96
6.3.1 Phase Formation .....................................................................................96
6.3.2 Sintering Behaviours and Microstructures of PBLT, PSLT and PCLT.100
6.4 Dielectric Behaviours of PBLT, PSLT and PCLT...........................................110
6.5 Correlations between Structure and Strain Analysis .......................................122
6.6 Remarks ...........................................................................................................144
CHAPTER 7 DIELECTRIC TRANSITIONS OF PLT-A20
SUBSTITUTED WITH CALCIUM (PCLT) ..................................... 146
7.1 Quantum Paraelectric-like Behaviour to Normal Ferroelectricity...................146
7.2 Fittings to Existing Ferroelectric Models ........................................................149
7.3 Hysteresis Loops for PCLT8020 and PCLT9020............................................161
7.4 Remarks ...........................................................................................................164
CHAPTER 8 CONCLUSIONS ........................................................... 166
CHAPTER 9 SUGGESTIONS FOR FUTURE WORK ................... 170
CHAPTER 10 REFERENCES ............................................................ 172
IV
Summary
SUMMARY
Dielectric properties of Pb1-3x/2LaxTiO3 (PLT-A)-based perovskites were investigated
systematically by post-sinter annealing in oxygen or nitrogen atmosphere and triaxial
strain analyses using XRD. Four series of PLT-A-based perovskites were thus
synthesized using mechanical activation at room temperature, including Pb13x/2LaxTiO3
with x ranging from 0.10 to 0.25, and Pb0.70La0.20TiO3 (PLT-A20) with
Ba2+, Sr2+ or Ca2+ substitution ranging from 10 to 50%.
Investigations on sintered behaviours, the resulting grain sizes and dielectric
properties of PLT-A suggested that Pb0.70La0.20TiO3 (PLT-A20) exhibited the
strongest dependencies of both relative permittivity and dielectric loss on space
charge polarization. Upon annealing in oxygen or nitrogen, both relative permittivity
and dielectric loss for PLT-A20 at Tc measured at 1000 Hz showed an initial rise and
a peak at approximate 4.0 hours of annealing time in stage I, which is attributed to the
domination of space charge polarization as a result of the PbO evaporation from
surface region. On the other hand, prolonged annealing in oxygen and nitrogen
respectively resulted in structural destabilization and the antiphase polarization,
leading to a steady fall and a continuing increase for both relative permittivity and
dielectric loss in stage II, respectively.
XRD strain analyses suggested that the lattice mismatch between Pb2+ and Ba2+, Sr2+
or Ca2+ in A-site of the perovskite lattices results in local structural distortions of host
atoms, leading to a breakdown in the dipolar long-range order of PLT-A20. Tensile
strain brought about by Ba2+ substitution enhances Pb-O hybridization locally by
V
Summary
stretching neighbouring oxygen octahedra to Pb2+, as evidenced by the less
effectiveness in shifting Tc or Tmax to lower temperature than that of Sr2+ and Ca2+.
Undoubtedly, increasing Ba2+ substitution adversely affects the cooperative coupling
of Pb-O-Ti. Together with the expansion of ratting space for Ti4+, a relaxor behaviour
with the most significant diffusiveness was thus observed for PBLT5020.
In contrast, Ca2+ substitution results in compressive strains that shrink the perovskite
lattice, leading to an increase in repulsive energy between A-site cations and Ti4+, thus
a compensation by structural tilts is then required. Further increasing the substitution
to 50%, Ti4+ is frozen by the large compressive strains, resulting in the quantum
paraelectric-like behaviour up to the record temperature of ~200 K. As confirmed by
the failures in fittings to both the Barrett’s and quantum ferroelectric relations, the
quantum paraelectric-like behaviour is not resulted by the quantum mechanical
fluctuations. The temperature dependences of relative permittivity for PLT-A20
substituted with 55 to 65% Ca2+ can be well-fitted to the Vogel-Fulcher relation,
suggesting that the observed relaxor behaviours are manifested by the interacting
dipolar clusters brought about by Pb2+ dilution, whereby the cooperative couplings
among unit cells are deteriorated. This is further supported by the increases in both Pr
and Ec with increasing Pb2+ content. On the other hand, Sr2+ that possesses a smaller
ionic size than Pb2+ brought the same effects as that of Ca2+. However, the
compressive strain and structural tilts thus generated are less significant. As a result,
only an enhancement of DPT with increasing level of Sr2+ was observed.
VI
List of tables
LIST OF TABLES
Table 6-1 Summary of diffusiveness and γ-exponent for PCLT, PSLT and
PBLT............................................................................................................................... 122
Table 6-2 Summary of the six strain components calculated for PLT-A20,
PBLT5020, PCLT5020 and PSLT5020.......................................................................... 142
Table 7-1 Summary of ∆Tmax and ∆Trelax calculated for PCLT at various levels
of Pb2+. ............................................................................................................................ 155
Table 7-2 Summary of remanent polarization (Pr) and coercivity (Ec) for both
PCLT8020 and PCLT9020 induced by varying applied electric field strengths
(E). .................................................................................................................................. 161
VII
List of figures
LIST OF FIGURES
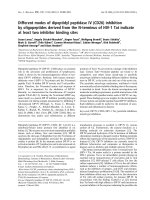
Figure 1.1 Structure of ABO3 perovskites. ......................................................................... 1
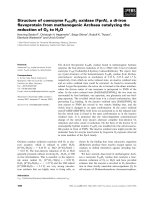
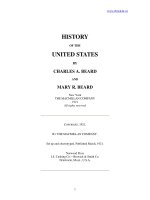
Figure 1.2 Temperature dependence of relative permittivity (a), P-E hysteresis
loop (b), and temperature dependence of polarization (c) of a typical normal
ferroelectric (adapted from [9]). ......................................................................................... 4
Figure 1.3 Local electric fields induced by other dipoles considered in Lorentz
correction (a), and the temperature dependence of angular frequency of softmodes (b), for a normal ferroelectric. ................................................................................. 7
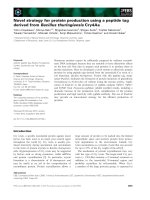
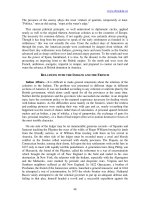
Figure 1.4 Temperature dependence of relative permittivity (a), slim P-E
hysteresis loop (b), and temperature dependence of polarization (c) for a
typical relaxor (adapted from [9])....................................................................................... 9
Figure 1.5 Plot of relative permittivity vs. temperature for SrTiO3, showing the
quantum paraelectric state where the temperature independence of relative
permittivity was observed below 4 K (adapted from [25])............................................... 15
Figure 1.6 Temperature dependence of relative permittivity of Sr1-xCaxTiO3
with x ranging from 0 to 0.12 (adapted from [31]). .......................................................... 18
Figure 1.7 Temperature of maximum relative permittivity Tmax (a), γ-exponent
(b), and ∆Tmax (c) as a function of x for Sr1-xCaxTiO3. Solid line in (a) shows
the best fit to quantum ferroelectric relation (adapted from [31]). ................................... 19
Figure 1.8 Phase diagram (1330 oC isotherm) for the ternary PbO-La2O3-TiO2
system. The shaded area defines the single-phase region (adapted from [34]). ............... 22
Figure 1.9 Schematic diagrams of different polarization mechanisms:
electronic polarization (a), ionic polarization (b), dipolar polarization (c), and
space charge polarization (d) (adapted from [39])............................................................ 25
Figure 1.10 Schematic diagram of polarization by dipole chains and bound
charges (adapted from [39]).............................................................................................. 27
Figure 1.11 Schematic diagram of frequency dependence of polarizability of
several polarization mechanisms (adapted from [39])...................................................... 27
VIII
List of figures
Figure 3.1 Experimental procedures in optimizing the processing parameters
for mechanical activation and sintering (Part I)................................................................ 31
Figure 3.2 Experimental procedures for post-sinter annealing of
Pb0.70La0.20TiO3 (PLT-A20) (Part II) in Chapter 5 and studies of PLT-A20
substituted with 10 to 50% Ca2+, Sr2+ and Ba2+ (Part III) in Chapter 6 and
Chapter 7, respectively...................................................................................................... 32
Figure 3.3 Schematic diagram illustrating the geometry of an X-ray
diffractometer. Two diffraction cones are shown, where Ghkl, So and Shkl
represent the sample normal, incident beam, and the diffracted beam,
respectively. (adapted from [49]) ...................................................................................... 35
Figure 3.4 Schematic diagrams of (a) the d-spacings of an unstrained (do) and a
strained specimens (dn) at varying tilt angles ψ of an (hkl), and (b) the two
coordinate systems involved in the triaxial strain measurements (adapted from
[53])................................................................................................................................... 39
Figure 3.5 Schematic diagrams illustrating the geometries of sample tilt mode
(a) and beam tilt mode (b)................................................................................................. 39
Figure 3.6 Schematic diagram showing the basic components of a typical
scanning electron microscope (adapted from [57]). ......................................................... 42
Figure 3.7 Comparison of the electron ray paths in transmission electron
microscope for imaging (a) and selected area electron diffraction (b) (adapted
from [58]).......................................................................................................................... 45
Figure 3.8 Schematic diagram illustrating the basic components of a secondary
ion mass spectrometer (adapted from [59]). ..................................................................... 47
Figure 4.1 XRD patterns of the powder mixture of PbO, TiO2, and La2O3
equivalent to Pb0.775La0.15TiO3 in composition mechanically activated for
various time periods ranging from 0 to 20.0 hours. .......................................................... 51
Figure 4.2 TEM micrographs of PLT-A with different levels of La doping: (a)
Pb0.85La0.10TiO3 (PLT-A10), (b) Pb0.775La0.15TiO3 (PLT-A15), (c)
Pb0.70La0.20TiO3 (PLT-A20), and Pb0.625La0.25TiO3 (PLT-A25). ...................................... 53
Figure 4.3 The relative density of Pb0.775La0.15TiO3 (PLT-A15) derived from
mechanical activation for 20.0 hours as a function of sintering temperatures
ranging from 1050 oC to 1250 oC. .................................................................................... 55
IX
List of figures
Figure 4.4 SEM micrographs of PLT-A15 synthesized by mechanical
activation for 20.0 hours and sintered at different temperatures: (a) 1050 oC,
(b) 1100 oC, (c) 1150 oC, and (d) 1200 oC. ....................................................................... 56
Figure 4.5 XRD traces of PLT-A10 (a), PLT-A15 (b), PLT-A20 (c), and PLTA25 (d), derived from the powders mechanically activated for 20.0 hours and
then sintered at 1200 oC for 2.0 hours............................................................................... 58
Figure 4.6 The relative density of Pb1-3x/2LaxTiO3 (PLT-A) derived from 20.0
hours of mechanical activation and then sintered at 1200 oC as a function of
La-doping level with x ranging from 0.10 to 0.25. ........................................................... 59
Figure 4.7 SEM micrographs showing the surfaces of (a) PLT-A10, (b) PLTA15, (c) PLT-A20, and (d) PLT-A25 sintered at 1200 oC................................................ 60
Figure 4.8 Average grain size of Pb1-3x/2LaxTiO3 (PLT-A) as a function of La
doping level with x ranging from 0.10 to 0.25.................................................................. 61
Figure 4.9 Relative permittivity and dielectric loss as a function of temperature
measured at 1000 Hz, 1500 Hz, 5000 Hz, and 10000 Hz for PLT-A10 (a),
PLT-A15 (b), PLT-A20 (c), and PLT-A25 (d), respectively............................................ 62
Figure 4.10 Curie temperature Tc of Pb1-3x/2LaxTiO3 (PLT-A) as a function of
La doping level with x ranging from 0.10 to 0.25. ........................................................... 64
Figure 4.11 Relative permittivity and dielectric loss for Pb1-3x/2LaxTiO3 at Curie
temperature Tc, measured at the frequency of 1000 Hz, as a fucntion of La
doping level with x ranging from 0.10 to 0.25.................................................................. 65
Figure 5.1 XRD traces of PLT-A20 before (a) and after post-sinter annealing in
oxygen for (b) 3.0, (c) 4.0, (d) 8.0, (e) 12.0, and (f) 24.0 hours. ...................................... 68
Figure 5.2 XRD traces of PLT-A20 before (a) and after nitrogen annealing for
(b) 4.0, (c) 8.0, (d) 12.0, (e) 24.0, and (f) 30.0 hours........................................................ 69
Figure 5.3 SEM micrographs showing the polished and etched surfaces of
PLT-A20: (a) before annealing, (b) annealed in oxygen for 12.0 hours at 800
o
C, and (c) annealed in nitrogen for 12.0 hours at 800 oC, respectively. .......................... 70
Figure 5.4 Relative permittivity (a) and dielectric loss (b) at 1000 Hz as a
function of temperature for PLT-A20 annealed in an oxygen atmosphere at 800
o
C for 3.0, 4.0, 8.0, 12.0, and 24.0 hours together with that of before annealing. ............ 73
X
List of figures
Figure 5.5 Relative permittivity (a) and dielectric loss (b) at Curie temperature
Tc of PLT-A20 annealed in an oxygen atmosphere as a function of annealing
time ranging from 0 to 24.0 hours at 1000, 1500, and 10000 Hz. .................................... 74
Figure 5.6 The SIMS intensity counts of Pb, O, Ti, and La over the sputtered
depth of up to 10.84 µm, for PLT-A20 annealed in an oxygen atmosphere at
800 oC for 4.0 hours. ......................................................................................................... 78
Figure 5.7 Temperature dependence of (a) relative permittivity and (b)
dielectric loss measured at a frequency of 1000 Hz for PLT-A20 annealed in an
oxygen atmosphere after the surface was polished off and at 400 oC. ............................. 79
Figure 5.8 Relative permittivity (a) and dielectric loss (b) at 1000 Hz, as a
function of temperature for PLT-A20 annealed in a nitrogen atmosphere at 800
o
C for 4.0, 8.0, 12.0, 24.0, and 30.0 hours, together with those of as-sintered
PLT-A20 and PLT-A20 re-annealed in an oxygen atmosphere at 800 oC for
12.0 hours.......................................................................................................................... 80
Figure 5.9 Relative permittivity (a) and dielectric loss (b) at Tc for PLT-A20
annealed in a nitrogen atmosphere as a function of annealing time ranging
from 0 to 30.0 hours measured at 1000, 1500, 5000, and 10000 Hz,
respectively. ...................................................................................................................... 82
Figure 6.1 XRD traces of PLT-A10 substituted with (a) 10% (PBLT9010), (b)
20% (PBLT8010), (c) 30% (PBLT7010), (d) 40% (PBLT6010), and (e) 50%
Ba2+ (PBLT5010), respectively. ....................................................................................... 91
Figure 6.2 Lattice parameters a and c (a), aspect ratio (c/a) (b), and unit cell
volume (c) for PLT-A10 with Ba2+ substitution varying from 10 to 50%........................ 92
Figure 6.3 Temperature dependence of relative permittivity of PLT-A10 with
(a) 10% (PBLT9010), (b) 20% (PBLT8010), (c) 30% (PBLT7010), (d) 40%
(PBLT6010), and (e) 50% (PBLT5010) of Ba2+ substitutions, when measured
at frequencies ranging from 1000 Hz to 100000 Hz. ........................................................ 93
Figure 6.4 Temperature dependence of relative permittivity of PLT-A10 with
10 to 50% Ba2+ substitution measured 100000 Hz. .......................................................... 94
Figure 6.5 Change in Curie temperature (Tc) for PLT-A10 as a function of Ba2+
substitution. ....................................................................................................................... 95
Figure 6.6 XRD diffraction patterns of PLT-A20 substituted with Ba2+ ranging
from 10 to 50% and sintered at 1200 oC for 2.0 hours: (a) Pb0.63Ba0.07La0.2TiO3
XI
List of figures
(PBLT9020), (b) Pb0.56Ba0.14La0.2TiO3 (PBLT8020), (c) Pb0.49Ba0.21La0.2TiO3
(PBLT7020),
(d)
Pb0.42Ba0.28La0.2TiO3
(PBLT6020),
and
(e)
Pb0.35Ba0.35La0.2TiO3 (PBLT5020), respectively. ............................................................. 97
Figure 6.7 XRD traces of PLT-A20 with 10 to 50% Sr2+ substitutions, sintered
at 1200 oC for 2.0 hours: (a) Pb0.63Sr0.07La0.2TiO3 (PSLT9020), (b)
Pb0.56Sr0.14La0.2TiO3 (PSLT8020), (c) Pb0.49Sr0.21La0.2TiO3 (PSLT7020), (d)
Pb0.42Sr0.28La0.2TiO3 (PSLT6020), and (e) Pb0.35Sr0.35La0.2TiO3 (PSLT5020). ................ 98
Figure 6.8 XRD traces of (a) Pb0.63Ca0.07La0.2TiO3 (PCLT9020), (b)
Pb0.56Ca0.14La0.2TiO3 (PCLT8020), (c) Pb0.49Ca0.21La0.2TiO3 (PCLT7020), (d)
Pb0.42Ca0.28La0.2TiO3 (PCLT6020), and (e) Pb0.35Ca0.35La0.2TiO3 (PCLT5020),
respectively, sintered at 1200 oC for 2.0 hours. ................................................................ 99
Figure 6.9 Relative densities for PLT-A20 substituted with 10 to 50% of Ba2+
(a), Sr2+ (b), and Ca2+ (c), respectively. .......................................................................... 102
Figure 6.10 SEM micrographs of the polished and etched surfaces of
PBLT9020 (a), PBLT8020 (b), PBLT7020 (c), PBLT6020 (d), and PBLT5020
(e), synthesized via mechanical activation for 20.0 hours and then sintered at
1200 oC for 2.0 hours. ..................................................................................................... 104
Figure 6.11 SEM micrographs showing the polished and etched surfaces of
PLT-A20 substituted with 10 to 50% Sr2+: (a) PSLT9020, (b) PSLT8020, (c)
PSLT7020, (d) PSLT6020, and (e) PSLT5020............................................................... 106
Figure 6.12 SEM micrographs showing the polished and etched surfaces of (a)
PCLT9020, (b) PCLT8020, (c) PCLT7020, (d) PCLT6020, and (e) PCLT5020,
synthesized via mechanical activation for 20.0 hours and then sintered at 1200
o
C for 2.0 hours. .............................................................................................................. 108
Figure 6.13 Average grain size as a function of Ba2+ (a), Sr2+ (b) and Ca2+ (c)
substitution, respectively, ranging from 10 to 50% for PBLT, PSLT and PCLT,
respectively. .................................................................................................................... 109
Figure 6.14 Relative permittivity for PLT-A20 substituted with Ba2+ (a), Sr2+
(b), and Ca2+ (c) ranging from 10 to 50%, measured at 100000 Hz. .............................. 111
Figure 6.15 Temperature dependence of relative permittivity and dielectric loss
of (a) PBLT9020, (b) PBLT8020, (c) PBLT7020, (d) PBLT6020 and (e)
PBLT5020, respectively, measured at frequencies ranging from 1000 Hz to
100000 Hz. Insets in (d) and (e) demonstrate the frequency dependence of
relative permittivity maxima........................................................................................... 114
XII
List of figures
Figure 6.16 Temperature dependence of relative permittivity and dielectric loss
of PLT-A20 substituted with (a) 10% (PSLT9020), (b) 20% (PSLT8020), (c)
30% (PSLT7020), (d) 40% (PSLT6020), and (e) 50% of Sr2+ (PSLT5020),
respectively, measured at frequencies ranging from 1000 Hz and 100000 Hz. ............. 117
Figure 6.17 Relative permittivity and dielectric loss as a function of
temperature measured at frequencies ranging from 1000 Hz to 100000 Hz for
(a) PCLT9020, (b) PCLT8020, (c) PCLT7020, (d) PCLT6020, and (e)
PCLT5020, respectively. ................................................................................................ 121
Figure 6.18 Lattice parameters (a), aspect ratio (c/a) (b), and unit cell volume
(c) of PLT-A20 as a function of Ba2+ substitution ranging from 10 to 50%. ................ 124
Figure 6.19 The variations of (a) lattice parameters, (b) aspect ratio (c/a), and
(c) unit cell volume as a function of Sr2+ substitution ranging from 10 to 50%. ............ 125
Figure 6.20 Variations of lattice parameters (a), aspect ratio (c/a) (b), and unit
cell volume (c) brought about by an increasing level of Ca2+ substitution from
10 to 50%. ....................................................................................................................... 127
Figure 6.21 X-ray diffraction peak of (222) for PLT-A20 substituted with (a)
Ba2+, (b) Sr2+, and (c) Ca2+ ranging from 0 to 50%, respectively. .................................. 129
Figure 6.22 Average microstrain brought about by Ba2+, Sr2+, and Ca2+
substitutions into PLT-A20, ranging from 10 to 50%. ................................................... 130
Figure 6.23 Residual strain ε'33 induced in (222) vs. tilt angle ψ of crystallites
with respect to sample normal for (a) PLT-A20, (b) PSLT5020, (c) PCLT5020
and (d) PBLT5020 measured at φ = 0o, 45o and 90o, respectively................................. 134
Figure 6.24 Plots of d-spacing vs. sin2ψ for (a) PLT-A20, (b) PSLT5020, (c)
PCLT5020, and (d) PBLT5020, respectively. ................................................................ 139
Figure 6.25 Linear plots of (a) a1 vs. sin2ψ and (b) a2 vs. sin|2ψ| for
PCLT5020 measured at = 0o, 45o and 90o, respectively. ................................................ 141
Figure 7.1 (a) Temperature corresponding to maximum relative permittivity
(Tmax) measured at 100000 Hz and (b) γ-exponent as a function of Pb2+ content
for PCLT ranging from 0.350 to 0.665 mol%. Solid line in (a) is the best fit to
the quantum ferroelectric equation Tmax = 729.74 (x- 0.364 ± 0.061)1/2. ........................ 148
XIII
List of figures
Figure 7.2 Temperature dependence of relative permittivity of PCLT with
various Pb2+ content ranging from 0.350 to 0.665 mol%, measured at 100000
Hz. ................................................................................................................................... 150
Figure 7.3 Temperature dependence of relative permittivity of (a) PCLT5020
and (b) PCLT5220 with 0.35 and 0.364 mol% of Pb2+ respectively, measured
at the frequency of 100000 Hz [dots: experimental data; solid curves: fitting
curves to the Barrett’s equation]. .................................................................................... 151
Figure 7.4 Relative permittivity as a function of temperature measured at
frequencies ranging from 100 Hz to 100000 Hz for (a) PCLT5520, (b)
PCLT6020, (c) PCLT6220, and (d) PCLT6520 containing 0.385, 0.420, 0.434
and 0.455 mol% Pb2+, respectively. ................................................................................ 154
Figure 7.5 The relationship between the angular frequency (ω) and the
reciprocal of Tmax for (a) PCLT6520, (b) PCLT6220, (c) PCLT6020, and (d)
PCLT5520, respectively [dots: experimental data; solid lines: fitting curves to
the Arrhenius equation]................................................................................................... 157
Figure 7.6 The plots of angular frequency (ω) vs. Tmax for (a) PCLT6520, (b)
PCLT6220, (c) PCLT6020, and (d) PCLT5520 [dots: experimental data; solid
lines: fitting curves to the Vogel-Fulcher equation]. ...................................................... 159
Figure 7.7 Plots of (a) activation energy (Ea) and (b) freezing temperature (Tf)
as a function of Pb2+ content ranging from 55% to 65% for PCLT. ............................... 160
Figure 7.8 Hysteresis loops for (a) PCLT8020 and (b) PCLT9020, measured at
room temperature. ........................................................................................................... 163
XIV
Publications and Conference Participations
PUBLICATIONS
1.
H. P. Soon, J. M. Xue, and J. Wang, “Dielectric Behaviours of Pb1-3x/2LaxTiO3
Derived from Mechanical Activation”, J. Appl. Phys. 95, 4981 (2004).
2.
H. P. Soon, J. M. Xue, and J. Wang, “Effects of the Post-sinter Annealing on the
Dielectric Properties of Pb1-3x/2LaxTiO3 (PLT-A20) Derived from Mechanical
Activation”, accepted for publication in Integr. Ferroelectr.
CONFERENCE PARTICIPATIONS
1.
Participant of EMF 2003, The European Meeting on Ferroelectrics (2003),
Cambridge, United Kingdom.
2.
Participant of UFFC 2004, The IEEE International Ultrasonics, Ferroelectrics and
Frequency Control 50th Anniversary Joint Conference (2004), Montreal, Canada.
XV
Chapter 1
CHAPTER 1 A REVIEW ON STRUCTURE AND
FERROELECTRICITY OF ABO3 PEROVSKITES
1.1 Structure of ABO3 Perovskites
Many ternary compounds of the general formula ABO3, where A represents a valence
two cation occupies the cuboctahedral site and B denotes a valence four cation
occupies the octahedral site, as shown in Figure 1.1, are excellent candidates for
various technological applications, such as multilayer capacitors, sensors, actuators,
piezoelectric sonar, ultrasonic transducers, and ferroelectric thin-film memories
[1,2,3]. Besides, an enormous range of perovskite compositions and solid-solutions
have been developed by A-site or B-site doping or both, in order to tailor their
ferroelectric or piezoelectric properties for different applications. The best known
examples include Pb1-3x/2LaxTiO3 (PLT), Pb(Mg1/2Nb2/3)O3 (PMN), and La-substituted
PbTiO3-PbZrO3 (PLZT) that exhibit excellent ferroelectric and dielectric behaviours.
Cuboctahedral
Octahedra
A
O2-
B
Figure 1.1 Structure of ABO3 perovskites.
1
Chapter 1
It is widely accepted that A-site distortions can lead to a stronger contribution to the
change in local perovskite lattices than that of B-site. This can be elucidated by
considering the differences in the local environments of A-site and B-site cations in an
ideal perovskite structure. The oxygen nearest neighbour shell for an A-site cation has
12-fold symmetry, in contrast to the broken one for B-site [4,5].
1.2 Typical Dielectric Behaviours of ABO3 Perovskites
Since the discovery of ferroelectricity in single-crystal Rochelle salt in 1921 [6] and
its subsequent extension into the realm of polycrystalline BaTiO3 in 1940s [7,8],
extensive research works have been done for understanding the natures of phase
transitions and dielectric behaviours of ABO3 perovskite structures. Indeed, several
types of dielectric behaviours have been discovered, such as the typical normal
ferroelectricity, relaxor ferroelectricity and quantum paraelectricity. However, the
origins of some of these behaviours are still debatable. Nevertheless, many
investigators consider the importance and the correlations of soft-modes and dipolar
long-range order of perovskite lattices on phase transitions and dielectric behaviours.
A brief review on the characteristics and recent developments in the theories
concerning the normal ferroelectricity, relaxor ferroelectricity and quantum
paraelectricity is given in the following sections.
2
Chapter 1
1.2.1 Normal Ferroelectricity
It is well known that both BaTiO3 and PbTiO3 are the typical normal ferroelectric,
which exhibits a well-defined phase transition temperature (Curie temperature Tc), as
shown in Figure 1.2 (a) [9]. At temperatures higher than Tc, the dependence of relative
permittivity on temperature obeys the Curie-Weiss law, as shown by Equation (1-1).
ε=
C
T − Tc
(1-1)
where ε is the relative permittivity;
C is the Curie-Weiss Constant;
T is temperature;
Tc is the Curie temperature.
As demonstrated in Figure 1.2 (b), the occurrences of large remanent polarization (Pr)
and coercive field (Ec) indicate the presence of macro-domains in association with the
cooperative natures of dipoles. The polarization of a normal ferroelectric is considered
to consist of two parts: a linear part caused by electronic and ionic polarizations, as
indicated by slope 1 in Figure 1.2 (b), and a non-linear part which is associated with
the couplings among the dipoles and can be saturated by a high enough applied
electric field. The non-linear part gives only a small contribution to the polarization at
low electric field strength; however with increasing field strength, the cooperative
couplings among the dipoles increase significantly, leading to formation of macrodomains. Thus, the polarization is dominated by the non-linear part. With the
presence of these strong dipolar couplings, a large reversible field is required to
induce the switching of dipolar orientations, thus a large Ec is resulted. Furthermore,
as shown in Figure 1.2 (c), the saturation polarization (Ps) decreases with increasing
3
Chapter 1
temperature and vanishes at Tc, implying that no polar domains exist at temperatures
above Tc. The vanishing of Ps is discontinuous for a displacive transition whereas
continuous for a second-order phase transition.
(a)
P
25
5
Pr
Ps
(b)
Slope 1
20
4
15
3
10
2
5
1
0
290 Tc
0
330
370
Ec
104/ε
εx103
E
410
Presence of macro-domains
(c)
P
Ps
Tc
Temperature
Sharp transition
T>Tc, ε(T) follows the Curie-Weiss Law
No frequency dispersion
Temperature
No polar domain above Tc
Figure 1.2 Temperature dependence of relative permittivity (a), P-E hysteresis
loop (b), and temperature dependence of polarization (c) of a typical normal
ferroelectric (adapted from [9]).
The understanding on the nature of normal ferroelectricity is still incomplete,
especially on why upon cooling from high temperature, perovskites that exhibit
different chemical natures can undergo different phase transitions, although they are
originated from similar high temperature cubic phases. For example, BaTiO3
4
Chapter 1
undergoes three phase transitions, cubic to tetragonal (393 K), tetragonal to
orthorhombic (278 K) and orthorhombic to rhombohedral (187 K), in contrast to the
only cubic to tetragonal transition for PbTiO3 at 766 K. To clarify this point, Cohen
[10,11] has elucidated the fundamental differences in the ferroelectricity exhibited by
BaTiO3 and PbTiO3. According to his electronic-structure calculations, the great
sensitivity of ferroelectricity to structural chemistry, defects, electrical boundary
conditions and pressure arises from a delicate balance between the long-range
Coulombic forces, which favour the ferroelectric states, and the short-range
repulsions, which favour the non-polar cubic states. Furthermore, the Pb-O
hybridization in PbTiO3 stabilizes the tetragonal phase by introducing 6% strain in the
c-axis of the perovskite lattice, whereas the completely ionic interaction between Ba2+
and O2- causes the most stable structure as rhombohedral for BaTiO3 [12].
It is well-known that the dielectric behaviour is originated from the polarization or, in
other words, the alignments of dipole moments in the direction of electric field;
however, the assumption that the polarization ( P ) is directly proportional to the
applied electric field ( E ), as shown in Equation (1-2), does not hold well to a
condensed material, especially to ferroelectrics where a large polarization is given by
only a small E .
P = Nα E
(1-2)
where N is the number of dipoles per unit volume; and
α is the polarizability of a dipole.
As a result, Devonshire [ 13 ] first described the dielectric behaviours with his
“Displacive Model” by applying Lorentz correction, as illustrated in Figure 1.3 (a).
5
Chapter 1
Microscopically, a central dipole is assumed to be surrounded by a spherical cavity
whose radius R is sufficiently large where the surrounding matrix may be treated as a
continuous medium. The local electric field ( E loc ) acting on the central dipole is a
summation of the external field ( E ), the field due to the charges at the external
surfaces of the sample ( E1 ), the field induced by the charges on the surface of the
Lorentz sphere ( E 2 ), and the field caused by the dipoles within the Lorentz sphere
( E 3 ). It can be clearly seen that E loc is much larger than the applied electric field,
and thus neighbouring dipoles are more effectively polarized cooperatively than that
of only by the applied field. This model successfully explains the discrepancies
between the physical behaviour suggested by Equation (1-2) and the experimental
results observed in ferroelectrics.
On the other hand, as demonstrated by Equation (1-3) below, a description on the
dependence of relative permittivity on temperature for a normal ferroelectric was also
given in this model.
ε (0 ) = n 2 + A ω s2
(1-3)
where ε(0) is the static relative permittivity;
n is the refractive index;
ωs is the angular frequency of soft-mode; and
A is a constant.
6
Chapter 1
(a)
E1
E3
R
E2
Central Dipole
(b)
Angular Frequency ωs
E
Tc
Temperature
Figure 1.3 Local electric fields induced by other dipoles considered in Lorentz
correction (a), and the temperature dependence of angular frequency of softmodes (b), for a normal ferroelectric.
Paraelectric state is stabilized by the soft-mode vibration at temperatures higher than
Tc. Soft-mode can be visualised as the long wavelength transverse optical (TO)
phonon mode or lattice vibration, the angular frequency (ωs) of which is a function of
temperature. At a temperature much higher than Tc, the long-range Coulombic forces
are then weaken by thermal agitation due to soft-mode vibrations in contrast to the
enhancement of short-range elastic restoring force, resulting in a deterioration on
interactions between the dipoles. Upon cooling from high temperatures, the angular
frequency of soft-mode as well as the short-range elastic restoring force decrease with
decreasing temperature, as demonstrated in Figure 1.3 (b). A strengthening in the
long-range Coulombic forces is thus achieved. According to Equation (1-3), ε(0)
becomes infinite when the angular frequency of soft-mode vanishes at Tc. Instability
of the system is then arisen and a simultaneous phase transition to a more stable
structure is triggered, example of which is the cubic to tetragonal transition of PbTiO3,
thus resulting in the nucleation of ferroelectric states. Following the similar ideas as
Devonshire, Slater [14] precisely computed the Lorentz correction by considering the
crystal structure of BaTiO3 with the aids of statistical mechanics, discarding the
7
Chapter 1
ambiguous assumption of Lorentz sphere suggested in Devonshire’s model. A
breakthrough on understanding the nature of Lorentz correction was then realized.
Indeed, similar approaches using first principle calculations have drawn the attentions
from many researchers.
1.2.2 Relaxor Ferroelectrics
As shown in Figure 1.4 (a-c), a relaxor ferroelectric is characterized by both of its
diffuse phase transition (DPT) with strong frequency dispersions of dielectric maxima
(ε max), and its slim P-E hysteresis loop. In contrast to a normal ferroelectric, there are
no macro-domains present in a relaxor, resulting in a rather low remanent polarization
(Pr). This phenomenon can be attributed to the re-acquisition of random dipolar
orientations of nano-sized domains upon removing the applied electric field. Owing to
the interactions among these nano-domains or dipolar clusters, Pr persists even at the
temperatures well above the temperature of ε max (Tmax), as shown in Figure 1.4 (c).
Furthermore, a typical relaxor ferroelectric also exhibits a strong deviation from the
Curie-Weiss law at temperatures higher than Tmax. Due to this discrepancy, quadratic
equations [Equations (1-4) and (1-5)] were suggested to describe the temperature
dependence of relative permittivity of a relaxor at temperatures higher than Tmax,
where both γ-exponent and δ reflect the diffusiveness of a relaxor and C ' is the CurieWeiss like constant [15]. The γ-exponent is 1 for a sharp transition and it lies in the
range 1 < γ ≤ 2 for a diffusive transition.
1 ε − 1 ε max =
(T − Tmax )γ
C'
(1-4)
8
Chapter 1
1
⎛ε ⎞
(T − Tmax )γ
ln⎜ max ⎟ =
2
⎝ ε ⎠ 2δ
(1-5)
102 Hz
104 Hz
106 Hz
10
ε x103
8
(a)
(b)
P
Pr
0.6
Ec
103/ε
6
0.8
E
0.4
4
Presence of nano-domains
0.2
2
200
250
300
350
400
450
0.0
Temperature
Broad ε(T) peak
T > Tmax, deviates from Curie-Weiss Law
With frequency dispersion
(c)
P
Tmax
Temperature
Nano-polar domains persist at T > Tc.
Figure 1.4 Temperature dependence of relative permittivity (a), slim P-E
hysteresis loop (b), and temperature dependence of polarization (c) for a typical
relaxor (adapted from [9]).
Smolenski [ 16 ] originally proposed that the key factor of DPT was chemical
inhomogeneity on cation sites. He postulated that the DPT arose due to a multitude of
local first order phase transition temperatures. Unfortunately, Smolenski’s model
failed to explain the occurrence of frequency dispersion that was commonly observed
for most of the relaxors. Twenty years later, Randall et. al. [17] suggested that the
relaxor behaviour is caused by formation of nano-polar clusters with the evidence of
nano-scale short range chemical order observed using transmission electron
microscope (TEM). Expanding this breakthrough, Cross [18] proposed that the dipole
moments within these clusters are dynamically fluctuating between equivalent
positions in correspondence with the change of temperature, resulting in relaxor
9