Effect of particle size distributions on membrane performance and fouling in microfiltration of polydispersed suspensions
Bạn đang xem bản rút gọn của tài liệu. Xem và tải ngay bản đầy đủ của tài liệu tại đây (8.21 MB, 137 trang )
E FFECT OF PARTICLE S IZE DISTRIBUTIONS
ON
MEMBRANE PERFORMANCE AND FOULING IN
MICROFILTRATION OF P OLYDISPERSED SUSPENSIONS
KHAING T HWE H TUN
NATIONAL UNIVERSITY OF SINGAPORE
2003
E FFECT OF PARTICLE S IZE DISTRIBUTIONS
ON
MEMBRANE PERFORMANCE AND FOULING IN
MICROFILTRATION OF P OLYDISPERSED SUSPENSIONS
KHAING T HWE HTUN
(B. E., CHEMICAL, YANGON TECHNOLOGICAL UNIVERSITY)
A THESIS S UBMITTED
FOR THE D EGREE O F MASTER OF ENGINEERING
D EPARTMENT OF C HEMICAL & ENVIRONMENTAL ENGINEERING
NATIONAL UNIVERSITY OF S INGAPORE
2003
ACKNOWLEDGMENTS
I would like to take this opportunity to express my deepest gratitude and indebtedness
to my academic supervisor, Dr. Bai Renbi, for his invaluable guidance, supports,
helps, and encouragements throughout the course of this work.
Many thanks also go to all the staff members of the Department of Chemical and
Environmental Engineering, National University of Singapore, as well as all my
colleagues in the lab, for their supports and ideals throughout the project. My thanks
are also extended to the staff from Water Reclamation Plant for any help they rendered
during this period to make the project possible.
I am most grateful to my parents, my husband, sisters and brothers, who provide love,
care, support, patience and encouragement throughout the study of this project.
I also would like to thank the National University of Singapore for providing the
financial support and the research scholarship during the two years of my postgraduate
study.
i
TABLE OF CONTENTS
ACKNOWLEDGEMENT
i
TABLE OF CONTENTS
ii
SUMMARY
vi
NOMENCLATURE
viii
LIST OF FIGURES
x
LIST OF TABLES
xvi
CHAPTER 1: INTRODUCTION
1
1.1 General Background of Microfiltration Study
1
1.2 Objectives of this Research
2
1.3 Scope of the Research
2
CHAPTER 2: LITERATURE REVIEW
4
2.1 Conventional Wastewater Treatment
4
2.2 A ctivated Sludge Process
6
2.2.1 Floc Sizes and Shapes
8
2.2.2 Dispersed Growth
8
2.2.3 Slime Bulking
9
2.3 Membrane Separation
9
2.3.1 Reverse Osmosis
10
2.3.2 Nanofiltration
10
ii
2.3.3 Ultrafiltration
12
2.3.4 Microfiltration
12
2.4 Operation Modes of Microfiltraion
13
2.5 Types of Membrane
14
2.6 Membrane Fouling
16
2.6.1 Complete Pore Blocking
17
2.6.2 Intermediate Pore Blocking
17
2.6.3 Standard Pore Blocking
18
2.6.4 Cake Formation
19
2.7 Membrane Fouling Resistance
19
2.8 Microfiltration with Constant Pressure Drop
20
CHAPTER 3: EXPERIMENTAL DETAILS
25
3.1 Microfiltration System
25
3.2 Deionised Water Filtration
28
3.3 Polydispersed Suspension Microfiltration
28
3.3.1 Types of Particles and their Size Distributions
28
3.3.2 Microfiltration of Polydispersed Suspension with Different
29
Size Distributions
3.3.3 Effect of Polydispersed Suspension Concentration on
30
Microfiltration
3.3.4 Effect of Suction Pressures on Polydispersed Suspension
30
Microfiltration
3.4 Microfiltration with Settled, Suspension and the Supernatant
31
3.5 Effect of Small Particles Followed by Large Particles or Large
32
iii
Particles Followed by Small Particles on Microfiltration
3.6 Activated Sludge Wastewater Microfiltration
33
3.6.1 Microscopic Examination of the Activated Sludge
33
3.6.2 Microf iltration of Activated Sludge Wastewater
34
3.6.3 Membrane Fouling with Activated Sludge Wastewater
34
CHAPTER 4: RESULTS AND DISCUSSION
36
4.1 Deionised Water Filtration
36
4.2 Polydispersed Suspension Filtration
40
4.2. 1 Effect of Particle Size Distributions on Microfiltration
40
Performance
4.2.2 Effect of Influent Suspended Solid Concentration
43
4.2.3 Effect of Suction Pressures on Membrane Performance
45
4.3 Cake Fouling Model Fitting to Experimental Performance Results
47
4.4 Effect of Small Particles on Membrane Fouling
51
4.5 Effect of Filtering Small Particle Suspension before Large Particle
54
Suspension and Large Particle Suspension before Small Particle
Suspension
4.6 Membrane Fouling Mechanism Identification
59
4.7 SEM Observations
69
4.8 Specific Resistance and Compressibility of Cake from Kaolin
69
Suspension
4.9 Microfiltraiton with Activated Sludge Wastewater
4.9.1 Microorganisms in the Activated Sludge Wastewater
79
79
iv
4.9.2 Permeate Flux in Microfiltration of Activated Sludge
81
Wastewater
4.9.3 Compressibility of Activated Sludge
4.10 Membrane Fouling Mechanisms for Activated Sludge Wastewater
82
85
Microfiltration
CHAPTER 5: CONCLUSIONS AND RECOMMENDATION
101
5.1 Conclusions
102
5.2 Recommendations
103
REFERENCES
104
APPENDIXES
110
v
SUMMARY
Microfiltration has been increasingly used for the removal of particulate matter in
water purification and wastewater treatment. A major operational constraint in
microfiltration is the rapid reduction in permeate flux as a result of membrane fouling
due to high solids loading. Membrane fouling in microfiltration can be attributed to
pore blocking and cake formation. While many studies have been devoted to the
macroscopic phenomenon of fouling, little was known on how particle size
distribution will affect membrane fouling. In this study, suspensions of different
particle size distributions were prepared and used in a series of dead-end
microfiltration experiments. The effects of particle size distribution on transmembrane pressure, permeation flux and membrane fouling were investigated. The
results show that suspensions contained large number of small particles cause severe
membrane fouling. For example, with about the same mean particle size, a suspension
with a larger particle size range has a lower permeate flux than that with a smaller
particle size range, even though the concentration of the suspension with a larger
particle size range is lower. Higher trans-membrane pressures produce higher initial
permeate flux, but a suspension with a larger particle size distribution has greater
permeate flux decline at a higher trans-membrane pressure than the suspension with a
smaller particle size distribution.
The mechanisms of pore blocking and cake formation were characterized with
theoretical models, together with surface examination using SEM. The results show
that smaller particles cause higher pore blocking resistance and also higher specific
cake resistance. The specific cake resistance was also found to be higher for the cake
vi
formed by microfiltration of a suspension with a larger particle size range, due to the
filling of small particles into the pore spaces among the large particles.
Moreover, membrane fouling was found to experience a transit from initial pore
blocking mechanism to final cake formation mechanism, and the transition be greatly
affected by particle size distributions in the suspensions.
The influences of specific cake resistance, kc, on permeate flux were also studied for
compressible and incompressible cake systems. The results show that when pressures
are increased, the values of kc are also increased in a compressible cake system but do
not change significantly in an incompressible cake system. The reason is that
compressible cake consists of deformable colloids and incompressible cake consists of
rigid colloids.
The mechanisms of pore blocking and cake formation were also studied with activated
sludge whose particles are usually compressible. In this case, activated sludge was
settled for 1 or 2 hr, respectively and microfiltration was conducted with the
supernatant, settle portion or original activated sludge. Severe membrane fouling due
to pore blocking was observed for supernatants because they contained more small
particles that had sizes close to that of the membrane pore sizes.
The study concludes that particle size distribution plays a very important role in
microfiltration performance and particles with sizes close to the pore sizes of the
membrane caused the severest membrane fouling.
vii
NOMENCLATURE
BOD 5
Biochemical Oxygen Demand - 5 days (mg/L)
COD
Chemical Oxygen Demand (mg/L)
c
Influent Concentration (mg/L)
co
Initial concentration (mg/L)
DO
Dissolved Oxygen (mg/L)
F/M
Food to Biomass Ratio (mg BOD5 applied/mg MLVSS.d)
gal.
Gallon
hr
Hour
MF
Microfiltration
min
Minute
MLSS
Mixed Liquor Suspended Solids (mg/L)
MLVSS
Mixed Liquor Volatile Suspended Solids (mg/L)
NF
Nanofiltration
P
suction Pressure (kPa)
PVDF
Polyvinylidene difluoride
RO
Reverse Osmosis
TSS
Total Suspended Solids (mg/L)
T
Temperature ( °C)
UF
Ultrafiltration
kc
Specific Cake Resistance (m/kg)
n
Compressibility Factor
αo
Constant
viii
∆P
Transmembrane Pressure (kPa)
A
Filtration Area (m 2)
C
Concentration (mg/L)
J
Filtration Flux (L/m2.hr)
µ
Permeate Viscosity (water viscosity at 21°C) (Pa.hr)
Rf
Fouling Resistance (1/m)
Rm
Initial Membrane Resistant (1/m)
Rt
Total Resistance (1/m)
t
Filtration Time
V
Accumulative Permeate Volume (m3)
HMWC
High Molecular Weight Component, such as a protein molecule.
LMWC
Low Molecular Weight Component, such as NaCl.
CA
Cellulose acetate, most often di- or tri-acetate.
PS (PSO)
Polysulfone (either polyethersulfone or polyarylethersulfone).
PVDF
Polyvinylidenedifluoride.
PS (PSO)
Polysulfone (either polyethersulfone or polyarylethersulfone).
φs = 1 − ξ s
the solids volume fraction in the suspension being filtered
φc = 1 − ξ c
the solids volume fraction in the cake
ξs
Void fraction of the solid
ξc
Void fraction of the cake
Q
Volume flow rate (m3/s)
Rc
Resistance of the cake (m -1 )
δc
Cake thickness (m)
ix
LIST OF FIGURES
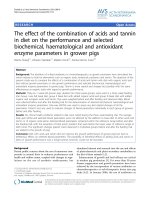
Figure 2.1 A schematic layout of a conventional wastewater treatment plant
Employing the activated sludge process
5
Figure 2.2 Schematic of dead-end filtration and crossflow filtration
14
Figure 3.1 Schematic flow diagram of the microfiltration system
26
Figure 3.2 Cross sectional vie w of the membrane housing
27
Figure 4.1 Deionised water filtration with 0.1 µ m membrane at various
suction pressures (T : 21°C)
36
Figure 4.2 Deionised water filtration with 0.22 µ m membrane at various
suction pressure (T: 21°C)
37
Figure 4.3 Membrane resistance determined from deionised water filtration
39
For the 0.1 and 0.22 µ m membranes under various suction pressures
Figure 4.4 Volume percentage distributions of the particles in the four types
of polydispersed suspensions
40
Figure 4.5 Permeate fluxes versus time for microfiltration of the four types
of suspensions (p:50 mg/L; P: 53.33 kPa, T: 21°C)
41
Figure 4.6 Number percentage versus particle diameter for the four types
of suspensions
42
Figure 4.7 Time dependence of permeate flux for (a) 1-5 µ m (b) 5-10 µ m
(c) 10-20 µ m particle suspensions under two different influent
concentrations (c: 50 and 500 mg/L, P: 53.33 kPa, T: 21°C)
44
x
Figure 4.8 Permeate flux versus time for microfiltration under different suction
46
pressures (c: 50 mg/L, Type 2, Type 3 and Type 4 suspensions, T: 21°C)
Figure 4.9 Accumulative permeate volume for different polydispersed
suspensions: model results versus experimental results (c: 50 mg/L,
P: 53.33 kPa, Membrane filtration area: 12.56 m2)
48
Figure 4.10 Cake resistance versus time for the microfiltration of the
Different types of suspension
51
Figure 4.11 Permeate flux versus time for supernatant (Type A)
settled portion (Type B) and the original suspension (Type C)
(c: 21 mg/L for supernatant, 59 mg/L for settle layer,
50 mg/L for suspension, P: 53.33 kPa, T: 21°C)
52
Figure 4.12 Particle size distributions in Type A, Type B and Type C
suspensions
53
Figure 4.13 Cake resistances for microfiltraion of Type A, Type B and
Type C suspensions
54
Figure 4.14 Permeate flux versus time for Series 1, Series 2 and Series 3
Experiments. (c: 57 mg/L for all types of suspensions,
Settling time: 0.5 hr, P: 53.33 kPa, T: 21°C)
56
Figure 4.15 Particle size distributions in supernatant (Type A),
settled portion (Type B) and the mixed suspension (Type C)
56
Figure 4.16 Cake resistances for Series 1, Series 2 and Series 3 experiments
57
Figure 4.17 SEM images showing the features of cake formation in different
series of experiments.
59
Figure 4.18 Permeate fluxes versus time for Series 1 and Series 2 filtration
(c: 23 mg/L for supernatant, 27 mg/L for settle layer, P: 53.33 kPa,
T: 21°C)
60
Figure 4.19 Particle size distribution in the supernatant and the settled portion
of the suspension
61
xi
Figure 4.20 Complete pore blocking model was fitted to the experimental data,
Showing good agreement in the stage of supernatant filtration
in Series 1.
62
Figure 4.21 Intermediate pore blocking model was fitted to the experimental
Data, showing a good agreement in the period after the initial
Complete pore blocking for supernatant filtration in Series 1.
62
Figure 4.22 Cake filtration model was fitted to the experimental data, showing
Good agreement for the filtration of the settled portion in Series 1
63
Figure 4.23 Intermediat pore blocking model fitted to the filtration of the
settle portion in the initial stage in Series 2
64
Figure 4.24 Cake filtration model fitted to the filtration of the supernatant
In the later stage in Series 2
64
Figure 4.25 Intermediate pore blocking model fit ted to the filtration of the
Supernatant in Series 2
65
Figure 4.26 Cake filtration model fitted to the filtration of the supernatant
in the later stage in Series 2
65
Figure 4.27 Permeate flux versus time for Series 1 and Series 2 filtration
With Type 4 particles (10-20 µ m) (c: 21 mg/L for supernatant
and 39 mg/L for settled, P: 53.33 kPa, T: 21°C)
66
Figure 4.28 Intermediate blocking model was fitted with the experimental data
in Series 1.
67
Figure 4.29 Cake filtering model was fitted to the experimental data in Series 1
67
Figure 4. 30 Intermediate blocking model was fitted to the experimental data
in Series 2.
68
Figure 4.31 Cake filtering model was fitted to the experimental data in Series 2
68
xii
Figure 4.32 SEM images of clean membra ne and membrane with fouling
69
Figure 4.33 Permeate flux versus time for kaolin particle suspension
(c: 50 mg/L, T: 21°C, membrane pore size: 0.1 µ m)
70
Figure 4.34 Particle size distribution for kaolin particle suspension
70
Figure 4.35 At/V versus V/A for kaolin suspension microfiltration
(co: 50 mg/L, T: 21°C)
71
Figure 4.36 At/V versus V/A for T ype 1 to Type 4 suspensions
(co : 50 mg/L, P: 53.33 kPa, T: 21°C)
71
Figure 4.37 Specific resistance (kc) of the boundary layer as a function of
the suction pressures
73
Figure 4.38 Time dependence of accumulative volume for (a) kaolin
suspension and (b) different kinds of polydispersed suspensions:
(Type 1 to Type 4) experimental data and model results
75
Figure 4.39 Specific cake resistance reduced with increased pressures for
kaolin particle cake
77
Figure 4.40 Specific cake resistance increased for the suspension contained
larger amount of small particles
77
Figure 4.41 Effect of transmembrane pressures on deposit built-up
(cake thickness) for kaolin particle suspension
78
Figure 4.42 A list of microorganism observed in the sludge under light
80
Microscope (a) branching cilicate at 500x (b) single branching ciliate
At 500x (c) Nematode microworm at 500x (d) branching filament at
500x (e) free-swimming rotifer at 200x (f) bulking sludge
at 500x (g) bulking sludge with gradually decreasing filamentous
growth at 200x (h) high settleability sludge with large
grandule-like flocs and almost no filamentous growth at 200x.
Figure 4.43 Permeate flux versus time for activated sludge wastewater
81
xiii
Microfiltration under different suction pressures
(MLSS ≈ 2500 mg/L)
Figure 4.44 Specific cake resistances determined from Eqn (4.5) for
(a) 0.1 µ m (b) 0.22 µ m membranes in the filtration of the
activated sludge wastewater
83
Figure 4.45 Deposited cake thickness on the membrane at different suction
pressure for 0.22 µ m membrane
84
Figure 4.46 A plot of specific cake resistance versus filtration pressure drops
to determine the values of the compressibility coefficient
84
Figure 4.47 A large number of small particles contained in the
activated sludge wastewater
85
Figure 4.48 Permeate flux versus time for three types of suspensions
86
(a) supernatant (b) settled (c) suspension (settling time = 1 hr,
MLSS for supernatant layer ˜ 25 mg/L,
MLSS for settle layer ˜ 220 mg/L, MLSS for suspension ≈ 158 mg/L,
P: 53.33 kPa, T : 21°C)
Figure 4.49 Particle size distributions in the supernatant (Suspension A),
87
Settled portion (Suspension B) and initial suspensio n (Suspension C)
Figure 4.50 (a)Standard blocking model was fitted to the experimental data
(b) cake filtration model was fitted to the experimental data
for the later part of the Suspension A filtration
88
Figure 4.51 SEMimages of (a) clean membrane pore diameter 0.22 µ m
(b) standard pore blocking and formation of cake for the
suspension A filtration
89
Figure 4.52 (a) Standard blocking model was fitted to the experimental data,
(b) Cake filtering model was fitted with the experimental results
90
Figure 4.53 SEM image for (a) clean membrane (b) fouled membrane showing
standard blocking and formation of cake took place for the
Suspension C filtration
91
xiv
Figure 4.54 Intermediate blocking mode l and cake filtering models
92
were fitted with the experimental results for suspension B filtration.
Figure 4.55 SEM image shows the intermediate pore blocking of membrane
by the filtration of settled portion of the suspension (Suspension B)
93
Figure 4.56 Permeate flux versus time for three different types of suspensions.
Superna tant (21 mg/L for supernatant, 230 mg/L for settled and
150 mg/L for suspension
94
Figure 4.57 Particle size distribution in the supernatant (Suspension A),
94
settled portion (Suspension B) and the initial suspension (Suspension C).
Figure 4.58 Standard blocking model and cake filtering model fitted with
the experimental results
95
Figure 4.59 (a) Clean membrane (pore size 0.22 µ m) (b) fouled membrane
under SEM image.
96
Figure 4.60 Standard blocking model and cake filtering model were fitted with
the experimental results for suspension C filtration
97
Figure 4.61 (a) Clean membrane (pore size 0.22 µ m), (b) Standard pore
blocking for Suspension C filtration
98
Figure 4.62 Intermediate blocking model and cake filtering model were fitted
with the experimental results for Suspension (B)
99
Figure 4.63 Intermediate pore blocking could be seen under SEM image
( 10.000x magnifications)
100
xv
LIST OF TABLES
Table 2.1 Classification of the various types of membranes and some
of their applications
11
Table 3.1 Composition of the coarse test dust used in the study
29
Table 3.2 Experimental conditions to investigate the effect of concentrations
30
Table 3.3 Experimental conditions for the study of suction pressures
on microfiltration
31
Table 4.1 Permeate flux data of deionised water filtration with 0.1 µ m
membrane (T: 21°C)
37
Table 4.2 Permeate flux data of deionised water filtration with 0.22 µ m
membrane (T: 21°C)
38
Table 4.3 Membrane resistance data for 0.1 µ m and 0.22 µ m membranes
(T: 21°C)
39
Table 4.4 Parameter values in the model fitting study in Figure 4.9
50
Table 4.5 Linear regression for operations under various suction pressures
And different particle size distributions
72
Table 4.6 Parameter values of Eq. (4.5) fitted to experimental results
74
xvi
Chapter 1
Introduction
CHAPTER 1 INTRODUCTION
1.1 General Background of Microfiltration Study
Microfiltration (MF) is a membrane process, increasingly used in the separation of
suspended particles, microorganisms, macromolecules and emulsion droplets, etc. from
various liquid fluids. MF has also attracted more and more interests in conventional water
and wastewater treatment (Ripperger, 1989) for the removal of suspended or colloidal
particles as these particles are in the micron and submicron ranges and are often difficult
to be reliably removed by the conventional separation methods such as sedimentation, and
depth filtration.
In particular, the activated sludge process used in most wastewater treatment systems or
plants is usually limited by the difficulty of separating suspended matter from the effluent
by settling (Defrance et al., 2000). The settling process also limits the biomass
concentration in activated sludge process to about 5g/L, which requires large areas of
settling tanks to be constructed in order to achieve the desired separation of solids. This
constraint explains the current interest in membrane bioreactors (MBRs) in which the
settling tank is replaced by a microfiltration membrane unit that permits the extraction of
a high quality of effluent. The advantages of a MBR system include that higher biomass
concentration up to 30 g/L (Yamamoto et al., 1989) can be applied to produce higher rates
of BOD and COD removal (Trouve et al., 1994), beside the production of purified water
that can be recycled. In addition, the space occupied by the treatment plant using a MBR
1
Chapter 1
Introduction
system is greatly reduced due to the absence of the settling tanks and the use of higher
biomass concentrations in the system.
Unfortunately, the operational cost of treatment by a MBR system is higher than that of
the conventional treatment systems due to membrane fouling and the needs of frequent
replacement of the membrane (Owen et al., 1995). To make the MBR process
economically competitive, the permeate flux of the membrane must be increased and/or
maintained. To this end, it is necessary to investigate and understand the mechanisms that
lead to membrane fouling.
1.2 Objectives of this Research
In this study, membrane fouling by suspensions with different particle size distributions is
investigated. The mechanisms of membrane fouling due to particles deposition,
adsorption are examined in terms of pore blocking and cake formation for microfiltration
in the dead-end operation mode.
1.3 Scope of the Research
The first stage of the research investigates the effect of particle size distributions on
membrane fouling with inorganic particles that are less compressible. A model for the
pore blocking and cake formation fouling mechanisms is used to examine the individual
or relative importance of the different fouling mechanism. In the second stage of the
research investigation is focused on the incompressible and compressible cake systems
and their influence on the specific cake resistances in microfiltration and activated sludge
2
Chapter 1
Introduction
wastewater is used to study the membrane fouling mechanisms with particles of different
size distributions.
3
Chapter 2
Literature Review
CHAPTER 2 LITERATURE REVIEW
2.1 Conventional Wastewater Treatment
Wastewater, such as sewage, must be treated before being released into the environment
to prevent the spread of disease. Generally, there are two fundamental reasons for treating
wastewater: to prevent pollution and thereby protect the environment; and, perhaps more
importantly, protecting public health by safeguarding eater supplies and preventing the
spread of water-borne diseases (Gray, 1989). Usually sewage is treated in special
treatment plants that utilize bacteria, fungi and protozoa to decompose the organic matter
present in wastewater into simpler, less toxic compounds. The decomposition takes place
in both aerobic and anaerobic environments. The major objectives of most wastewater
treatment plants have been to decompose the organic pollutants and to destroy pathogens
present in the wastewater, though recycling wastewater nutrients or producing useful
products from this waste material is attracting increased interest in wastewater treatment
in recent years.
Conventional wastewater treatment plants are designed to accomplish their objectives by a
series of physical, chemical and biological processes. Figure 2.1 shows the schematic
layout of a typical wastewater treatment plant using the activated sludge process.
Normally, wastewater undergoes three stages of treatment in a conventional treatment
plant. The first step of wastewater treatment is preliminary treatment. This process is used
to screen out, grind up, or separate debris from wastewater to protect the pumping and
other equipment in the treatment plant. Treatment equipment such as bar screens,
4
Chapter 2
Literature Review
comminutors, and grit chambers are used when the wastewater enters a treatment plant.
The collected debris is usually disposed of in a landfill.
Effluent Recycle
Primary
Clarifier
Influent
wastewater
Pretreatment
Secondary
Clarifier
Aeration Tank
Effluent
Sludge Recycle for Seeding
To sludge thickening and
Dewatering
To Sludge Thickening and
Dewatering
Figure 2.1 A schematic layout of a conventional wastewater treatment plant
employing the activated sludge process.
The second step of wastewater treatment is primary treatment. It separates suspended
solids and greases from wastewater. Wastewater is settled in a tank for several hours,
allowing the particles to settle to the bottom and the greases to float to the top. The solids
are drawn off from the bottom and the floats are skimmed off at the top. The clarified
wastewater then flows to the next stage of wastewater treatment. Primary clarifiers and
septic tanks are the units usually used in the primary treatments stage.
5
Chapter 2
Literature Review
The third step of wastewater treatment is secondary treatment. It is a biological treatment
process to remove dissolved organic matter from wastewater. The system usually includes
an aeration tank followed by a secondary clarifier. Sewage microorganisms are cultivated
and added to the wastewater, and the microorganisms absorb organic matter from sewage
as their food supply in the aeration tank. Then, the wastewater is directed to a clarifier
where the microorganisms are separated from the water. A portion of the settled activated
sludge from the secondary clarifier is recycled back to the aeration tanks and the other
will undergo sludge thickening and dewatering before being further disposed by
incineration, composting or landfill. The final effluent from secondary treatment is
discharges into natural sinks such as rivers, lakes and estuaries. The effluent may be
returned to the aeration tanks for further treatment if its quality does not meet legal
discharge standards.
Advanced treatment may be necessary in some cases to further remove nutrients from
wastewater. In the treatment process chemicals are sometimes added to help settle out or
strip out phosphorus or nitrogen. Coagulant addition for phosphorus removal and air
stripping for ammonia removal are the examples of nutrient removal in these systems.
2.2 Activated Sludge Process
The activated sludge process is the most widely used biological wastewater treatment
process for the treatment of both domestic and industrial wastewater. The activated sludge
6
Chapter 2
Literature Review
can be defined as a mixture of microorganisms which contact and digest bio-degradable
materials (food) from wastewater. The microorganisms metabolize and transform the
organic substances into environmentally acceptable forms. The activated sludge typically
consists of approximately 95% bacteria and 5% higher organisms (protozoa, rotifers, and
higher forms of invertebrates). The degradation and removal of organics present in the
wastewater are achieved by the nutritional activities and inter-species interactions of the
organisms.
In general, the activated sludge process is operated in a continuous or semicontinuous
aerobic method for carbonaceous oxidation and, it necessary, also for nitrification. The
wastewater is aerated to promote the growth of microorganisms which form the activated
sludge flocs. The flocs are separated in the secondary clarifier. Part of them may be
discharged and the remainder is returned to the aeration unit. Gravity settling or floatation
methods are used for the separation of the flocs from treated wastewater. It is obvious that
the growth of microorganisms plays an important role in the performance of the activated
sludge process. The process may be monitored using a microscope to determine the
conditions of the activated sludge, such as identifying the filamentous bacteria that often
cause the problems of sludge bulking in wastewater treatment plants.
7