Effect of thickness on the physical, thermal and chemical properties of ultra thin polymer films
Bạn đang xem bản rút gọn của tài liệu. Xem và tải ngay bản đầy đủ của tài liệu tại đây (1.28 MB, 76 trang )
Acknowledgements
Gratitude goes to my two supervisors, Dr Low Hong Yee from Institute of
Materials Research and Engineering (IMRE) and Asst Prof Chin Wee Shong from
Department of Chemistry, National University of Singapore (NUS). They have
patiently guided and imparted invaluable knowledge and advice to me during the past
2 years.
Many thanks to Dr Low Hong Yee’s team members especially to Ms Loh Wei
Wei, Mr Xu Yongan and Mr Huang Hongliang for the technical assistance and
making my work in the laboratory enjoyable. They never fail to render help whenever
required. Also to Dr Chin Wee Shong’s team members, Ms Lim Wen Pei, Mr Kerk
Wai Tat, Ms Yin Fenfang, Ms Xu Hairuo, Mr Neo Min Shern and Ms Liu Chenmin
for offering helpful advice during our regular group meetings and making group
meetings and gatherings fun.
Appreciation also to many IMRE research staff who had assisted me in the use
of the various equipment: Mr Lim Poh Chong for use of XRD, Mr Zheng Yuebing for
AFM and ellipsometry, Dr Pan Ji Sheng for XPS, Ms Doreen Lai for TOF-SIMS and
Ms Tan Li Wei for contact angle measurements; also to Dr Yang Ping from Singapore
Synchrotron Light Source (SSLS) for her help in the density measurements using the
XSF.
My MSc stint in IMRE and NUS will not have been possible without the
constant support and encouragement from family, friends and fellow IMRE
colleagues.
Lastly, I thank IMRE and NUS for providing me a Graduate Research
Scholarship and giving me an opportunity to learn and obtain a higher degree.
1
Abstract
Polymer ultra-thin films, defined as films with thickness <100nm, have
recently gained scientific and technological interest. This is due to the many
technological applications using such films. It is now known that the properties of
materials in the nanometer scale deviate significantly from their bulk phase. With the
move towards nanotechnology and smaller devices, there is a need to understand the
properties of ultra-thin polymer films that are widely used in the industries today.
In this work, we investigated the thickness dependence on the thermal,
physical and chemical properties of ultra-thin films of 3 selected polymers. In the first
part of our study, we investigate the thermal and physical properties of hydrophilic
polyetherimide (PEI) ultra-thin films. Polyimides are widely used in the
microelectronic industries as barrier and dielectric films. Two important properties for
such applications are the glass transition temperature and the moisture absorption
capacity. PEI films of different thicknesses were prepared by spin coating, the glass
transition temperatures, Tg, and the moisture absorption were measured, the effects of
film/substrate interaction were also investigated by coating the PEI film on two
different substrates: a hydrophilic Si substrate and a hydrophobic Au substrate.
The second part of the thesis was to study the thermal annealing effects on
parylene C, which is a transparent and hydrophobic polymer. We investigated the
effect of thermal annealing on the secondary crystallization as a function of film
thickness.
The effect of film thickness on the surface chemical groups was studied on a
series of amino-parylene films. Unlike the parylene-C, the amino-parylene is found to
be an amorphous polymer.
A surface immobilization reaction was carried out
between the amino group and a dianhydride.
By monitoring the immobilization
2
capacity, the effect of film thickness on surface functional group was studied. The
surface concentration of the amino group was found to be dependent on the film
thickness.
3
Chapter 1
Introduction
With nanotechnology prevailing in recent years, it demands that materials are
to be utilised at increasingly smaller length scales. Thin polymeric films have been
used in various applications from coatings1 to sensors2 to templates for
microelectronics. With the push towards nanotechnology which leads to the shrinking
dimensions of devices, ultra-thin polymer films in the nanometer dimensions are now
used in these devices. Thus understanding how the properties of these ultra-thin
polymer films would vary from the bulk behaviour has become increasingly important
and vital.
3
It is generally understood that material properties in confined geometries
and at surfaces or interfaces can deviate from bulk properties. Deviations in various
physical or chemical properties at increasingly smaller dimensions will affect device
performance. For example, in thin polymer films there are well-documented shifts of
the glass transition temperature (which will be discussed later in this chapter) as the
film thickness approaches the unperturbed dimensions of the macromolecule in bulk.
Finite size effects could have significant impact in fields such as diffusivity in a
chemically amplified photoresist or polymer viscosity in imprint lithography will
display dramatic changes at Tg.4-8
With the push towards thinner lithography films and smaller device features in
the semiconductor industry, interfaces have become a significant portion of the total
photoresist film and can lead to apparent changes in the physical properties such as
the thermal and transport properties when the film thickness approaches the bulk
radius of gyration (Rg).9 Thus with important factors such as thickness of the films and
the chemical properties of the polymer, it becomes important to understand how the
polymer properties changes with thickness.
4
1.1
Effect of Thickness on Glass Transition Temperature
Glass transition temperature describes the change from a rubber-like liquid to
a glassy or amorphous solid as a material is cooled. The concepts of free volume and
cooperative motion are often used in explaining the reduction in molecular mobility
with decreasing temperature. In bulk polymers, Tg is strongly influenced by the
chemical structure of the repeating unit. It increases with decreasing flexibility of the
polymer chain. Flexibility decreases with increasing aromatic composition of the
main chain by the incorporation of bulky substituents or non-rotational groups in the
main chain. The motion of individual molecule requires sufficient free volume for
chain movement.10 However, for ultra-thin films, other factors come into place to
affect the changes in Tg.
Over the past decade, there has been much research done on Tg in thin
polymer films. Recent work shows that structure, wetting and mobility of polymers in
the form of ultra-thin films differ greatly from bulk.11-16 For supported films, there is a
strong dependence in the substrate.17 Identifying the Tg as a function of film thickness
is a common theme as it has dramatic impact on numerous thin film applications as Tg
implies the softening of the material. 11, 18
The first study of the dependence of Tg on the thickness in thin films was done
by Keddie et al. using ellipsometry.19-20 They reported the first decrease in Tg with
thickness of polystyrene films supported on hydrogen-passivated silicon wafers. To
measure the Tg, the film thickness is measured as a function of temperature and Tg
corresponds to the discontinuous change in thermal expansion. Keddie et al. also
prepared a series of polystyrene films on native oxide layer of silicon wafers. They
measured the reductions in Tg for thickness < 40nm.
There are also a range of other experimental methods that have been used to
5
investigate polystyrene films such as Brillouin scattering, positron annihilation,
specular X-ray reflectivity, dielectric spectroscopy, thermal analysis and atomic
microscopy.21-24 Traditional techniques that are used to measure Tg and chain motion
in bulk samples, such as differential scanning calorimetry and neutron scattering, do
not have the sensitivity to measure films of sub-micron dimensions.
Keddie and Jones also performed a study on 2 different substrates, gold and
silicon oxide, on the Tg of ultra- thin films of poly(methyl methacrylate) (PMMA). It
was observed that the Tg of PMMA decreased with decrease in thickness on gold
substrates but increased on silicon oxide substrates. The authors attributed the
difference in behaviour to restricted mobility at the solid interface with silicon oxide
due to hydrogen bonding. They concluded that the nature of the interaction of
polymer with the substrate must be the dominant factor in determining the thickness
dependence of Tg on supported film. A frequently drawn conclusion from these
results can be given as:
∆Tg = Tg (thin film) - Tg (bulk)
Equation 1.1
where the sign of ∆Tg is directly related to the interfacial interaction strength. If ∆Tg <
0, it corresponds to weak interactions and if ∆Tg > 0, it corresponds to strong
interactions.19-20, 24
Several authors proposed models of Tg behaviour in which the films are
considered to consist of three layers.18, 25-27 Thus the dynamics of the material and the
Tg of each layer are postulated to be different. In the first layer (near the free surface),
the chain mobility is greater than in the bulk polymer; in the second layer (in the
centre of the film), the chain mobility is equivalent to the bulk polymer, while in the
third layer (at the solid interface), the mobility is restricted relative to the bulk
polymer. With an increase in Tg when thickness decrease, there is reduced mobility of
6
the polymer chains as a result of attractive forces at the interface.11
In a free standing film with the same dimensions, Tg was depressed by ~70°C
as compared to that of supported film of the same thickness where Tg was depressed
by ~20°C. This clearly depicts the role of interfacial interactions.28
Study on Tg of thin poly(2-vinyl pyridine) (P2VP) film coated on silicon wafer
also revealed Tg increased with decreasing film thickness. A stronger interaction
between the polymer and native oxide surface of silicon wafer was expected as
compared to PMMA with the same substrate due to the chemistry of P2VP.29
Fryer et al
11
showed the dependence of Tg of polymer films on interfacial
energy and thickness. They reported that the glass transition temperatures of ultra-thin
films of polystyrene and poly(methylmethacrylate) depend strongly on the thickness
and interfacial energy between the polymer film and the substrate. The substrates
were first treated with stable self-assembled films of octadecyltrichlorosilane (OTS)
on silicon wafers. The interfacial energy between the substrates and polystyrene or
PMMA was tuned by exposing it to different X-ray doses of exposure in the presence
of air. Exposure to X-ray radiation modified OTS by producing oxygen containing
groups on the surface and this interfacial energy for both polymers increases with
increased dosage. It was observed that at low values of interfacial energy, Tg of
polymer films was less than bulk value and a reverse phenomenon was observed for
that of high values of interfacial energy. They interpreted their results in terms of the
layer model. High interfacial energy resulted in decreased segmental mobility and
thus an increase in Tg.11
Results of molecular dynamic simulations can give further insight to the
decrease in segmental mobility of polymer chains with increasing interfacial energy.
Torres et al. represented polymer molecules in their simulations using square-well
7
interaction sites interconnected by fully flexible strings.30 For supported films, an
attractive wall represented the substrate. If the attractive potential, ε, between the
interaction sites of the polymer chains and wall was the same as the attractive
potential between polymer-polymer sites, the wall was considered as weakly
attractive and Tg will decrease compared to the bulk. If ε between the interaction sites
of the polymer chains and wall was doubled, then the wall was considered as strongly
attractive and Tg increased as compared to bulk polymer. Thus an analysis of total
mean displacement of segments as a function of temperature and position in the film
shows the mobility of the polymer near the substrate decreased with increasing ε.
With experimental results, layer models and molecular simulations, it is concluded
that the mobility of polymer segments near the substrate decreases as the interfacial
energy increases and the nature of substrate-polymer interface dominates the Tg
behaviour of ultra-thin films.11
1.2
Effect of Thickness on Moisture Uptake
With chain mobility being affected by chain confinement effects3 and hence
having an effect on the Tg of the polymer film, we expect similar effect when small
molecule diffuses inside the polymer film. Moisture uptake and swelling of the
polymers can lead to significant reliability problems. Presence of small amounts of
water in polymer thin films can affect a variety of thin film physical properties.
Examples are changes in mechanical properties such as tensile stress or hardness,
electronic properties, as well as chemical and processing characteristics of polymer
thin films in applications. Presence or lack of water in photoresists during the
fabrication of intergrated circuits can change the physical and chemical properties as
well as affect the imaging characteristics31-32. Small amount of water in the
8
photoresist film can affect the reaction pathways responsible for solubility changes
that permit lithography imaging of materials. Too little water in the photoresist
during exposure can also lead to considerable side reactions.31
There are many methods to measure the water sorption in polymer films.
These methods include gas permeation techniques, electro-microbalances, quartz
spring microbalance, FTIR and stress analyzer.31 In the present work, we will study
the water uptake as a function of film thickness on gold coated and silicon oxide
coated QCM crystals. QCM was chosen as the technique used as it can accurately
detect mass uptake in the order of nano grams. The linear relationship between small
mass uptake (∆m) on the coated crystal and quartz crystal frequency shift (∆f) is
described by the Sauerbrey’s equation in Equation 1.2:
∆m = K∆f
Equation 1.2
where K is the proportionality constant which incorporates known properties of the
quartz crystal.3, 31, 33-34
1.3
Effect of Thickness on Immobilization Capabilities
Surface modification of polymers can be achieved by introducing functional
groups that allow the buildup of polyelectrolyte multilayers via layer-by-layer
assembly.35-39 Margarita et al
39
reported a method for surface modification of
hydrophobic substrates through the absorption of poly(vinyl alcohol). This increased
the wettability of the substrates and hence it serves as a platform for other chemistries.
They also reported the CVD polymerization of ethyl cyanoacrylate to form ultra-thin
poly(ethyl cyanoacrylate) coatings. There is a need to understand the chemistry
behind the polymer by determining the orientation and the morphology of the
functional groups. From there, we will be able to functionalise our polymer to serve as
9
a platform for other applications such as sensors.
1.4
Scope of work
Due to the impending importance of ultra-thin polymer films being utilized in
various applications, it becomes necessary to determine how thermal, physical and
chemical properties will change with thickness. In this work, we will focus on 2
classes of polymer thin films, polyetherimide and parylenes, prepared using two
different deposition processes, spin coating and chemical vapour deposition (CVD)
polymerization respectively. We will investigate the thickness effects on the thermal
(glass transition temperature, Tg, changes and effects of annealing), physical
(moisture sorption studies) and chemical (immobilization capabilities) properties of
these ultra-thin films.
In general, polyimides are important materials for the electronics industry due
to their thermal stability, high chemical resistance characteristics and excellent
mechanical toughness. However, polyimides are known to absorb water in small
amounts. Water absorbed in polyimide films cause metal corrosion, package cracking,
delamination, failures of adhesion to metals and degradation of dielectric properties.
The dimensions of the films will also be affected by water due to swelling. Thus the
moisture sorption behaviour of polyimide films is to be investigated as it has effects
with regard to the reliability and performance of electronic devices fabricated with it.
It also becomes important to investigate the moisture sorption behaviour with respect
to changes in thickness and substrate influence.10-12
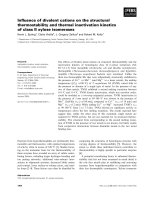
In Chapter 3 of this work, a specific type of polyimides, polyetherimide (PEI),
(or also known as ULTEM, with its chemical structure as shown in Figure 1.1) is
selected for studied. PEI has high heat-distortion temperature, tensile strength and
10
modulus. It is often used in high-performance electrical and electronic parts,
microwave appliances and automotive parts.10
O
O
N
N
CH3
O
O
O
O
CH3
n
Figure 1.1 Chemical structure of PEI
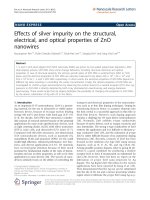
The polymer thin films studied in Chapter 4 of this work belong to the
parylenes family. Parylene C, with its structure shown in Figure 1.2, is a hydrophobic
polymer and is optically transparent. It has excellent mechanical, electrical, thermal
and biomedical properties and can be synthesized by CVD polymerization. It has been
used as an insulator for electrical passivation in preparation of devices for protein
detection. 40
Cl
H2C
CH2
n
Figure 1.2 Chemical structure of parylene C
In our study, parylene C is deposited on a substrate via CVD polymerization
while PEI is deposited via spin-coating. There are pros and cons with each of these
deposition processes.
Spin coating is a well-established method for preparing smooth polymeric
coatings on flat substrates. This technique is widely used in the microelectronics
11
industry. The polymer is first dissolved in a suitable solvent and applied onto a
substrate. By the rotation of the substrate at high speed, excess solution is ejected,
leaving a thin film which continues to flow radially outwards by the action of the
centrifugal force. As the film thins down, the solvent evaporates. The parameters
affecting film thickness are spin speed, volatility of solvent and initial polymer
concentration.41 Spin coating is very easy to use, and the cost of equipment is low. It
is relatively easy to control the film thickness by varying parameters mentioned above.
One disadvantage of spin coating is it requires the use of solvents and the choice of
solvent often must fulfill the following considerations: environmental issues,
miscibility, and its effects on the film properties.
Chemical vapour deposition (CVD) polymerization has gained substantial
interest in recent years as it forms polymer films in the absence of solvent and
produces conformal pinhole-free coatings. 2,2-Para-cyclophanes are examples of
CVD precursors for thin film polymers, commonly known as parylenes. Parylenes are
used in a wide range of applications such as automotive, medical, electronics and
semiconductor industries. Parylene coatings are inert and transparent and have
excellent barrier properties. CVD polymerization to yield parylene is an inherently
clean process as the monomer gas is directly converted into polymer without the need
for initiator or catalysts and produces linear high molecular weight polymer. Parylene
is a semicrystalline polymer with degrees of crystallinity and crystalline modifications
that are dependent on the deposition conditions.39, 42
The steps of CVD deposition of parylene consist of 1) the sublimation of
dimer in a sublimation furnace, 2) cracking the dimer into monomer in the pyrolysis
furnace, 3) transportation of the monomer into the deposition chamber, 4) diffusion of
monomer from the region above the substrate through a boundary layer, 5) adsorption
12
of monomer into the substrate, 6) surface migration and bulk diffusion of monomer,
and 7) chemical reaction that comprises propagation or initiation. There is no
termination reaction. During steady state growth, the density of radical chain ends on
the surface remains constant as the new radicals generated by initiation replace those
that are buried in the growing film.43
The advantages of CVD polymerization include the following: it is a
solventless process; can form structurally continuous, pinhole free and uniform films;
it can provide homogenous coating deposited simultaneously on flat surfaces, inside,
outside and in corners of deep crevices. However, the initial set up cost of CVD
equipment is much higher than for other types of deposition process.40
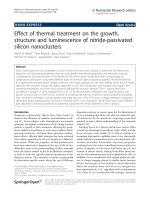
In Chapter 5, we will investigate the surface modification of parylene with an
attached amino group. The chemical structure as shown in Figure 1.3 will be
addressed as amino-parylene in this thesis. Usually amino-terminated molecular films
are used in the immobilization of enzymes, DNA, and in initiating graft
polymerization etc.44 In these applications, it is important that there is a sufficiently
high content of the reactive primary moieties exposed on the substrate surface so that
there is interaction with other molecules. Zhang et al
44
reported that there were
different immobilization capacities of the different aminosilane substrates for
pyromellitic dianhydride (PMDA). It was observed that the higher primary amine
content favoured a higher uptake of PMDA. They also reported that primary amine
content could be a measure of the film morphology and accessibility of the substrate
amine groups.44 In this work, we examine the influence of the thickness of the amino
terminated parylene films on their capacity for immobilization of pyromellitic
dianhydride (PMDA).
13
H2C
CH2
CH2
n
CH2
CH2
m
NH2
Figure 1.3 Structure of amino-parylene
14
Chapter 2
2.1
Characterization Techniques
Ellipsometry
Ellipsometry is a very sensitive measurement technique that uses polarized
light to characterize thin films, surfaces, and material microstructures. It derives its
sensitivity from the determination of the relative phase change in a beam of reflected
polarized light.
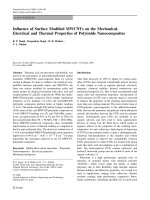
Figure 2.1 below illustrates the basic principle of ellipsometry. First, there is
an incoming polarized light. The incident beam and the direction normal to the
surface define a plane that is perpendicular to the surface which is known as the plane
of incidence. The interaction of the light with the sample causes a polarization change
in the light, from linear to elliptical polarization. The change in the shape of the
polarization is then measured by analyzing the light reflected from the sample. In
Figure 2.1, it shows that the amplitude of the electric wave which is in the plane of the
incidence as Ep and the amplitude of the electric wave which is perpendicular to the
plane of incidence as Es. These are also referred to as the p-waves and s-waves
respectively.
Figure 2.1 Schematic diagram of the principle of ellipsometry45
Ellipsometry measures two values, Ψ and ∆, which describes the polarization
15
change. Ψ is the relative phase difference of the polarizing light and ∆ is the relative
amplitude change. These values are related to the ratio of Fresnel reflection
coefficients, Rp and Rs for p- and s- polarized light, respectively.
p = tan(Ψ )e i∆ =
Rp
Eq. 2.1
Rs
where ψ is the angle whose tangent is the ratio of the magnitudes of the total
reflectance coefficient ( ratio of the outgoing wave amplitude to the incoming
amplitude) and p is the complex ratio of the total reflection coefficient.
As ellipsometry measures the ratio of two values, it can be highly accurate and
very reproducible. From measured quantities of Ψ and ∆, the thickness of the film can
be derived by a model fitting. The most commonly used approach to obtain film
thickness for transparent material is the Cauchy model. The Cauchy dispersion
relation is an inverse power series containing only even terms:
n(λ ) = A +
B
λ
2
+
C
λ4
+ ...
Eq. 2.2
where the wavelength λ is given in microns, n is the refractive index and A, B and C
are the fit parameters.45
Besides determining the thickness of the film, ellipsometry was used in this
project to determine the Tg of the polymer films.
2.1.1 Measurement of Film Thickness
Film thicknesses analysis was performed using a Variable Angle
Spectroscopic Ellipsometer VASE (J.A.Woollam Lincoln, NE). The Ψ and ∆ data at
angles 70° and 75° over wavelength range 500 to 1000nm were fitted using the
Cauchy model. Prior to measurements, the film thickness was first estimated by a
KLA Tencor-P10 surface profilometer.
16
The fitting of data was carried out by first assuming that the first layer or the
substrate layer is 0.6mm Si substrate while the next layer was included as Cauchy
layer. From the film thickness obtained from surface profilometer, an estimated value
of the thickness was entered. The values of A=1.7, B=0.001 and C=0.0001 which
were the values usually used for polymer films were used. Both n and k (extinction
coefficient) were first fitted. Once a good fit was obtained, n and k were then fixed
and the values of thickness, A, B and C were fitted to obtain the more accurate values.
2.1.2 Measurement of Glass Transition Temperature (Tg)
Tg and temperature/thickness dependence measurements were performed by
placing the supported film on a Linkam TMS 94 heating/cooling stage. The
ellipsometric angles (Ψ and ∆) were continuously recorded at 120s intervals. The
samples were heated and cooled at a constant rate of 2°C/min. Tg was determined
from the intersection of the best fit of 2 straight lines in the thickness versus
temperature curve.
2.2
Quartz Crystal Microbalance
Quartz crystal microbalance (QCM) is widely used in many applications in the
measurement of small masses due to their stability, simplicity of measurement, high
precision, high sensitivity and ease of analysis.
The frequency change relationship between rigid layers firmly attached to
QCM is proportional to the added mass as long as the added mass behaves elastically
similar to the quartz crystal itself. The relationship is given in Sauerbrey equation as
shown in Equation 2.3:
17
madded =
( f uncoated − f measured )
Cf
Eq. 2.3
where madded is film mass per unit area, funcoated and fmeasured are the resonance
frequencies of the bare crystal and crystal coated with film (dry), respectively and Cf
is a constant determined by the crystal used where it is calculated by Equation 2.4:
Cf =
2 f q2
( ρ qν q )
Eq. 2.4
Here, fq is the resonant frequency of the bare crystal, ρ q is the density of the quartz
crystal (2.649gcm-3) and ν q is the shear velocity of the AT cut quartz crystals
(332200cms-1). It is important that the Sauerbrey equation is only valid for thin films
that can be considered rigid masses. There are other assumptions that are necessary
for this expression to hold; e.g. the added mass must be evenly distributed over the
electrode, the added mass must be much less than the mass of the quartz crystal itself
and the mass is rigidly attached with no deformation from oscillatory motion of the
crystal.31, 46 The films prepared for this study meet the above requirements.
2.2.1 Measurement of Mass Change
A Maxtek research grade quartz crystal microbalance (RQCM) (PLO-10 phase
lock oscillator, 5MHz AT cut, Cr/Au polished quartz crystal, and 0.4cm2 active area)
was used to determine mass change. The various thicknesses of polymer were coated
on the quartz crystal and their mass changes were measured at room temperature.
For the study of mass changes as a function of temperature, the Parylene-C
coated crystal was allowed to reach equilibrium initially at room temperature. The
crystal resonance frequency was recorded at a rate of 2/min. After which the coated
crystal was heated on a Linkam TMS heating/cooling stage at 115°C at various time
intervals before measuring the frequency. The frequency shift was converted into
18
mass using Equation 2.3.
2.2.2 Measurement of Moisture Adsorption
Polyetherimide was spin-coated on the QCM crystal to obtain the desired
thickness. Initially, the polyetherimide coated crystal was allowed to reach
equilibrium in a low humidity chamber (Relative Humidity, RH: 20% ± 1%). The
sample was then transferred immediately to a high humidity chamber (RH: 95% ±
1%). The whole moisture sorption experiment was carried out at a constant
temperature of 25 ± 0.1°C. The crystal resonance frequency was recorded at a rate of
2/min. The frequency shift was converted into mass by Equation 2.3. The percentage
of moisture absorbed at steady state can be calculated by Equation 2.5.
Moisture( wt %) =
2.3
f dryfilm − f wetfilm
f uncoated − f dryfilm
× 100%
Eq. 2.5
Fourier Transform Infrared (FTIR) Spectroscopy
Infrared spectroscopy measures the vibrations of molecules. Each functional
group, or structural characteristic, of a molecule has a unique vibrational frequency.
The result is a unique molecular "fingerprint" that can be used to confirm the identity
of a sample.47
FTIR spectrum was obtained on a Perkin Elmer FTIR spectrometer 2000 using
a KBr disc with the respective thicknesses of polymer coated on it. A transmission
mode configuration was employed using 32 scans at a resolution of 4cm-1.
2.4
X-ray Photoelectron Spectroscopy (XPS)
Electron spectroscopy techniques measure the kinetic energy of electrons that
19
are emitted from matter as a consequence of bombarding it with ionizing radiation or
high energy particles. The simplest is the direct ionization of an electron from a
valence or inner shell. The kinetic energy, KE, of the ionized electron is equal to the
difference between the energy of the incident radiation, hν, and the binding energy or
ionization potential, BE, of the electron. This is illustrated in the equation: KE = hν BE. For a given atom, a range of BE values is possible, corresponding to the
ionization of electrons from the different inner and outer valence shells and these BE
values are characteristic for each element. Measurement of KE, and hence BE values,
provides a means of identifying the atoms.
XPS has been employed to be a powerful technique for determining
the energy levels in atoms and molecules. It has been used to probe the chemical shift
of the atom relative to the original molecule and hence obtain information of the
structure. This is due to the variation of the binding energies of electrons in a
particular atom due to the immediate environment of the atom and its charge or
oxidation state. The principal use is for studying surfaces as it is surface sensitive as it
probes at the top 2-5nm of the surface. It can be used as an analytical method for
detecting the elements (and functional groups) on the surface.
47
XPS measurements
were made on a VG Scientific ESCA-LAB-220i XL. The core level signals were
obtained at a takeoff angle of 90° with respect to the sample surface. All binding
energies (BE) were referenced to the C1s hydrocarbon peak at 285eV in order to
compensate for the surface charge effects. The spectra were fitted using the
Advantage software and the surface elemental stoichiometries were determined from
the fitted peak area ratios.
20
2.5
Time-of-Flight Secondary Ion Mass Spectrometry (TOF-SIMS)
Sputtering and ionization in SIMS are due to events caused by the impact of a
high velocity ion on a surface. This process is shown schematically in Figure 5. A
primary ion (Ar+) strikes the surface, r, with high energy. And this impact of the
primary ion causes sputtering of atoms and molecules from a film surface. These
sputtered particles include electrons, positive and negative ions. The secondary ions
sputtered from the surface are collected by a mass spectrometer and mass analysed.
Figure 2.2 Schematic diagram of SIMS sputtering process48
All of the ion formation processes in SIMS are known for other forms of mass
spectrometry. The difference is that several ion formation mechanisms may occur
simultaneously. The dominant ionization process may vary with the type of polymer
involved. One advantage of SIMS is that both positive and negative ions are formed,
often in comparable yields. Molecules having low ionization potentials will tend to
form positive ions and those with high electron affinities will form negative ions.48
21
In our experiment,
TOF-SIMS was
performed as a
confirmation
characterization tool with XPS as it is also a surface sensitive technique.
The measurements were performed on ION TOF SIMS IV. The polymer films
were coated on Si wafers. The samples were then analysed wth 25keV Ga+, rastered at
500 µm by 500 µm. Both positive and negative polarity spectrums were acquired at
600s.
2.6
X-ray Diffraction (XRD)
XRD has been in use for the fingerprint characterization of crystalline
materials and for the determination of their crystal structures.
X-rays are electromagnetic radiation of wavelength about 1Å. X-rays are
produced when high energy charged particles collide with matter. The electrons are
then slowed down or stopped by the collision and some of the lost energy is converted
into electromagnetic radiation. X-ray wavelength used is emitted by copper Kα,
λ=1.5418 Å.
Each crystalline phase has a characteristic pattern that can be used as a
fingerprint. The two variables are peak position (d-spacing) and intensity. In this
experiment, we will determine the peak position and the intensity of the
semicrystalline parylene film. 47
XRD of the amino parylene films was measured using a Bruker GADDS
diffractometer with CuKα radiation and a graphite monochromator (the accelerating
voltage: 40kV; applied current: 40mA). The measurements were carried out at room
temperature with the following parameters: scan range: 6~33°; scan time: 30min;
incident angle: 1°. Distance from the X-ray source to sample was 15cm using a
0.5mm double pinhole collimator.
22
2.7
Atomic Force Microscopy (AFM)
In AFM, the force sensing spring consists of a miniturised cantilever beam
clamped at one end and the probing tip at the other end. The atomic force microscope
(AFM) probes the surface of a sample with a sharp tip, a couple of microns long and
often less than 100Å in diameter. The tip is located at the free end of a cantilever that
is 100 to 200µm long. Forces between the tip and the sample surface cause the
cantilever to bend, or deflect. A detector measures the cantilever deflection as the tip
is scanned over the sample, or the sample is scanned under the tip. The measured
cantilever deflections allow a computer to generate a map of surface topography.49
AFM measurements were performed using an AFM Multimode instrument,
Digital Instruments, USA. Height images were acquired under ambient conditions in
tapping mode using a 0.01-0.025 Ohm-cm Antimony (n) doped Si; cantilever tip,
FIB2-100S (source of the tip).
2.8
Contact Angle Analysis
Contact angle, θ, is a quantitative measure of the wetting of a solid by a liquid.
It is probably the most common method of solid liquid tension. It is defined
geometrically as the angle formed by a liquid at the three phase boundary where a
liquid, gas and solid intersect as shown in Figure 2.3. The drop of liquid that is put on
the solid surface will modify the shape under the pressure of interfacial tensions. It
can be seen from this figure that low values of θ indicate that the liquid spreads, or
wets well, while high values indicate poor wetting. Typically, if the angle θ is less
than 90 the liquid is said to wet the solid. If it is greater than 90 it is said to be nonwetting. A zero contact angle represents complete wetting. 50
23
Figure 2.3 Contact angle measurement 50
Contact angle measurements were taken on Rame-Hart contact angle
goniometer to measure the surface hydrophobicity of the samples before and after
modification.
The system was first calibrated e to ensure the planarity of the sample stage.
Then the focal length was adjusted to ensure that the sample was focused. A drop of 3
µl of deionised water was dropped onto the sample and the contact angle was
measured immediately. This step was repeated for at least 5 times to obtain the
average contact angle value of the sample.
2.9
X-ray Specular Reflectometry (XSF)
High resolution X-ray Specular Reflectometry was used to measure film
densities. This measurement was carried by Dr.Yang Ping at the X-ray demonstration
and development (XDD) beamline at Singapore Synchrotron Light Source (SSLS).
The diffractometer is the Huber 4-circle system 90000-0216/0, with high-precision
0.0001° step size for omega and two-theta circles. The storage ring, Helios 2, was
running at 700 MeV, typically stored electron beam current of 300 mA. X-ray beam
was conditioned to select CuKα1 radiation (8.048 keV in photon energy) by a Si (111)
channel-cut monochromator (CCM) and blocked to be 0.80mm high in vertical
24
direction and 3.50mm wide in horizontal direction by a slit system. Such set-up
yielded x-ray beam with about 0.01° in divergence. The detector slit was adjusted to
be 1.00mm high to ensure recording all reflected photons. The typical counting time
was 5 second for every step and step size of theta varies from 0.02 to 0.0025° for
different samples to ensure that the oscillation in reflectivity was well recorded.
Diffuse scattering at rocking scan was also measured at some chosen 2-theta in
the range of above measurement. As it is much weaker, there is no need to correct raw
specular reflectivity by subtracting the diffuse scattering.
The simulations were done using simulating software M805 and LEPTOS 1.07
release 2004 (Bruker). The critical angles for parylene layer and Si-substrate (0.223°)
are well fitted, the former indicating the density of parylene layer directly. LevenbergMarquardt algorithm for least-square refinement on logarithm of data can be done for
all samples. Layer parameters are listed in above table. The trends and oscillating
finer structure in the reflectivity were also fitted well. Final χ2-values are below
2.72G10-2.
The trends and oscillating finer structure in the reflectivity were fitted well.
The layer densities were also obtained from full-profile fitting and can also be seen
obviously from the critical angles. Native SiO2 layers between Si-substrates and
parylene layers do not play roles or can be described as the interface roughness.
25