Ethnic differences in the effect of parity on breast cancer incidence in premenopausal women in singapore
Bạn đang xem bản rút gọn của tài liệu. Xem và tải ngay bản đầy đủ của tài liệu tại đây (3.75 MB, 118 trang )
ETH N I C
D IFF E RE N CE S
I N
T HE
E FFE CT
OF
P A RITY
O N
B REAS T
CA N C ER
I NCI DE N CE
I N
PRE ME N OPA U S AL
WO ME N
IN
S INGA PO R E
YAP
P EN G
LE N G
KA RE N
(MBBS(Singapore),
FRCS(Edinburgh),
FRCS(Glasgow),
FAMS(General
Surgery))
A
THES IS
S UB MI T TE D
FO R
T HE
DEG RE E
O F
MA STE R
O F
SC IE N CE
DE PA R TME NT
O F
EP IDE MIOL OG Y
A ND
PU BL IC
HE AL T H
NA TIO NA L
U NIV ER SI TY
OF
S ING AP O RE
2009
1
ACK NO WL E DG E ME N TS
This
project
and
thesis
would
not
have
come
to
fruition
if
not
for
the
contributions
and
assistance
received
from
the
following:
My
supervisor
Professor
Chia
Kee
Seng
for
the
invaluable
instruction
and
direction of the project, from its conceptualization through to the completion of
this thesis;
Helena Verkooijen and Cheung Kwok Hang who have been instrumental in
retrieving and sorting the data from the registries;
Professor Soo Khee Chee and Professor London Lucien Ooi who inspired me
towards pursuing this course in the first place and
Dr Ann Lee for guiding me through the rigors of laboratory research.
In addition, I must not fail to mention my understanding husband and parents
who took turns to mind the little ones in order to give me uninterrupted time to
work.
i
TA BLE O F CO NTE N TS
ACKNOWLEDGEMENTS ......................................................................................................... I
TABLE OF CONTENTS............................................................................................................ II
SUMMARY.............................................................................................................................V
A
INTRODUCTION .................................................................................................................V
B
OBJECTIVES ......................................................................................................................V
C
MATERIALS AND METHODS................................................................................................V
D
RESULTS ......................................................................................................................... VI
E
DISCUSSION .................................................................................................................... VI
LIST OF TABLES ................................................................................................................... VII
LIST OF FIGURES .................................................................................................................. IX
LIST OF PRESENTATIONS AND PUBLICATIONS FROM THIS STUDY .................................. XI
MAIN BODY OF THESIS........................................................................................................ 1
1
INTRODUCTION .......................................................................................................... 1
2
LITERATURE REVIEW .................................................................................................. 2
2.1
BREAST CANCER WORLDWIDE: DIFFERENCES IN INCIDENCE ............................................. 2
2.2
FACTORS PREDISPOSING TO BREAST CANCER ................................................................. 5
2.2.1 BIOLOGICAL FACTORS .................................................................................................. 5
2.2.2 HORMONAL FACTORS ................................................................................................ 14
2.2.3 ENVIRONMENTAL FACTORS ........................................................................................ 19
2.3
ETHNIC DIFFERENCES IN BREAST CANCER RISK F ACTORS ............................................... 25
2.3.1 ETHNIC DIFFERENCES IN BREAST CANCER INCIDENCE ..................................................... 25
2.3.2 ETHNIC DIFFERENCES IN REPRODUCTIVE RISK FACTORS FOR BREAST CANCER ................... 27
2.3.3 ETHNIC DIFFERENCES IN CLINICAL FEATURES OF BREAST CANCER .................................... 29
2.3.4 ETHNIC DIFFERENCES IN BREAST CANCER MORTALITY.................................................... 30
2.4
EPIDEMIOLOGY OF BREAST CANCER IN SINGAPORE ....................................................... 32
2.4.1 SINGAPORE POPULATION DEMOGRAPHICS AND ETHNIC DIVERSITY ................................. 32
2.4.2 INCIDENCE OF BREAST CANCER IN SINGAPORE.............................................................. 32
2.4.3 TRENDS IN BREAST CANCER INCIDENCE ....................................................................... 32
2.4.4 ETHNIC DIFFERENCES IN BREAST CANCER TRENDS ........................................................ 35
2.4.5 ETHNIC DIFFERENCES IN AGE‐SPECIFIC INCIDENCE ........................................................ 36
ii
2.4.6 FERTILITY RATES ....................................................................................................... 37
2.5
CLINICAL ASPECTS OF BREAST CANCER ........................................................................ 41
2.5.1 CLINICAL PRESENTATION ............................................................................................ 41
2.5.2 STAGING OF BREAST CANCER ..................................................................................... 41
2.5.3 BREAST CANCER TREATMENT ..................................................................................... 41
3
OBJECTIVES OF STUDY ............................................................................................. 42
4
MATERIALS AND METHODS..................................................................................... 43
4.1
DATA S OURCES ......................................................................................................... 43
4.1.1 THE SINGAPORE NATIONAL REGISTRY OF BIRTHS AND DEATHS (SNRBD) ....................... 43
4.1.2 THE SINGAPORE CANCER REGISTRY (SCR) ................................................................... 43
4.2
ETHICS APPROVAL ..................................................................................................... 44
4.3
LINKAGE OF DATA ..................................................................................................... 44
4.4
STUDY COHORT ........................................................................................................ 44
4.5
DEFINITIONS ............................................................................................................. 45
4.6
DATA ANALYSIS ........................................................................................................ 45
5
RESULTS
.................................................................................................................... 47
5.1
THE SINGAPORE NATIONAL REGISTRY OF BIRTHS AND DEATHS (SNRBD) 1986‐2002 ..... 47
5.2
DESCRIPTION OF STUDY POPULATION .......................................................................... 50
5.2.1 ETHNIC DISTRIBUTION ............................................................................................... 50
5.2.2 PARITY ..................................................................................................................... 50
5.2.3 AGE AT FIRST BIRTH .................................................................................................. 51
5.2.4 AGE AT LAST BIRTH .................................................................................................. 52
5.2.5 FOLLOW‐UP ............................................................................................................. 53
5.2.6 BREAST CANCERS ...................................................................................................... 54
5.2.7 AGE AT CANCER DIAGNOSIS ....................................................................................... 54
5.2.8 DURATION BETWEEN LAST BIRTH BEFORE CANCER AND BREAST CANCER DIAGNOSIS ........ 54
5.2.9 DURATION BETWEEN FIRST BIRTH AND CENSOR DATE................................................... 55
5.2.10
5.3
MOTHERS WHO HAD CHILDREN AFTER BREAST CANCER ............................................. 56
ETHNIC DIFFERENCES IN REPRODUCTIVE RISK FACTORS FOR BREAST CANCER ................... 57
5.3.1 AGE AT FIRST BIRTH AND BREAST CANCER RISK ............................................................ 57
5.3.2 AGE AT LAST BIRTH AND BREAST CANCER RISK............................................................. 59
5.3.3 PARITY AND BREAST CANCER RISK .............................................................................. 59
5.3.4 EFFECT OF ETHNICITY ON BREAST CANCER RISK ............................................................ 59
5.3.5 EFFECT OF ETHNICITY AND PARITY ON BREAST CANCER RISK .......................................... 60
iii
6
DISCUSSION .............................................................................................................. 65
6.1
SUMMARY OF MAIN F INDINGS ................................................................................... 65
6.2
WHAT OTHER STUDIES HAVE FOUND ........................................................................... 66
6.3
POSSIBLE EXPLANATIONS FOR THE F INDINGS ................................................................ 67
6.3.1 TRANSIENT POST‐PREGNANCY RISE IN BREAST CANCER RISK.......................................... 67
6.3.2 BREAST‐FEEDING PRACTICES ...................................................................................... 67
6.3.3 BODY MASS INDEX .................................................................................................... 67
6.3.4 AGE AT FIRST BIRTH .................................................................................................. 68
6.3.5 HORMONAL RECEPTOR SUBTYPE ................................................................................ 69
6.3.6 ALPHA FETOPROTEIN ................................................................................................ 69
6.4
STRENGTHS OF S TUDY ............................................................................................... 70
6.5
LIMITATIONS OF STUDY.............................................................................................. 72
7
CONCLUSION ............................................................................................................ 73
8
BIBLIOGRAPHY.......................................................................................................... 74
APPENDICES ....................................................................................................................... 90
APPENDIX A DEFINITIONS USED ....................................................................................... 90
APPENDIX B ABBREVIATIONS ........................................................................................... 91
APPENDIX C LIST OF VARIABLES IN DATASET ...................................................................... 92
APPENDIX D COMMANDS USED IN STATA ........................................................................ 93
APPENDIX E ETHICS APPROVAL ........................................................................................ 99
APPENDIX F PUBLICATION ............................................................................................. 101
iv
SUM M A RY
A
Introdu c tion
The effect of risk factors for breast cancer development is known to be modified
by ethnicity. Differences in the effect of multiparity on breast cancer risk have
been shown in to exist in Caucasian, African-American and Hispanic women.
Studies in Asian populations are lacking. A literature review on the subject was
done.
B
Obje cti ve s
This thesis proposes that there are ethnic differences in the effect of multiparity
on breast cancer incidence in pre-menopausal women in the three major ethnic
groups in Singapore.
C
Ma teri als a nd M et hod s
Through the Singapore National Registry of Births and Deaths, women who had
a first childbirth in the years1986-2002 were linked with the Singapore Cancer
Registry to ascertain if they had breast cancer. The study dataset comprised
228,419 mothers, of whom 523 had breast cancer. Multivariate Cox analysis was
used. The relationship between ethnicity, parity and premenopausal breast
cancer risk was examined, adjusted for age at first and last childbirth.
v
D
Re sul t s
Our results show that the effect of parity on breast cancer risk is modified by
ethnicity. The risk in uniparous Malay women was higher than that of uniparous
Chinese (hazard ratio[HR] 1.91 relative to Chinese, 95% confidence interval [CI]
1.17-3.13), whereas Indians had a lower risk (HR 0.38, 95% CI 0.12-1.19). In
Chinese and Indian women, multiparity had no effect on breast cancer risk. In
contrast, Malay women had a significant risk reduction with increasing parity (2
children: HR 1.82 relative to uniparous Chinese, 95% CI 1.21-2.73; ≥3
children: HR 1.16, 95% CI 0.73-1.85).
E
Di scussi on
This is the first study to show that the effect of multiparity on premenopausal
breast cancer risk is modified by ethnicity in three Asian ethnic groups. Further
studies are needed with detailed prospective collection of information in order to
confirm these findings and explain the underlying mechanisms for the observed
differences.
vi
LIS T O F TABL ES
TABLE 1. AGE-STANDARDIZED INCIDENCE RATES AND DEATH RATES FOR BREAST CANCER IN
SELECTED COUNTRIES ..................................................................................................................3
TABLE 2. BREAST CANCER RISK FACTORS. .......................................................................................6
TABLE 3. AGE-ADJUSTED BREAST CANCER INCIDENCE RATES IN USA BY ETHNICITY................25
TABLE 4. TOTAL FERTILITY RATES IN WOMEN IN SINGAPORE 1955-2007. ..................................37
TABLE 5. NUMBER OF BIRTHS IN SINGAPORE BY CALENDAR YEAR...............................................47
TABLE 6. BIRTH ORDER OF OLDEST CHILD REGISTERED IN THE BIRTH REGISTRY IN THE PERIOD
1986-2002..................................................................................................................................48
TABLE 7. PARITY AND ETHNICITY OF THE 228,419 MOTHERS IN THE BIRTH REGISTRY.............50
TABLE 8. PARITY STATUS (UNIPAROUS VS MULTIPAROUS) OF THE 228,419 MOTHERS
ACCORDING TO ETHNICITY. ........................................................................................................51
TABLE 9. AGE AT BIRTH OF FIRST CHILD ACCORDING TO ETHNICITY OF THE 228,328 WOMEN. 51
TABLE 10. AGE AT BIRTH OF FIRST CHILD ACCORDING TO PARITY OF THE 228,328 WOMEN.....51
TABLE 11. CATEGORIZING AGE AT FIRST BIRTH BY ETHNICITY IN THE 228,328 WOMEN............52
TABLE 12. AGE AT BIRTH OF LAST CHILD AND ETHNICITY OF THE 228,328 WOMEN. ..................52
TABLE 13. AGE AT BIRTH OF THE LAST CHILD ACCORDING TO PARITY OF THE 228,328 WOMEN.
......................................................................................................................................................52
TABLE 14. AGE AT WHICH CANCER WAS DIAGNOSED IN THE 523 WOMEN WHO DEVELOPED
BREAST CANCER . ........................................................................................................................54
TABLE 15. DURATION BETWEEN BIRTH OF FIRST CHILD AND DATE OF CENSORING IN THE
228,369 WOMEN. .......................................................................................................................56
TABLE 16. MODELLING AGE AT FIRST BIRTH AND BREAST CANCER RISK, UNADJUSTED AND
ADJUSTED FOR AGE AT LAST BIRTH AND PARITY, ACCORDING TO ETHNIC GROUP . ..............58
TABLE 17. BREAST CANCER RISK WITH ETHNIC GROUP INCLUDED IN THE MODEL. .....................60
TABLE 18. BREAST CANCER RISK, PERSON-YEARS AND ADJUSTED HAZARD RATIOS, STRATIFIED
BY ETHNIC GROUP AND PERIOD OF DIAGNOSIS. .......................................................................61
TABLE 19. BREAST CANCER RISK, PARITY AND ETHNICITY, WITH C HINESE WOMEN AS THE
REFERENCE GROUP....................................................................................................................62
vii
TABLE 20. BREAST CANCER RISK, PARITY AND ETHNICITY, WITH UNIPAROUS CHINESE WOMEN
AS THE REFERENCE GROUP. ......................................................................................................64
viii
LIS T O F FIG U R ES
FIGURE 1. AGE-ADJUSTED BREAST CANCER INCIDENCE RATES FOR SELECTED COUNTRIES ...... 4
FIGURE 2. AGE-SPECIFIC BREAST CANCER INCIDENCE RATES IN SELECTED COUNTRIES ........... 7
FIGURE 3. AGE-ADJUSTED INCIDENCE OF BREAST CANCER ACCORDING TO ETHNICITY IN THE
USA, BASED ON SEER DATA 1975-2004 ..............................................................................26
FIGURE 4. AGE-ADJUSTED BREAST CANCER MORTALITY RATES FOR SELECTED COUNTRIES ...30
FIGURE 5. AGE-ADJUSTED BREAST CANCER MORTALITY ACCORDING TO ETHNICITY IN USA
BASED ON SEER DATA 1975-2004 .........................................................................................31
FIGURE 6. AGE-STANDARDIZED INCIDENCE RATES OF FEMALE BREAST CANCER IN SINGAPORE
1968-2002 ..................................................................................................................................33
FIGURE 7. AGE-SPECIFIC INCIDENCE OF FEMALE BREAST CANCER IN SINGAPORE 1968-1992
BY BIRTH COHORT .......................................................................................................................34
FIGURE 8: AGE-SPECIFIC INCIDENCE RATE OF BREAST CANCER IN SINGAPORE WOMEN SEEN IN
TIME PERIODS 1993-1997 AND 1998-2002, SHOWING A SHIFT IN THE PEAK INCIDENCE
AGE GROUP ..................................................................................................................................34
FIGURE 9. AGE-STANDARDIZED INCIDENCE RATES OF FEMALE BREAST CANCER IN SINGAPORE
FROM 1968-2002, STRATIFIED BY ETHNIC GROUP
.................................................................36
FIGURE 10. AGE-SPECIFIC FEMALE BREAST CANCER INCIDENCE RATES IN SINGAPORE FROM
1968-2002, STRATIFIED BY ETHNICITY ....................................................................................37
FIGURE 11. TOTAL FERTILITY RATES IN WOMEN IN SINGAPORE 1957-2001 ..............................37
FIGURE 12. TOTAL FERTILITY RATES IN WOMEN IN SINGAPORE 1968-2002, STRATIFIED BY
ETHNICITY ....................................................................................................................................38
FIGURE 13. TOTAL FERTILITY RATE (PER WOMAN) AND AGE-STANDARDISED INCIDENCE RATE
OF BREAST CANCER (PER 10,000 WOMEN PER YEAR) IN SINGAPORE, BASED ON DATA IN
TABLE 4 AND SINGAPORE C ANCER R EGISTRY DATA ..............................................................39
FIGURE 14. SCATTERPLOTS OF CUMULATIVE BREAST CANCER INCIDENCE RATES AND TOTAL
FERTILITY BY ETHNICITY. ............................................................................................................40
FIGURE 15. DESIGN OF STUDY BASED ON INFORMATION AVAILABLE IN THE SINGAPORE
NATIONAL REGISTRY OF BIRTHS AND DEATHS. ......................................................................44
FIGURE 16. DISTRIBUTION OF DURATION BETWEEN BIRTH OF LAST CHILD AND DEVELOPMENT
OF BREAST CANCER, STRATIFIED BY ETHNIC GROUP. .............................................................55
ix
FIGURE 17. BREAST CANCER RISK, PARITY AND ETHNICITY, WITH CHINESE WOMEN AS THE
REFERENCE GROUP....................................................................................................................63
FIGURE 18. BREAST CANCER RISK, PARITY AND ETHNICITY, WITH UNIPAROUS CHINESE WOMEN
AS THE REFERENCE GROUP. ......................................................................................................64
x
LIS T O F P RE SE N TA TI O NS A ND P UB LICA TIO NS FR O M T HIS
STU DY
1.
Verkooijen HM, Yap K, Chia KS.
Multiparity and the Risk of Pre-menopausal Breast Cancer: Different Effects
Across Ethnic Groups in Singapore. The Lancet Asia Medical Forum 2007. 21-22
April 2007
2.
Verkooijen HM, Yap KP, Bhalla V, Chow KY, Chia KS.
Multiparity and the risk of premenopausal breast cancer: different effects across
ethnic groups in Singapore. Breast Cancer Res Treat. 2009; 113(3): 553-8.
xi
xii
MA I N BO D Y OF T HE SIS
1
IN TR O D UC TIO N
Breast cancer incidence in Singapore is rising. We have noticed over the past years
of treating breast cancer that there are differences amongst the ethnic groups. This
thesis proposes that there are ethnic differences in the effect of parity on breast
cancer incidence in pre-menopausal women in Singapore. An extensive literature
review of the subject sets the background for our paper.
1
2
LI TE RA TU RE RE VIE W
Brea st Ca ncer World wid e: Differe nc e s in Incid en ce
2.1
Breast cancer is the most common cancer in women worldwide (1). According to
World Health Organization (WHO) statistics, it is the most common cancer worldwide
in women with slightly over a million new cases of breast cancer detected each year
(2). There are approximately 548,000 deaths from breast cancer each year around
the world, making it the fifth leading cause of cancer deaths after cancers of the lung
(1.4 million deaths/year), stomach (866,000 deaths), liver (653,000 deaths), and
colon (677,000 deaths) (1).
Breast cancer incidence is highest in the developed countries. From the International
Agency for Research on Cancer (IARC) 2002 estimates, the more developed
countries had an overall world age-standardized rate of 67.8 per 100,000/year as
compared to a rate of 23.8 in the less developed countries (3). In the United States
alone, the age-adjusted incidence rate was 126.1 per 100,000 women per year from
2001-2005 (4). The incidence and death rate estimates of several countries obtained
from the WHO estimates are listed in Table 1 (5):
2
Countr y
Argentina
Br east Canc er W orl dwi de
AgeAge- St andar di z ed
St andar di z ed
Deat h R at e ( per
Inc i denc e R at e
100, 000)
(per 100, 000)
(y ear of esti mat e)
(y ear of
esti mat e)
46 (2002)
25 (2005)
Australia
67 (2002)
18 (2005)
Bangladesh
25 (2002)
16 (2005)
Brazil
34 (2005)
18 (2005)
106 (2005)
21 (2005)
China
14 (2005)
8 (2005)
Denmark
77 (2002)
28 (2005)
France
72 (2002)
23 (2005)
India
25 (2005)
16 (2005)
Japan
38 (2002)
9 (2005)
Malaysia
38 (2002)
23 (2005)
Netherlands
81 (2002)
28 (2005)
Sweden
55 (2002)
18 (2005)
United Kingdom
75 (2005)
26 (2005)
103 (2002)
19 (2005)
17 (2002)
8 (2005)
Canada
United States
Zimbabwe
TABLE 1. Age-standardized incidence rates and death rates for breast cancer in
selected countries. (5)
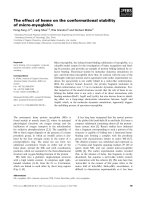
Even though incidence rates differ between countries, over the past three decades
there has been a consistent increase in incidence rates worldwide of a magnitude of
30-40% (6). Althuis et al (6) illustrated this elegantly in Figure 1.
3
FIGURE 1. Age-adjusted breast cancer incidence rates for selected countries. (6)
However, after year 2000, a slight decrease in breast cancer incidence has been
observed, which will be described further in section 2.3.1.
In Singapore, breast cancer is the most common incident cancer in females. In the
period 1998-2002, the world age-standardised incidence rate was 54.9 per
100,000/year (7). Similar to trends worldwide, breast cancer incidence in Singapore
has also been steadily rising. This is discussed in greater detail in section 2.4.
4
2.2
Fa ct or s Predi sp osi ng to Br ea st Can c er
Breast cancer is a multi-factorial disease. Table 2 summarizes some of the factors
that influence the predisposition to breast cancer, either acting individually or in
concert with other factors.
2.2 .1
Biologi cal Fa ctor s
Gender
Breast cancer is 100 times more common in women. Breast cancer in men
comprises less than 1% of all breast cancers. In Singapore, there were 5500 new
breast cancer cases in females in 1998-2002 compared with only 23 in males during
the same period (7).
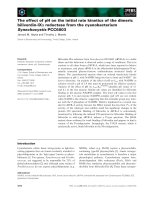
Age
The breast cancer age-specific incidence rate rises rapidly a decade before
menopause. After menopause, rates plateau in most populations, as shown in Figure
2 from Bray et al (8).
5
Risk Fact or
Biological Factors
Gender
Age
Genetics
Height
Birth Weight
Birth Order
Mammographic Density
Premalignant Pathology
Cancer in Other Breast
Hig h Ris k Gro u p
Rel ative Risk
Female
Elderly
Mutation gene carriers
Tall
≥4 kg
Lower order
≥75%
Atypical Hyperplasia
Present
100
>10
10
1.02-1.07
1.24
1.1
4.6
4-5
5
3
Menarche
Highest quintile of plasma
oestradiol levels
Early menarche
Menopause
Late menopause
Parity
Age at First Childbirth
Breastfeeding
Nulliparous
Age ≥35
Women who do not breastfeed
Hormone Replacement
Therapy
Oral Contraceptives
Fertility Treatment
Abortions
Current Users
10% risk reduction for every 2
years delay in menarche
17% increase in risk for every 5
years delay in menopause
1.35
1.5
4.3% risk reduction for every 12
months of breastfeeding
1.35
Current Users
No difference
No difference
1.2
1
1
2
Alcohol
Multivitamin Intake
Obesity
Soy Intake
Ionizing Radiation
Current Smokers who are
BRCA1/BRCA2 carriers
No difference
No difference
BMI >28 kg/m2
≤5 mg isoflavones/day
Exposure
Physical Activity
Reduced
Hormonal Factors
Endogenous Hormones
Environmental Factors
Smoking
1
1
1.26
1.4
Varies with dose and age of
exposure
1.2
TABLE 2. Breast cancer risk factors. Relative risks are derived from supporting
references quoted in the text.
6
FIGURE 2. Age-specific breast cancer incidence rates in selected countries. (8)
In Singapore, based on 1998-2002 data, the age-specific incidence rates in women
aged 50-54 are almost twice that of women aged 40-44 (7).
The effect of risk factors on breast cancer varies with age. The following factors
reduced the risk of early onset breast cancer but increased the risk of later onset breast cancers
— nulliparity, obesity and oral contraceptive use (9; 10; 11). Similarly, differences were
also noted in tumour characteristics (12; 13) and survival (13) between age groups.
Tumours were classified as high risk if they were >2cm, estrogen receptor negative
(ER-), node positive and high grade. These high risk tumours were found to have an
early onset and were associated with a worse actuarial survival and a peak in hazard
at 2 years after cancer diagnosis, whereas later onset tumours had a better survival
and did not exhibit the hazard peak (13). This qualitative age-interaction effect
suggests that breast cancers occurring in younger and older women may be different
entities (12).
Genetics
7
Hereditary breast cancers account for 5-10% of all incident breast cancers. The two
major genes implicated in hereditary breast cancer are the tumour suppressor genes
BRCA1 and BRCA2. BRCA1 was identified in 1991 (14) and cloned in 1994 (15).
This was followed by the identification of BRCA2 in 1995 (16). Mutations in these
genes are more common among Ashkenazi Jewish women, where the population
frequency of the common founder mutations is estimated to be 2.5% (17; 18). In
carriers, the lifetime risk of breast cancer was estimated to be as high as 85% (19).
However, some studies report a much lower risk estimate of 40%-56% by age 70
(20; 21).
Besides the BRCA genes, which have a low population frequency but a high
penetrance in carriers, studies are beginning to detect various breast cancer
susceptibility genes which are more common but exert a smaller effect on risk. The
Breast Cancer Association Consortium, an international collaboration, studied 16
putative single nucleotide polymorphisms (SNPs) previously reported in smaller
studies to affect breast cancer risk (22). Eighteen studies were pooled, with a total of
between 12,013 to 31,595 subjects (cases and control) for each SNP studied. Small
associations with breast cancer were found for 5 SNPs (CASP8 D302H, IGFBP3 −
202 c > a , PGR V660L, SOD2 V16A, and TGFB1 L10P). Further evaluation of 4 of
these SNPs and another 5 SNPs (comprising 11,391–18,290 cases and 14,753–22,670
controls) showed significance of the CASP8 D302H and TGFB1 L10P variants,
estimated to attribute 0.3% and 0.2% towards familial breast cancer risk (23).
As more large-scaled studies are done in this field, it is likely that other SNPs will be
identified in future.
Height
Height has a positive association with breast cancer risk. An earlier study in Norway
of 570,000 women had shown that, within each age group, the risk was highest in the
tallest women (24). In a large pooled analysis of 7 studies with a total of 337,819
women and 4,385 incident invasive breast cancers, height was found to have a
8
positive association with breast cancer (25).In premenopausal women, a relative risk
of 1.02 was observed with every 5 cm height increment; in post-menopausal women
the relative risk was 1.07.
The age at which maximum height is reached is an indicator of the age at which the
pubertal growth spurt occurs. Earlier age has been found to be associated with
increased risk, particularly of more aggressive tumour types (26) and of ductallobular carcinoma but not ductal or lobular carcinoma (27).
9
Birth weight
The role of intrauterine factors in the aetiology of breast cancer was suggested by the
observation that the initially low breast cancer risk in Asian migrants gradually
increased over several generations to become at par with the majority Caucasian
population in USA (28). Although initial studies did not reveal any relationship
between birth weight and breast cancer risk (29; 30), these studies were limited by
small sample sizes.
A large case-control study nested within the two Nurses Health Studies showed an
increased adjusted odds of breast cancer in women whose birth weights were higher
(31). Park et al (32) showed in a meta-analysis that the odds of breast cancer was
1.24 with birth weights of ≥4000g (95% CI 1.04-1.48) and 1.15 (95% CI 1.04-1.26)
for birth weights 3500-3599g, with respect to the reference group of 2500-2999g.
The underlying mechanisms of this birth weight-breast cancer association are
currently unclear. A possible explanation is the effect of intrauterine exposures to
factors with mammotrophic and growth hormone-like effects.
Birth Order
In the meta-analysis of the relationship between birth order and breast cancer risk
(32), it was found that higher birth orders were associated with a reduced breast
cancer risk, although the relationship was only seen in higher birth orders or ≥5
(odds ratio [OR] 0.88, 95% CI 0.75-1.01). However, additional evidence to support
this is lacking.
Mammographic Density
Mammographic density is a reflection of the amount of fibroglandular tissue in the
breast, which is radiodense. A small study found that ductal carcinoma-in-situ arose
in pre-existing areas of mammographically dense tissue (33). This suggests that
epithelial proliferation occurs in radiodense regions of the breast.
10
Over the past 30 years, over 50 studies have been performed evaluating
mammographic density and breast cancer risk (34). In a meta-analysis, increased
mammographic density was associated with increased breast cancer risk (35). This
association also showed a dose-response relationship. When compared with breast
density of <5%, the pooled relative risk of breast cancer was 1.78, 2.46, 3.02 and
4.59 with densities of 5-24%, 25-49%, 50-74% and ≥75% respectively, after
adjusting for age and body size (total cases:non-cases 3004:6468).
Mammographic density has been shown to correlate with known risk factors for
breast cancer, including menarche, age at first full-term birth, parity and
premenopausal status, supporting the theory that these factors may be associated
with one another in breast cancer pathogenesis (36).
Although this effect of mammographic density was seen across different ethnic
groups, the magnitude of risk differed with ethnicity (37). Compared to whites, the
association was stronger in Asian-Americans and weaker in African-Americans (38).
The weaker association seen in African-American women could be related to their
larger breast size, as the relationship between mammographic density and breast
cancer risk appears to be weaker in women with larger breasts (39).
Premalignant Pathology
The relationship between benign pathology on breast biopsies and subsequent risk
of cancer development has been extensively studied by Page and Dupont (40; 41).
Lesions were classified as non-proliferative, proliferative without atypical hyperplasia
and atypical hyperplasia. Women with proliferative lesions without atypical
hyperplasia had 1.5 to 2 times the risk of cancer compared to the general population
(women with non-proliferative lesions) (42; 40). The risk was 4-5 times with atypical
hyperplasia (40; 41; 42). This risk was further exacerbated if these women with
atypical hyperplasia had a family history of breast cancer in a first degree relative – the
risk was 9.7 for atypical ductal hyperplasia (95% CI 4.7-20) and 8.4 (95% CI 3.5-20)
(41).
11
Strategies to reduce the cancer risk in women with atypical hyperplasia include
chemoprevention and prophylactic surgery. Tamoxifen was the first drug proven to
reduce breast cancer risk in women at high risk (43; 44). A more recent trial has
shown that raloxifene is as effective as tamoxifen for chemoprevention when used in
post-menopausal women (45). However, currently there is no data as to whether
chemoprevention improves survival.
12