the effect of ph, dark – light cycle and light colour on the chlorophyll and carotenoid production of spirulina sp.
Bạn đang xem bản rút gọn của tài liệu. Xem và tải ngay bản đầy đủ của tài liệu tại đây (464.59 KB, 28 trang )
MINISTRY OF EDUCATION & TRAINING
CAN THO UNIVERSITY
BIOTECHNOLOGY RESEARCH & DEVELOPMENT INSTITUTE
SUMMARY
BACHELOR OF SCIENCE THESIS
THE ADVANCED PROGRAM IN BIOTECHNOLOGY
THE EFFECT OF pH, DARK – LIGHT CYCLE
AND LIGHT COLOUR ON THE CHLOROPHYLL
AND CAROTENOID PRODUCTION OF
SPIRULINA SP.
SUPERVISOR:
Ass. Prof. NGUYEN HUU HIEP
STUDENT:
NGUYEN THI HUYNH NHU
Student Code: 3082618
Session: 34 (2008 - 2013)
APPROVAL
SUPERVISOR
Ass. Prof. NGUYEN HUU HIEP
STUDENT
NGUYEN THI HUYNH NHU
Can Tho, May 2013
PRESIDENT OF EXAMINATION COMMITTEE
ii
ABSTRACT
Spirulina sp., multicellular filament algae, is helically
coiled. This is a rich nutrition microalgae with protein,
carbohydrate, vitamin, chlorophyll and carotenoid. Many
researches and applications of Spirulina sp. have been studied by
interested scientist, especially, pigment production. The purpose
of this research was determination the effect of pH, dark – light
cycle and light colour on the growth and pigment production of
Spirulina sp. The results showed that pH = 9, white light and
continuous illumination 24/24 hours were appropriate conditions
for biomass increasing, chlorophyll a, chlorophyll b and
carotenoid production in Spirulina sp.
At pH = 9, biomass and carotenoid were highest in day 8
(0.16 g/ 50 mL and 1.43 µg/mL, respectively), the highest
production of chlorophyll a and chlorophyll b were collected in
day 12 (2.72 µg/mL and 3.35 µg/mL). The growth of Spirulina sp.
was slow at green colour and limited at red colour.
Compared to 12/24 hour illumination, growing algae under
continuous illumination 24/24 hour was higher 1.08 times in
biomass, 2.36 times in chlorophyll a, 1.2 times in chlorophyll b
and 1.7 times in carotenoid. When white light was applied,
continuous illumination 24/24 hour and aeration, pH remained
from 10 to 10.8, decreased in day 16 and 20 and no significant
differences between treatments during the experiment. Besides,
Spirulina algae recovered quickly in appropriate conditions.
Key words: biomass, carotenoid, chlorophyll a, chlorophyll
b, Spirulina sp.
i
CONTENTS
APPROVAL
ABSTRACT ............................................................................... i
CONTENTS ............................................................................... ii
1. INTRODUCTION.................................................................. 1
1.1 Introduction....................................................................... 1
1.2 Objectives ........................................................................ 2
2. MATERIALS AND METHODS ........................................... 3
2.1 Materials ........................................................................... 3
2.1.1 Time and location ...................................................... 3
2.1.2 Tools and equipments ................................................ 3
2.2 Methods ............................................................................ 3
2.2.1 Microalgae biomass increasing, chlorophyll and
carotenoid extraction method ............................................. 3
2.2.2 Study the effect of pH on Spirulina sp. chlorophyll
and carotenoid production .................................................. 5
2.2.3 Study the effect of light colour on Spirulina sp.
chlorophyll and carotenoid production................................ 5
2.2.4 Study the effect of dark – light cycle on Spirulina sp.
chlorophyll and carotenoid production ............................... 6
2.2.5 Study the growth recovering of Spirulina sp. ............. 6
2.2.6 Data analysis method ................................................. 6
3. RESULTS AND DISCUSSIONS ........................................... 7
ii
3.1 The effect of pH on Spirulina sp. chlorophyll
and carotenoid production .................................................... 7
3.2 The effect of light colour on Spirulina sp. chlorophyll and
carotenoid production........................................................... 9
3.3 The effect of dark – light cycle on Spirulina sp.
chlorophyll and carotenoid production ............................... 13
3.4 The growth recovery of Spirulina sp. ............................ 18
CONCLUSIONS AND SUGGESTIONS ............................. 20
4.1 Conclusions.................................................................. 20
4.2 Suggestions .................................................................. 20
REFERENCES ..................................................................... 21
iii
1. INTRODUCTION
1.1 Introduction
Microalgae has been chosen as food for many years (Jensen,
2011). Spirulina sp. contains bio - elements such as beta caroten, vitamine E, carotenoid, chlorophyll and phycocyanin
pigment which can prevent oxidation, old age and cancer. About
the structure, the width is 6 – 12 µm, length is 0.5 – 1 µm,
cylinder cell. The algae can change from curly to helically coiled
base on hydration and dehydration of
oligopeptide in
peptidoglycan (Genene Tefera, 2009). Spirulina sp. dry biomass
contains 60 – 70 % protein, more than 40% essential amino acid
but small nonessential amino acid, sulphur such as methionine
and cysteine (Borowitzka, 1988). Beside that Spirulina also
contain vitamin A, B1, B2, B3, B12 and minerals such as iron,
phosphor, magie and calci…(Pandey et al., 2010). Moreover,
chlorophyll is a photosynthesis pigment which only find in
autotrophic organisms or algae, chlorophyll content depends on
biomass production (Norbert Wasmund, 2006). Carrotenoid is
provitamine A which prevent natural oxidation (Goodwin, 1980).
The accumulation and isomer of β - carotene were controlled by
light intensity and quality (Senger et al. 1993). Temperature plays
an important role in the growth of algae, biomass production,
protein and chlorophyll concentration (Pandey, 2010). According
to Dylan (2011), Spirulina sp. growth well at pH = 9 - 11. High
pH leads to prevent the infection of other green algae (Richmond
et al., 1982).
1
1.2 Objectives
Determination of pH concentration, dark – light cycle and light
colours appropriate for biomass growth rate, chlorophyll and
carotenoid production in Spirulina sp.
2
2. MATERIALS AND METHODS
2.1 Materials
2.1.1 Time and location
Time: from January 2013 to April 2013.
Location: Laboratory of Microbiology, Biotechnology Research
and Development Institute, Can Tho University.
2.1.2 Tools and equipments
Microalgae: Spirulina sp. was received from Microbiology
Laboratory from Biotechnology Research and Development
Institute.
Laboratory equipments: Sterile cabinet, cabinet for incubating
algae, Autoclave, Microscope, Centrifuge, Electronic scales,
Micropipette.
Chemicals: acetone, alcohol 90, alcohol 70, Zarrouk media
(Zarrouk, C. 1966 and Bharat Gami et all, 2011): NaNO 3 (2,5
g/L), NaCl (1g/L), MgSO4.7H20 (0,2 g), CaCl2.H2O (0,04 g/L),
FeSO4.7H2O (0,01 g/L), Na2EDTA (0,08 g/L), NaHCO3 (16,8
g/L), K2HPO4 (0,5 g/L), Na2CO3 (7,6 g/L), H3BO3 (2,86 g/L),
MnCl2.4H2O (1,82 g/L), ZnSO4.7H2O (0,22 g/L), CuSO4.5H2O
(0,08
g/L),
Na2MoO4.2H2O
(0,018
g/L),
NiSO4.7H2O (0,048 g/L).
2.2 Methods
2.2.1
Microalgae
biomass
increasing,
chlorophyll
and
carotenoid extraction method
Microalgae biomass increasing
Increasing the biomass of Spirulina sp. in order to have enough
microalgae for next experiments.
3
Two 300 mL flasks were prepared, each flask contained 100 mL
sterilized medium and were covered by sterilized cotton button.
Then, each flask was inoculated with 3 stored microalgae tubes
equivalent to 20% of the new medium volume.
These flasks were grown in the cabinet for incubating microalgae
at room temperature, 24 hours of light and aerated continuously
for 5 days.
After 5 days, 140 mL of microalgae from the 300 mL flask were
transferred to 1 liter - flask that contained 700 mL sterilized
Zarrouk medium. The last 60 mL were tranferred to two 100 mL
flasks to store for next experiment. These flasks were kept
aerating in one week.
After one week, 500 mL of microalgae were transferred from 1
liter - flask to 5 liter - bottle. The last 200 mL were transferred to
other 1 liter - flask to store. The 5 liter - plastic bottle and 1 liter flask were aerated continously in one week at room temperature
and 24 hours of light.
Biomass collection: Algae biomass was collected by Whatman
filter – paper. 50 mL algae was took out, dry at 75 C in 24 hour,
weight and detemine biomass.
Clorophyll and carotenoid extraction (M.Henriques et al., 2007)
2 mL algae was tranfered from treatments to eppendorf,
centrifuged at 6000 rpm in 10 munites, washing the algae two
times by distilled water and extraction by 2 mL acetone 80 %.
Then, the extraction of chlorophyll and carotenoid production was
measured by spectrophotometer (at wave length 663 nm, 646 nm
4
and 470 nm). The calculation of chlorophyll and carotenoid were
caculated based on Lichtenthaler Welburn (1983).
Chlorophyll a (µg/ml) = 12.21 x (A663) – 2.81 x (A646)
Chlorophyll b (µg/ml) = 20.13 x (A646) – 5.03 x (A663)
Carotenoid (µg/ml) = (1000A470 – 3,27 x [chl a] – 104
x [chl b])/227
2.2.2 Study the effect of pH on Spirulina sp. chlorophyll and
carotenoid production
Objectives: Study the suitable pH for chorophyll and carotenoid
production.
Procedure
Spirulina sp. was grown in 3 liter bottle with inoculated ratio 20
% and repeated three times for each treatment. Using NaOH 1M
and HCl 1M to adjust pH = 8, 9, 10, 11. The change of pH,
increasing of biomass, chlorophyll and carotenoid production
were determined in day 0, 4, 8, 16, 20 after algae inoculation.
2.2.3 Study the effect of light colour on Spirulina sp.
chlorophyll and carotenoid production
Objectives: Study the suitable light colour for chorophyll and
carotenoid production.
Procedure
Spirulina sp. was grown in 3 liter bottle with inoculated ratio 20
% and repeated three times for each treatment. Algae were grown
under red, green and white light in shelf. The change of pH,
increasing of biomass, chlorophyll and carotenoid production
were determined in day 0, 4, 8 after algae inoculation.
Next experiment was carried out in the same way but used green,
blue, and white light to consider the change of pH, increasing of
5
biomass, chlorophyll and carotenoid production in 6 continuous
days from day 0 to day 5.
2.2.4 Study the effect of dark – light cycle on Spirulina sp.
chlorophyll and carotenoid production
Objectives: Testing and comparing the effect of illumination
time 12/24 and 24/24 hour on the growth of biomass, chlorophyll
and carotenoid production.
Procedure
Spirulina sp. was grown in 3 liter bottle with inoculated ratio 20%
and repeated three times for each treatment. Controlled the light
to make 12/24 and 24/24 hour time illumination and the most
important condition was restriction the outside light. The change
of pH, increasing of biomass, chlorophyll and carotenoid
production were determined in day 0, 1, 2, 3, 4 and day 5 after
algae inoculation.
2.2.5 Study the growth recovery of Spirulina sp.
Objectives: Spirulina was broken into many small fragments in
the disavantage condition. Therefore, the next eperiment was
done to observe the recovery of Spirulina.
Procedure
Small fragments of algae were suported in the appropirate culture
in 0.5 liter media which adjust pH = 9, continuous aeration,
inoculation ratito in 20 % and 24/24 illumination light. Followed
in 5 continuous days, the growth of Spirulina was determined by
miroscopy and the biomass increasing.
2.2.6 Data analysis method
Microsoft Excel and SPSS software were used for data analyzed.
6
3. RESULTS AND DISCUSSIONS
3.1 The effect of pH on Spirulina sp. chlorophyll and
carotenoid production
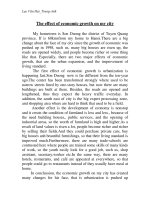
The results showed that biomass, chlorophyll and carotenoid
production of all treatments were highest in day 8 and pH = 9 was
the better condition for the growth of Spirulina. In day one, algae
was shock when transfer from pH = 9 to pH = 11 and they settled
down to the bottle bottom. However, they grew again in day 4 in
case of green colour. In all treatments, biomass increased from
day 0 to day 8 and decreased to day 20. The highest biomass in
day 4 was 0.14 g/ 50 mL at pH = 10, comparing to 0.12 g/ 50 mL
and 0.11 g/ 50 mL at pH = 8 and 9, respectively. In day 8,
treatment at pH = 9 was highest biomass (0.16 g/ 50 mL) and
significant difference at 5 % according to Duncan test among
treatments (figure 1). These results were similar to the research
about the effect of pH on biomass of Kemka et al. (2004).
Figure 1. Biomass production changed in Spirulina culture in
different pH
7
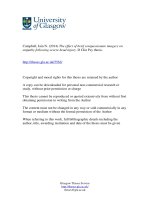
Figure 2. pH changed in Spirulina culture in different pH
During experiment, pH fluctuated from 10 to 10,18, decreasing
in day 16 and 20 (10.04 to 10.08) compared to day 12 (10.11 to
10.18) and no significant difference between treatments (figure
2). Another study also showed that pH was small change and
remained from 9.98 to 10.01 during algal living (Ngakou Albert
et al., 2012).
Figure 3. Chlorophyll a production in different pH
Like biomass, chlorophyll at pH = 9 was highest at day 12 and 8
(chlorophyll a: 2.72 µg/mL, chlorophyll b: 3.15 µg/mL) and
significant difference at 5 % according to Duncan test among
treatments (figure 3 and figure 4). According to Pandey et al.
(2010), pH = 9 was better condition for chlorophyll accumulation
(among pH from 7 to 12).
8
Figure 4. Chlorophyll b production in different pH
Highest carotenoid was achieved in day 8 with 1.13 µg/mL for
treatment pH = 8 and 1.43 µg/mL at pH = 9. While in day 12, pH
= 10 and 11 these numbers were 1.11 µg/mL and 0.77 µg/mL,
respectively (figure 5). For all treatments, carotenoid decreased in
day 16 and 20 because of lack nutrition in culture and high
density of algae.
Figure 5. Carotenoid production in Spirulina in different pH
3.2 The effect of light colour on Spirulina sp. chlorophyll and
carotenoid production
Light affected directly on the photosynthesis. So this was a strong
factor which controlled the growth of algae. In this experiment, 3
9
different colours green, red and white had significant different
effect in all treatments. In this case, Spirulina grew slow under
green light and limited under red light (figure 6).
Figure 6. Biomass, chlorophyll and carotenoid in Spirulina under
different light colours
The results of this experiment showed that light played the most
important roles on Spirulina growth. Algae were broken into very
small fragments in red and green light condition. Spirulina also
grew to day 4 so that next experiment should be carried out to
check the effect of light colour on 5 continuous days. In this
study, white, green and blue light were chosen. As the results
obtained before, Spirulina grew well at white light. From day 0 to
day 4, biomass in three treatments showed no difference while
pigments had significant difference. From day 1 to day 3, algae
biomass increased under blue and white light. It slow rose under
green colour from day 2 because biomass was similar in first 4
days (figure 7). In day 5, highest biomass was collected at white
10
light (0.13 g/ 50 mL) while these numbers were 0.09 g/ 50 mL
and 0.08 g/ 50 mL for blue and green light, respectively.
Figure 7. Biomass production of Spirulina under different
light colours
Spirulina did not synthesize carotenoid under green and blue light
from day one (figure 8). In treatment applying white light,
carotenoid grew up fast from day 2 (0.77 µg/mL) to day 4 (1.24
µg/mL).
Figure 8. Carotenoid production in Spirulina under different
light colours
11
In treatments controlled with white light, chlorophyll a
accumulated rapidly on from day 2 (1.02 µg/mL) to day 3 (2.15
µg/mL) while day 4 (2.42 µg/mL) and day 5 (2.71 µg/mL) the
accumulation of the pigment were slower (figure 9). Madhyastha
and Vatsala (2007) demonstrated that white light was better
condition for chlorophyll accumulation in Spirulina compared to
blue and green light.
Figure 9. Chlorophyll a in Spirulina under different light colours
Clorophyll b production of Spirulina under white light was 3.35
µg/mL in day 4 while this number was 0.27 µg/mL for green and
0.26 µg/mL for blue light (figure 10).
Figure 10. Chlorophyll b in Spirulina under different
light colours
12
pH value in this study had no significant difference for all
treatments and remained at 9.8 – 9.9 in day 4 and 5 (figure 11).
These results were similar to experiments before in this paper. It
could be concluded that pH did not change much in algal growth.
Figure 11. The effect of colour light on pH of algal culture
3.3 The effect of dark – light cycle on Spirulina sp. chlorophyll
and carotenoid production
In sufficient light regime (24/24 hour of illumination) Spirulina
grew better than 12/24 hour of illumination. After 4 day, biomass
was similar between two treaments but pigments of Spirulina
were sighnificant difference. In day 5, both biomass and pigments
of Spirulina at 24/24 hour of illumination were higher than 12/24
hour of
illumination (1.08 times in biomass, 2.36 times in
chlorophyll a, 1.2 times in chlorophyll b and 1.7 times in
carotenoid) (figure 12).
13
Figure 12. The effect of dark – light cycle on chlorophyll a,
chlorophyll b and carotenoid in spirulina at day 5
Biomass production of Spirulina was significant difference in day
5 (figure 13). For full light, biomass, chlorophyll a, chlorophyll b
and carotenoid were 0.13 g/50 mL; 2.83 µg/mL; 3.63 µg/mL;
2.51 µg/mL, respectively, while these numbers were 0.11 g/50
mL; 1.35 µg/mL; 2.23 µg/mL; 1.50 µg/mL in the half day light.
Figure 13. Spirulina biomass during 5 days under 12/24 and 24/24
hour illumination
14
Algal biomass dramatically increased during 5 days in 24/24 light
illumination. However in 12/24 hour light illumination, the
biomass increased in the first 3 day and increased slower in day 3,
4 and day 5 (biomass around 0.22 g/50 mL) (figure 13). At this
time, algae density was very high so that they needed more light
for photosynthesis. It could be explained that at high density of
algae, light could not reached to all algal fibers, nutrition and
carbohydrate decreased so that the photosynthesis was inhibited
(Richmond and Grobbelaar, 1986).
Figure 14. Chlorophyll a in Spirulina during 5 days under 12/24
and 24/24 hour illumination
As from the first day, chlorophyll a was difference value between
two treatments. At day 5 chlorophyll a production was 1.35 µg/ml
for 12/24 light hour and 2.83 µg/ml for 24/24 light hour (figure
14). That mean chlorophyll a was more affected by light than
chlorophyll b and carotenoid.
15
Clorophyll b content in the first three days was not significant
difference but between day 3 and day 5, it dramatically increased
in 24/24 light consumption (from 2.13 µg/mL to 3.63 µg/mL). At
this time, the chlorophyll b production in the treatment at 12/24
hour illumination increased slowly (2.15 µg/mL – 2.23 µg/mL)
(figure 15).
Figure 15. Chlorophyll b in Spirulina during 5 days under 12/24
and 24/24 hour illumination
Compared to chlorophyll, there was significant difference about
carotenoid production which increased day by day. At day 5,
carotenoid content in 24/24 hour illumination was 2.15 µg/mL
while in 12/24 hour illumination, it was 1.50 µg/mL (higher than
1.7 times) (figure 16).
16
Figure 16. Carotenoid in Spirulina during 5 day under 12/24 and
24/24 hour illumination
Similar to the previous results, pH increased in the first 4 day but
became stable at day 5 and no significant difference among all
treatments (figure 17).
Figure 17. pH in Spirulina media during 5 days under 12/24 and
24/24 hour illumination
17
3.4 The growth recovery of Spirulina sp.
Previous results showed that in inappropriate conditions,
Spirulina cells were broken automatically into small fragments.
These treatments were used as a source for this discovery. After 5
day in Zarrouk media, pH = 9, 24/24 hour illumination and
continuous aeration, Spirulina grew and recovered very fast. The
algae fiber was longer and biomass increased day by day (table
1).
Table 1. Spirulina biomass in optimum growth culture
Day
0
1
2
3
4
5
Biomass (g/50mL)
0.070
0.076
0.081
0.103
0.114
0.118
In the first 2 day, algae biomass increased slowly from 0.07
g/50mL (day 0) to 0.081 g/50 mL (day 2). Growth rate increased
faster from day 3 to day 5 because at this time algae was adapted
in new environment (figure 18).
a
b
b
a
a
b
Figure 18. Spirulina biomass in appropriate conditions
18
a
b
c
d
e
f
Figure 19. Spirulina growth during 5 day in recovery experiment
of algae under microscope at magnification E 40
a: day 0; b: day 1; c: day 2; d: day 3; e: day 4; f: day 5
Under microscope at magnification E40, algae fiber became
longer day by day and high number of twist (Figure 19). This
discovering was very important in large scale production because
this demonstrated that Spirulina could dramatically and quickly
recover in suitable environment culture.
19
4. CONCLUSIONS AND SUGGESTIONS
4.1 Conclusions
pH = 9, white light, 24/24 light illumination were appropriate
conditions for biomass, chlorophyll and carotenoid production in
Spirulina.
During growth of Spirulina, pH remained stable from 10 to 10.18.
In inappropriate conditions, Spirulina was broken into small
fragments, and quickly recovered when it was grown in
appropriate conditions.
4.2 Suggestions
More studies shoud be done to see the effect of temperature, light
intensity, aeration rate on biomass and pigment production of
Spirulina sp.
20


![gold et al - 2012 -the effect of engagement and review partner tenure and rotation on audit quality - evidence from germany [mapr]](https://media.store123doc.com/images/document/2015_01/06/medium_YF2viUqvRF.jpg)
![kwon et al - 2014 - the effect of mandatory audit firm rotation on audit quality and audit fees empirical - evidence from the korean audit market [mafr]](https://media.store123doc.com/images/document/2015_01/06/medium_har1420548188.jpg)
