anthocyanin – study of extraction from basella rubra l and verifying antioxidant activity, application in identificating di sodium tetra borate in food
Bạn đang xem bản rút gọn của tài liệu. Xem và tải ngay bản đầy đủ của tài liệu tại đây (785.19 KB, 33 trang )
MINISTRY OF EDUCATION & TRAINING
CAN THO UNIVERSITY
BIOTECHNOLOGY RESEARCH & DEVELOPMENT INSTITUTE
SUMMARY
BACHELOR OF SCIENCE THESIS
THE ADVANCED PROGRAM IN BIOTECHNOLOGY
ANTHOCYANIN – STUDY OF EXTRACTION FROM BASELLA
RUBRA L. AND VERIFYING ANTIOXIDANT ACTIVITY,
APPLICATION IN IDENTIFICATING DI SODIUM TETRA
BORATE IN FOOD
SUPERVISOR
STUDENT
MSc. TRAN THI XUAN MAI
NGO TRAN HUU NGHIA
Student code: 3102836
Session: 36 (2010 – 2014)
Can Tho, 2014
APPROVAL
SUPERVISOR
STUDENT
MSc. TRAN THI XUAN MAI
NGO TRAN HUU NGHIA
Can Tho, December
, 2014
PRESIDENT OF EXAMINATION COMMITTEE
i
ABSTRACT
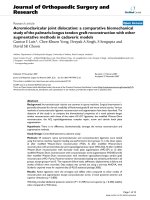
Study of extracting anthocyanins from Basella rubra L. and antioxidant
activity, identifying of Di Sodium Tetra Borate in food. Through the experiment
with different solvents, temperatures and compared the total anthocyanin
content among products, the most effective method with the highest outcome was
recorded for further experiment. The anthocyanin content was calculated by
mean of pH differential method at pH 4.5 and 12.0, with light absorbance at
maximum wave length and 700nm. Extracted juice from fruits were used for
estiamating antioxidant activity and verifying the ability of identifying borax in
food due to the specific color change in reaction with borax solution pH from 1
to 8. In this research, the treatment was carried out with distilled water as
solvent and temperature of 30oC was recorded as the most effective extraction
method, the total anthocyanin content yield was 3.33%.Moreover, the IC50
index from antioxidant activity experiment was 1. 8 µg/mL and lower when
compared with ascorbic acid and garlic acid 8.4 µg/mL and 2.6 µg/mL
respectively, this result demonstrated the high potential of antioxidant activity
from Basella rubra L.. Finally, the identification of Di Sodium Tetra Borate
experiment resulted in a positive abilities from anthocyanins: both 20%
anthocyanins indicator kits (pH =2) and indicator papers gave clear purple
color and high contrast displays with the minimum concentration of borax at
0.05% for kits and 0.1% for papers. The extend experiment of the two indicators
also achieved the further ability that could identify Sodium hydroxide with high
and low concentration.
Key word: anthocyanin, antioxidant, borax, di sodium tetra borate,.
ii
CONTENT
APPROVAL ...................................................................................................... i
ABSTRACT ..................................................................................................... ii
CONTENT ...................................................................................................... iii
CHAPTER I. INTRODUCTION ................................................................... 1
1.Introduction ................................................................................................ 1
2.Objective..................................................................................................... 2
CHAPTER II. MATERIALS AND METHODS .......................................... 3
1.Materials .................................................................................................... 3
1.1.Sample ................................................................................................. 3
1.2.Apparatus ............................................................................................. 3
1.3.Equipment ............................................................................................ 3
1.4.Chemicals ............................................................................................ 3
2.
Methods ................................................................................................ 3
2.1.Sample preparation .............................................................................. 3
2.2.Anthocyanin extraction method ........................................................... 3
2.3.Moisture determination........................................................................ 4
2.4.Total anthocyanin content analysis ...................................................... 4
2.5.Verification of antioxidant activity and IC50 index ............................ 5
2.6.Preparation of indicator solution: ........................................................ 5
2.7.Data analysis ........................................................................................ 5
3.
Experiment arrangement .................................................................... 5
3.1.Experiment 1: Verification of color change among the pH range ....... 5
3.2.Experiment 2: Verification of maximum absorbance wave length ..... 6
3.3.Experiment 3: The effect of solvent and temperature on the total
anthocyanin content ................................................................................... 6
3.3.1.Determination of moisture ............................................................ 6
3.3.2.The effect of solvent and temperature on the extraction process.. 6
iii
3.4.Experiment 4: Antioxidant activity verification .................................. 7
3.5.Experiment 5: Application in Identification of di sodium tetra borate 8
3.5.1.Identification of Borax .................................................................. 8
3.5.2.Producing indicator solution ......................................................... 8
3.5.3.Producing indicator papers ........................................................... 9
3.5.4.Identification of sodium hydroxide in food .................................. 9
CHAPTER III. RESULT AND DISCUSSION ........................................... 10
1.Verification of color change among the pH range .................................... 10
2.Verification of maximum absorbance wave length .................................. 11
3.The effect of temperature and solvent on total Anthocyanin content ....... 12
3.1.Moisture content ............................................................................ 12
3.2.Total Anthocyanin content ............................................................ 12
4.Experiment 4: Antioxidant activity verification ....................................... 14
5.Application in Identification of Di Sodium Tetra Borate ......................... 16
5.1.Identification of Borax....................................................................... 16
5.2.Possibilities of indicator solution....................................................... 17
5.3.Possibilities of indicator papers ......................................................... 19
5.4.Identification of sodium hydroxide ................................................... 20
5.4.1.Identification of sodium hydroxide by indicator solution: ......... 20
5.4.2.Identification of sodium hydroxide by indicator papers: ............ 21
CONCLUSIONS AND SUGGESTIONS ..................................................... 23
1.Conclusions .............................................................................................. 23
2.Suggestions ............................................................................................... 24
REFFERENCES ............................................................................................ 25
iv
CHAPTER I. INTRODUCTION
1. Introduction
Anthocyanin are water-soluble vacuolar pigments occur in tissues of
higher plans, play an important role beside Chlorophyll and Carotenoid. This
polyphenol act as main constituent of natural color on flowers, fruits, seeds that
can not be replaced by artificial colored products. In fact, those man – made
colorant only adapt to coloring function but still existed problems in food safety
like cancer, neurological disorder, intestinal or poisoned lead to lethal situations.
In contrast, anthocyanins – polar organic components are safe, soluble in
polarized solvents with characteristic of antioxidant, anti-cancer, antiinflammatory and prevent cardiovascular diseases (Joseph,1999; Pawlowicz,
2000). Thanks to the natural qualities and valuable functions, anthocyanins have
been leading scientists and companies to study and exploit this natural pigment
in food consumption to make sure the safety in society.
Basella rubra L. are vegetable that evaluated as easy crops because of
short time growth, simple cultivate methods, suitable for many kinds of soil;
they have been using as high nutrient vegetable in daily dishes due to both
delicious and medicinal properties. Farmers usually use only stems and leaves
for sale, the left over fruits after harvest are kept as breeding purpose in few
amount, the rest are useless. The flesh contain red or purple – red color, these
pigments can soluble in water easily, which are high potential for food colorants.
Pigment content inside fruit can supply for food color, food preservatives or
functional food. By mean of using Basella rubra L. fruits for extraction
anthocyanins purpose, the problem with leftover fruits after harvested can be
solved among with produce natural colorant safe for health.
Problems in food safety are not only cause by chemical colorant but also
food preservative. There is a fact that some banned preservatives that still have
been using, are threatening consumers health. Di Sodium Tetra Borate or Borax
1
are using as an anti-fungal compound in food preservation, that can help fishes
and meat become tough and elongate the storage period. The color of
anthocyanins can change along with the pH range, this property can be applied
as an indicator to identify the present of borax in food through the color change.
In total, this thesis aim to: study of extraction from Basella rubra L. and
verifying antioxidant activity, application in identifying disodium tetra borate in
food.
2. Objective
‒ Study of extracting anthocyanins from fruits of Basella rubra L.
‒ Verifying antioxidant activity of anthocyanin from Basella rubra L.
‒ Determining the identical possibility of borax in food by anthocyanin
from Basella rubra L. fruits.
2
CHAPTER II. MATERIALS AND METHODS
1. Materials
1.1. Sample
Fruits of Basella rubra L. were harvested from Biotechnology R&D
Institute, Can Tho University and Dong Thap province, Vinh Long province,
Tien Giang province.
1.2. Apparatus
Beaker, buret, crucible and cover, Erlenmeyer flask, filter paper, funnel,
graduated cylinder, micropipette, mortar and pestle, test tube, crack, thermal
metter, volumetric flask, volumetric pipet, vacuum bottle, vacuum filter bottle,
wash bottle.
1.3. Equipment
Analytical balance, balance, centrifuges, dry cabinet, pH parameter, stir
plate, ultraviolet–visible spectroscopy, vacuum pump, water bath.
1.4. Chemicals
‒ Anthocyanin extraction: ethanol, H2O (1:1 ; 1%HCl), HCl 0.1N,
acetone 0.01% HCl, distilled water, Na2HPO4 0.2M, Citric acid 0.1M, KCl
0.2M, NaOH 0.1N.
‒ Antioxidant activity: DPPH, methanol.
‒ Borax identification: Di Sodium Tetra Borate, pH buffers (1-8).
2. Methods
2.1. Sample preparation
‒ Fresh fruits was collect and separated into 2 part, one were used in
moisture experiment and the other part were used in the rest experiment.
‒ Fruits were treat through experiments of extracting anthocyanins,
verifying chemical property, antioxidant activity and the application of
identifying borax in food safety
2.2. Anthocyanin extraction method
3
2.3. Moisture determination
Weigh 1g fresh fruits sample (M1) and put in each of 3 crucibles which
are dried to a constant weight.
Dry sample in drying oven at 70oC in 36 hours until the weight remains
constant, record the final unchanged weight (M2) using analytical scale.
Moisture content was determined by using formula:
Moisture = (M1-M2) x100/M1 (%)
In which: M1: The weight of eggfruit powder sample before drying
M2: The final unchanged weight of eggfruit powder sample
after drying
This experiment was repeated 3 times.
2.4. Total anthocyanin content analysis
Total anthocyanins content was calculated by pH differential method.
The principle of method: anthocyanins have flavium form at pH 4.5 and
carbinol form at pH 12.
Method: Measuring light absorbance at maximum wave length and
700nm within pH 4.5 and pH 12.0.
Equations:
a
A.M .K
.l
A = (Amax.pH4.5 – A700nm.pH4.5) - (Amax.pH12 – A700nm.pH12)
With Amax, A700nm: light absorbance at maximum wave length and
700nm, at pH = 4.5 and pH = 12
a: Anthocyanin concentration, g/L;
M: molecular weight of Anthocyanin, g/mole;
l: path length of cuvette, cm;
K: dilution factor;
ɛ = 26900 L/mole
Total Anthocyanin content:
% Total Anthocyanin content =
a.V
100%
m100 w).
4
V: volume of extracted liquid, mL.
m: mass of sample, g.
w: moisture
2.5. Verification of antioxidant activity and IC50 index
The Antioxidant activity was calculated by:
AA% =
Abscontrol - Abssample
100%
Abscontrol
AA%: antioxidant activity
Abssample : Light absorbance of sample at 517nm.
Abscontrol: Light absorbance of control sample at 517nm
IC50 value (mg/ml) is the effective concentration at which DPPH
radicals were scavenged by 50%. IC50 was calculate from trend line that built
up by the result of AA%
2.6. Preparation of indicator solution:
Indicator solution were produced by diluted centrifuged extracted juice
with pH buffer solution and store in 2.2mL tubes within dark cabinet.
2.7. Data analysis
Data from experiment were processed by Microsoft word, document
software. Statistic was handled by SPSS 20.
3. Experiment arrangement
3.1. Experiment 1: Verification of color change among the pH range
Purpose: Extracted juice from fruits were centrifuged 13000p/minute and
used for verifying the color change among different pH. The result could predict
the main ingredient of anthocyanins from Basella rubra L. fruits and their effect
to the result of lateral experiment.
Objective: anthocyanins extracted juice.
Method: 1mL extracted juice was diluted with 24mL distilled water in
each test tube. The adjustment of pH in each tube was carried out by the addition
5
of HCl 1N or NaOH 1N. The color change were observed and recorded at each
grade of pH from 1 to 14.
3.2. Experiment 2: Verification of maximum absorbance wave length
Purpose: Define the maximum absorbance wave length
Object: Extracted juice from fruits
Method: Diluted 1mL juice with 24mL pH = 1 buffer solution in a 25mL
volumetric flask. Absorbance spectra were recorded by continuous scanning
range from 450 nm to 650 nm.
3.3. Experiment 3: The effect of solvent and temperature on the total
anthocyanin content
3.3.1.
Determination of moisture
Aim: determining the moisture content of fruits, then used for calculating
total anthocyanins content.
Object: fresh fruits of Basella rubra L.
Method: dried sample at 70oC for 48 hours, experiment was repeated 3
times.
3.3.2.
The effect of solvent and temperature on the extraction process
The experiment was carried out for the aim of verifying the effect of
solvent and temperature on the same object when extracted anthocyanins from
fruits. There were two factors in this experiment, solvent and temperature;
solvent with 3 treatments: distilled water added 0.1% HCl, Ethanol: H2O (1:1)
added 1% HCl, Acetone: H2O (1:1) added 0.01% HCl; temperature with 2
treatments: 30oC and 35oC. Total 3x2 = 6 treatments and repeat 3 times.
6
Grinded sample
Solvent added
Ethanol : H2O
Acetone : H2O
(1:1)
(1:1)
HCl 1%
HCl 0.01%
H2O
Dark cabinet
30oC
35oC
Vacuum filter
E1
A1
H1
E2
A2
H2
3.4. Experiment 4: Antioxidant activity verification
Aim: Verifying Antioxidant activity
Object: extracted juice from Basella rubra L. fruits
Method:
Extracted juice was centrifuged 13000 spins/minute and diluted into
different concentration. Sample was mix with DPPH and measure light
absorbance at 517 nm. Repeat 3 times for each dilution. (Brand-Williams et al.,
1995; Huang et al., 2005)
‒ Dilution range: 10-1, 10-2, 10-3, 10-4 times.
7
‒ Tested sample included 1mL DPPH, 1mL sample for each dilution in
one 2.2 mL tube. The sample was incubated in dark cabinet for 60 minutes and
measured the light absorbance.
‒ Control sample included 1mL DPPH and 1mL Methanol.
3.5. Experiment 5: Application in Identification of di sodium tetra borate
Aim: identify borax in different concentration due to the color change of
Anthocyanin when reacted with borax.
Object: Anthocyanin from Basella rubra L.
3.5.1. Identification of Borax
Anthocyanin extract from fruits was diluted into 20%, 10% and 5% in pH
buffer solutions from 1 to 8 and reacted with Di Sodium Tetra Borate in 5
concentration 2%, 1%, 0.1%, 0.05% and 0.005%. The results with clear and
visible color change were used for the next part of experiment.
3.5.2. Producing indicator solution
Aim: producing indicator solution that could quickly identify the present
of borax.
Object: anthocyanin solution and di sodium tetra borate solution
From the color change of Anthocyanin within borax solution at specific
pH, the indicator kits were produced. Anthocyanin was diluted into 20% and
10% solution with pH buffer solution and kept in dark cabinet with room
temperature. The possibilities were test by the change color of indicator kits with
borax in 5 concentration 2%, 1%, 0.1%, 0.05% and 0.005%.
Experiment arrangement:
‒ Anthocyanin at specific pH 20% reacted with borax concentration 2%,
1%, 0.1%, 0.05% and 0.005%.
‒ Anthocyanin at specific pH 10% reacted with borax concentration 2%,
1%, 0.1%, 0.05% and 0.005%.
8
3.5.3. Producing indicator papers
Aim: producing indicator pappers that could quickly identify the present
of borax.
Object: di sodium tetra borate solution
Filter papers were cut into 0.5x5cm sheets and preserved in extracted
juice from Basella rubra L. fruits with different dilutions: 20%, 30%, 40%,
50%, and 60% in 24 hours. Then these papers were dried under room
temperature and used for identifying borax solution: 2%, 1%, 0.1%, 0.05% and
0.005%.
Experiment arrangement:
‒ Indicator papers preserved in 20% solution with borax at concentrations
of 2%, 1%, 0.1%, 0.05% and 0.005%.
‒ Indicator papers preserved in 30% solution with borax at concentrations
of 2%, 1%, 0.1%, 0.05% and 0.005%.
‒ Indicator papers preserved in 40% solution with borax at concentrations
of 2%, 1%, 0.1%, 0.05% and 0.005%.
‒ Indicator papers preserved in 50% solution with borax at concentrations
of 2%, 1%, 0.1%, 0.05% and 0.005%.
‒ Indicator papers preserved in 60% solution with borax at concentrations
of 2%, 1%, 0.1%, 0.05% and 0.005%.
3.5.4. Identification of sodium hydroxide in food
Base on the most clear and high contrast result at specific pH from
identification experiment, the indicator kits and papers were used to identify
NaOH with concentration of 1%, 0.5% and 0.05%. Sodium hydroxide is
representative of alkaline food preservatives, which are added as anti fungus and
antibacterial, these preservatives can threaten consumers‘ health. The result
were compared with the other indicators that were used in market to estimate
the possibility of indicator products from this research.
9
CHAPTER III. RESULT AND DISCUSSION
1. Verification of color change among the pH range
Anthocyanin change color due to the transfer of ion H+ and OH- that
produce colored salt contain flavium, quinonoidal, chalcone and colorless salt
as carbinol.
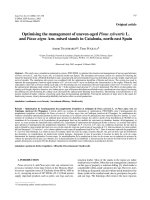
Figure 1. The colored change of Anthocyanin among pH range
The color of Anthocyanin solution changed through the pH range from 1
to 14 as shown on the figure 1. The rising of pH from an initial point of 1 to 7
witnessed the stable color of Anthocyanin with pink and red-purple color. At
pH nearly 8, Anthocyanin remained purple color and then changed to violet,
blue respectively when pH rose from 9 to 11 due to the present of quinoidal ion.
Solution gradually lose blue color and became colorless of carbinol salt at pH =
12.0. The rest pH range gave result of yellowish color due to the present of
chalcome salt. In comparison with the color range of Anthocyanin from berry,
Anthocyanin from Basella rubra L. had a specific difference that it could
maintain pink color among pH range from 1 to 7.
Base on the result of colored change, flavium salt could be the main
contributions of Anthocyanin from Basella rubra L. Those flaivium salt affect
strongly to the result of extraction experiment.
10
2. Verification of maximum absorbance wave length
The light absorbance was at 450nm then rose gradually and peaked at
high of 539nm as the maximum absorbance wave length. The light absorbance
stably reduced when wave length rose from 540nm to 650nm.
Absorbance (AU)
2.5
2
1.5
1
0.5
0
0
200
400
600
800
Wave length (nm)
Figure 2. The light absorbance of anthocyanin from 450nm – 650nm
Base on the research out come of Sullivan in 1998, the maximum
absorbance wave length of anthocyanin ranged fluctuated between 510 to 540.
For instance, maximum wave length of mulberry is 527 (Nhan, 2011),
strawberry is 520 nm (Francisco et al., 1998). Due to the outcome of reported
paper, the pigments from extracted juice from Basella rubra L. fruits were
anthocyanins.
11
3. The effect of temperature and solvent on total Anthocyanin content
3.1. Moisture content
Table 1. Moisture of Basella rubra L. fruits
Repeat
M2 (g)
M1(g)
D (%)
1
0.2015
1.1018
81.71
2
0.2072
1.2028
82.77
3
0.1851
1.1283
83.59
Mean
82.69
The moisture of fresh fruit was 82.69%. This data was used for calculated
total anthocyanin content.
3.2. Total Anthocyanin content
Table 2. The total Anthocyanin content
Temperature
30oC
35oC
Solvent
Total Anthocyanin
content
(%)
CV
H2O
3.33a
10.2%
Ethanol
1.59b
22.1%
Acetone
1.28b
5.8%
H2O
1.74a
12.8%
Ethanol
0.83b
23.3%
Acetone
0.58b
7.6%
*Those data within a column with same temperature have the same subset b have a
statistically significant effect on Percent at the 5.0% confidence level .
Temperature and solvent effected significantly to the total Anthocyanin
content of extracted liquid in both single and correlative impact. Treatment with
distilled water as solvent resulted in high yield for both temperature 30 oC and
35oC. Since the main contributions of Basella rubra L.’s Anthocyanin are
flavium salts with negative charge, this polyphenols become anionic and
dissolved well in protic solvent like water through hydrogen bonds. In addition,
12
under condition of 30oC temperature, hydrogen bonds become more stable than
those at 35oC, therefore, the total Anthocyanin content increased. There was a
significant different when compare with result of Nhan et al. 2011 that acetone
gave high outcome while distilled water in this result gave high yield. These
factors have a statistically significant effect on Percent at the 95.0% confidence
Total Anthocyanin Content
(%)
level.
4.00
3.33
3.00
2.00
1.74
1.59
0.83
1.00
1.28
0.58
0.00
H2O
Ethanol
Acetone
Solvent
30oC
35oC
Figure 3. Chart of total Anthocyanin content
Treatment with distilled water as solvent at 30oC temperature ranked first,
at 3.33% total Anthocyanin content, followed by treatment with the same
solvent but at 35oC temperature. Solvent acetone came last at both 30oC and
35oC temperature with 1.28% and 0.58% respectively. Compared with other
Anthocyanin content from reported journal as mulberry 1.88%, red cabbage
0.909%, red tea 0.335% (Cuc et al., 2009); the total amount of Basella rubra L.
higher than the other fruits.
Extraction method used distilled water as solvent at 30oC was the most
effective method for Anthocyanin extraction for both high yield of Anthocyanin
and simple condition as room temperature and distilled water.
13
4. Antioxidant activity verification
Figure 4. The colored change of diluted sample at 10x after 1 hour
with DPPH
Figure 4 showed the color of sample from different dilutions after 1 hour
had reacted with DPPH. Dilution 10-1 gave nearly red color, dilution 10-2
resulted in yellow color. The other dilutions gave the same color with DPPH.
Table 3. Antioxidant of Anthocyanin in different dilutions
Concentration (µg/mL)
Means (%)
CV
2
67.7a
3.51%
0.2
20.93b
3.1%
0.02
4.55c
21.9%
Antioxidant activity verification experiment was carried out with
extracted juice from Basella rubra L. fruits, the concentrated solution has
concentration of 200 µg/mL. Dilution of 10-1 (equal to 20 µg/mL) result in minus
data because DPPH was not enough to react with Anthocyanin molecular. The
antioxidant activity decreased directly proportional to the decrease of
Anthocyanin concentration. The reason of decreasing AA% was the decline of
14
Anthocyanin molecular through dilutions. The result of antioxidant activity was
shown in table 6, the data have a statistically significant effect on Percent at the
Antioxidant activity
(AA%)
95.0% confidence level
80
70
y = 29.498x + 9.2317
R² = 0.9713
60
50
40
30
20
10
0
0
0.5
1
1.5
2
2.5
Concentration of anthocyanin (µg/mL)
Figure 5. Trend line of Basella rubra L. anthocyanin antioxidant
activity.
The IC50 index was determined as 1.8 µg/mL, significant low compared
to ascorbic acid and garlic acid with IC50 index as 2.6 µg/mL, 8.4 µg/mL
respectively (Brighente et al., 2007). This result proved the fact that
Anthocyanin from Basella rubra L. need fewer molecular to scavenge DPPH
by 50%, therefore, the antioxidant activity of Anthocyanin is higher.
Since the high antioxidant activity, Basella rubra L. can be considered as
potential sources of functional foods in prevent cancer, anti-inflammatory and
prevent cardiovascular diseases or acting as food preservatives.
15
5. Application in Identification of Di Sodium Tetra Borate
5.1. Identification of Borax
Figure 6. The identification of Borax in different pH
(a) Anthocyanin 10% solution, (b) Anthocyanin 20% solution
Extracted juice displayed specific violet color when reacted with Di
Sodium Tetra Borate at pH = 2.0 and 8.0. The principles of this experiment are
the colored change of Anthocyanin at specific pH and the pH produced by
Borax. This violet color was similar to color of Anthocyanin at pH higher than
8 and the pH result that measured from borax solution was approximately 8.4,
therefore, the reason that make anthocyanin change to violet is that borax
provide a medium with pH >8 that make Anthocyanin change to specific violet
color.
16
Anthocyanin 20% solution at pH = 2.0 was chosen for the indicator kits
purpose because of the clear and visible colored change – red to violet display.
Result at pH = 8.0 could not be chosen because its color was similar to
Anthocyanin color at pH higher than 8, this colored change can make wrong
decision because of no difference before and after test.
5.2. Possibilities of indicator solution
Figure 7. The indicator kits (a) 20% Anthocyanin (b) 10%
Anthocyanin
Both of the two indicator kits were sensitive and possible to recognize
borax with the minimum concentration of 0.05%. Di Sodium Tetra Borate
solution change from colorless to violet when added 1 drop of kit 20% and 3
drop of kit 10%.
Figure 8. Possibility of solution 10% in identification of Borax
17
Figure 9. Possibility of solution 20% in identification of Borax
Indicator kit 20% Anthocyanin at pH = 2.0 was most suitable for
identifying borax in food because it need just fewer than one drop for one
identifying time and more visible colored change than kit 10%.
18
5.3. Possibilities of indicator papers
Figure 10. Possibility of paper 20% in identification of Borax
Figure 11. Possibility of paper 40% in identification of Borax
Figure 12. Possibility of paper 60% in identification of Borax
Indicator papers could identify Di Sodium Tetra Borate in solution by
specific violet color. Most of papers could recognize the present of borax at
19
minimum concentration of 1%, especially indicator papers preserved in
Anthocyanin 20% solution could clearly identify borax at minimum
concentration of 0.1%. Indicator papers produced from anthocyanin can
normally identify borax with the same level as the other indicator from market
with the visible display at 1% borax minimum in concentration. However, those
market indicator can not display clearly when the concentration of borax under
0.1% as Anthocyanin papers.
Figure 13. Indicators from market reacted with Borax solution
From the result of indicator papers from identification figure and
comparison with market indicators, 20% anthocyanin indicator papers was the
most suitable indicator for identification of borax by mean of clear and high
contrast color change.
5.4. Identification of sodium hydroxide
5.4.1. Identification of sodium hydroxide by indicator solution:
Indicator kits from Anthocyanin could identify Sodium hydroxide
through the color change. There was a difference from identification of borax
that indicator kits could recognize and distinguish the concentration of NaOH,
namely violet color for low concentration and yellow color for high
concentration.
20