Green chimney localized carbon sequestration in closed environment
Bạn đang xem bản rút gọn của tài liệu. Xem và tải ngay bản đầy đủ của tài liệu tại đây (4.5 MB, 117 trang )
GREEN CHIMNEY – LOCALIZED CARBON SEQUESTRATION
IN CLOSED ENVIRONMENT
THERESIA RETNO NURMILASARI
A THESIS SUBMITTED
FOR THE DEGREE OF MASTER OF SCIENCE
DEPARTMENT OF BUILDING
NATIONAL UNIVERSITY OF SINGAPORE
2011
GREEN CHIMNEY – LOCALIZED CARBON SEQUESTRATION
IN CLOSED ENVIRONMENT
THERESIA RETNO NURMILASARI
(B.Eng (Hons.) Eng. Physics, Gadjah Mada University)
A THESIS SUBMITTED
FOR THE DEGREE OF MASTER OF SCIENCE
DEPARTMENT OF BUILDING
NATIONAL UNIVERSITY OF SINGAPORE
2011
ACKNOWLEDGMENTS
I am deeply grateful for the support by Department of Building, National University
of Singapore in granting the research scholarship and research fund for the project R296-000-112-112.
I would like to express gratitude to Dr. Kua Harn Wei for his academic supervision,
support and encouragement. I would also like to thank Assistant Professor Teo
Chiang Juay and Senior Lecturer Ong Boon Lay for their guidance.
I also would like to warmly thank the laboratory officers, the Department officers,
friends and colleagues for the friendship and support.
Theresia Retno Nurmilasari
Singapore, 2011
ii
TABLE OF CONTENTS
ACKNOWLEDGEMENTS ...................................................................................... ii
TABLE OF CONTENTS ......................................................................................... iii
SUMMARY ............................................................................................................. v
LIST OF TABLES .................................................................................................. vi
LIST OF FIGURES ................................................................................................ vii
LIST OF APPENDICES .......................................................................................... ix
CHAPTER 1. INTRODUCTION.............................................................................. 1
1.1
Background ................................................................................................ 1
1.2
Research Problem ....................................................................................... 6
1.3
Research Objectives ................................................................................. 11
1.4
Scope and Methodology ........................................................................... 12
1.5
Organisation of the thesis ........................................................................ 14
CHAPTER 2. LITERATURE REVIEW ................................................................ 15
2.1
Current Development of CCS ................................................................... 15
2.2
Biosequestration ....................................................................................... 22
2.3
Elevated CO2 ............................................................................................ 24
2.4
Hydroponic System .................................................................................. 29
2.5
Powder X-Ray Diffraction (PXRD) .......................................................... 29
CHAPTER 3. RESEARCH METHODOLOGY ..................................................... 32
3.1
Overview of the experiment...................................................................... 32
3.2
Materials ................................................................................................. 33
3.2.1 Photosynthesis Agents ..................................................................... 33
3.2.1.1 Mung bean (Vigna radiata (L.)Wilczek) .............................. 33
3.2.1.2 Water hyacinth (Eichhornia crassipes) ................................ 38
3.2.1.3 Monstera deliciosa ............................................................... 39
3.2.1.4 Peperomia ........................................................................... 39
3.2.2 Photobioreactor ............................................................................... 40
iii
3.2.3 CO2 sensors ..................................................................................... 40
3.3
Method .................................................................................................... 44
CHAPTER 4. RESULT AND DISCUSSION ........................................................ 47
4.1
Introduction .............................................................................................. 47
4.2
Laboratory Experiment ............................................................................. 50
4.2.1 CO2 Profile ...................................................................................... 51
4.2.2 Temperature Profile ......................................................................... 53
4.2.3 Leaf Area ........................................................................................ 55
4.3
Rooftop Experiments ................................................................................ 58
4.3.1 Mung bean 1000cm2 Leaf Area ....................................................... 58
4.3.1.1 CO2 Profile ......................................................................... 59
4.3.1.2 Temperature Profile ............................................................ 61
4.3.1.3 Leaf Area ............................................................................ 62
4.3.2 Water hyacinth 1000cm2 Leaf Area ................................................. 63
4.3.2.1 CO2 and Temperature Profile .............................................. 63
4.3.2.2 Leaf Area ............................................................................ 66
4.3.3 Monstera deliciosa 1000cm2 Leaf Area ........................................... 66
4.3.4 Peperomia 1000cm2 Leaf Area ........................................................ 68
4.3.5 The CO2 and Temperature profile at different C3 plants .................. 69
4.3.6 Mung bean 2000cm2 Leaf Area, “Continuous” ................................ 72
4.4
Powder X-Ray Diffraction Test Result ..................................................... 76
4.5
Theoritical Calculation ............................................................................. 77
4.6
Compare GChim with mature tree ............................................................ 81
CHAPTER 5. CONCLUSION ............................................................................... 82
CHAPTER 6. RECOMMENDATION ................................................................... 83
REFERENCES ...................................................................................................... 85
APPENDICES ....................................................................................................... 93
iv
SUMMARY
Global climate is changing rapidly and unequivocally due to greenhouse gases (GHG)
emission. According to IPCC, the largest contribution to the increase in GHG level is
fossil combustion emission (56.6%). Although there are many ways to minimize
GHG level in the atmosphere, Carbon Capture and Sequestration (CCS) has been
widely considered as an effective way to reduce carbon dioxide (CO2) from fossil fuel
emission. One of the CCS options is the use of biological means through forest carbon
sink that is only able to absorb CO2 at atmospheric level. Even though there has been
a lot of research carried out on the use of vegetation to reduce CO2, there are limited
numbers of study conducted on the use of vegetation to reduce elevated CO2.
Moreover, most of the previous studies have been conducted by using terrestrial
plants grown in soil medium. Since reducing elevated CO2 by using hydroponic
system have not been investigated extensively and comprehensively, it is essential to
investigate the response of specific plants once they are exposed to very high
concentration of CO2.
In this research, a new technology -called Green Chimney, is proposed to reduce CO2
emission that is produced from a generator. The flue gas from a portable electric
generator that contained CO2 is channeled into transparent glass tanks with
50,000ppm (5% vol) as a starting level. Meanwhile specimen plants are put in tanks
that are tightly sealed to create a controlled environment. The experiments are
conducted in two different ways – in the laboratory environment and on the roof top,
using mung bean (Vigna radiata) as a plant model with leaf areas covering 500cm2,
1000cm2, and 2000cm2. The results showed that by using a “stepping down”
approach, mung bean is able to absorb the most amount of CO2 within 24 hours if
subjected to 8,000ppm as starting point. Further, mung bean with 1000cm2 leaf area
that has been exposed to 8,000ppm in the roof top experiment showed that no
significant difference of R2 compared to water hyacinth (Eichhornia crassipes) with
the same leaf area. Moreover, the results showed no statistically significant
differences between mung bean and water hyacinth were tested using the t-test at a
level of significant of 5% (α=0.05). This research also observed the response of mung
bean with 2000cm2 leaf area when subjected to 8,000ppm of CO2. The results showed
that within an average time of 3hours, mung bean specimens are able to reduce CO2
level from 8,000ppm to ambient level (380ppm).
v
LIST OF TABLES
Table 1.1 Diesel Fuel Consumption ...................................................................... 8
Table 2.1 The worldwide capacity of potential CO2 storage reservoirs ................ 16
Table 2.2 Commercial CO2 scrubbing solvents available in industry ................... 20
Table 3.1 The temperature and humidity of Singapore for the period of 2009-2010
............................................................................................................. 35
Table 4.1 t-Test: two sample assuming unequal variances (Day 1) ...................... 72
Table 4.2 t-Test: two sample assuming unequal variances (Day 2) ...................... 72
vi
LIST OF FIGURES
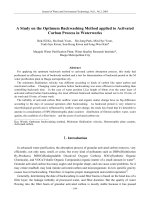
Figure 1.1 Sources of global CO2 emissions, 1970-2004 ......................................... 2
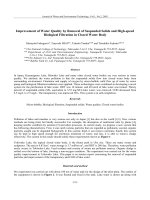
Figure 1.2 Global anthrophogenic greenhouse gas emission covered by the UNFCC
for 2004 ................................................................................................. 3
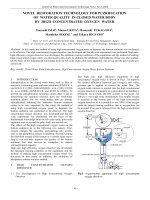
Figure 1.3 Research Methodology ........................................................................ 13
Figure 2.1 Block diagrams illustrating post combustion, pre combustion, and oxy
combustion systems ............................................................................. 17
Figure 3.1 Research Design Scheme ..................................................................... 37
Figure 3.2 Water hyacinth (Eichhornia crassipes) ................................................ 38
Figure 3.3 Monstera deliciosa .............................................................................. 39
Figure 3.4 Peperomia tuisana ............................................................................... 40
Figure 3.5 The configuration of rooftop scale set up ............................................. 42
Figure 4.1 CO2 profile of mung bean versus time for various starting CO2 ........... 48
Figure 4.2 CO2 profile for mung bean with 500cm2 of the total area of leaves ....... 51
Figure 4.3 Temperature profile for mung bean with 500cm2 of the total area of leaves
............................................................................................................. 54
Figure 4.4 Total leaves area of mung bean with starting leaves area 500cm2.......... 56
Figure 4.5 Total leaves area of mung bean with starting leaves area 500cm2 when it
is subjected with atmosperic level ....................................................... 57
Figure 4.6 CO2 profile of mung bean with total leaves area 1000cm2 and exposed to
8,000ppm of CO2, Day 1 .................................................................... 59
Figure 4.7 CO2 profile of mung bean with total leaves area 1000cm2 and exposed to
8,000ppm of CO2, Day 2 .................................................................... 60
Figure 4.8 Temperature profile of mung bean with total leaves area of 1000cm2 and
exposed to 8,000ppm of CO2, Day 1 ................................................... 61
Figure 4.9 Temperature profile of mung bean with total leaves area of 1000cm2 and
exposed to 8,000ppm of CO2, Day 2 ................................................... 61
Figure 4.10 Total leaves area of mung bean with the starting total leaves area of
1000cm2 and exposed to 8,000ppm of CO2 ......................................... 62
Figure 4.11 CO2 and temperature profile of water hyacinth with 1000cm2 of leaves
area and subjected to 8,000ppm of CO2, Day 1 ................................... 63
Figure 4.12 CO2 and temperature profile of water hyacinth with 1000cm2 of leaves
area and subjected to 8,000ppm of CO2, Day 2 ................................... 64
vii
Figure 4.13 CO2 and temperature profile of water hyacinth with 1000cm2 of leaves
area and subjected to 8,000ppm of CO2, Day 3 ................................... 65
Figure 4.14 CO2 and temperature profile of water hyacinth with 1000cm2 of leaves
area and subjected to 8,000ppm of CO2, Day 4 ................................... 65
Figure 4.15 Total leaves area of water hyacinth with the starting total leaves area of
1000cm2 and exposed to 8,000ppm of CO2 .......................................... 66
Figure 4.16 CO2 and temperature profile of Monstera deliciosa with 1000cm2 of
leaves area and subjected to 8,000ppm of CO2, Day 1 .......................... 66
Figure 4.17 CO2 and temperature profile of Monstera deliciosa with 1000cm2 of
leaves area and subjected to 8,000ppm of CO2, Day 2 .......................... 67
Figure 4.18 CO2 and temperature profile of Peperomia tuisana with 1000cm2 of
leaves area and subjected to 8,000ppm of CO2, Day 1 .......................... 68
Figure 4.19 CO2 and temperature profile of Peperomia tuisana with 1000cm2 of
leaves area and subjected to 8,000ppm of CO2, Day 2 .......................... 69
Figure 4.20 CO2 and temperature profile of different type of C3 plant with 1000cm2
of leaves area and subjected to 8,000ppm of CO2, Day 1 ...................... 70
Figure 4.21 CO2 and temperature profile of different type of C3 plant with 1000cm2
of leaves area and subjected to 8,000ppm of CO2, Day 2 ...................... 71
Figure 4.22 CO2 profile of mung bean with 2000cm2 of leaves area and subjected to
8,000ppm of CO2,”continuous”, Day 1 ................................................. 73
Figure 4.23 CO2 profile of mung bean with 2000cm2 of leaves area and subjected to
8,000ppm of CO2,”continuous”, Day 2 ................................................. 74
Figure 4.24 CO2 profile of mung bean with 2000cm2 of leaves area and subjected to
8,000ppm of CO2,”continuous”, Day 3 ................................................. 74
Figure 4.25 CO2 profile of mung bean with 2000cm2 of leaves area and subjected to
8,000ppm of CO2,”continuous”, Day 4 ................................................. 75
Figure 4.26 Powder X-Ray Diffraction Test............................................................ 76
viii
LIST OF APPENDICES
Appendix A Detail sepsification of measurement tools ......................................... 93
Appendix B Configuration of rooftop experiments ............................................. 100
Appendix C Mung bean at laboratory experiment ................................................ 104
Appendix D Mung bean at rooftop experiments .................................................. 106
Appendix E Water hyacinth at rooftop experiments ............................................ 107
ix
CHAPTER ONE
INTRODUCTION
1.1 Background
The rapid increase of carbon dioxide (CO2) in atmospheric is an undisputed fact,
which is mainly caused by the greenhouse gases (GHG) emission produced from the
emission of fossil fuel combustion from power plant (see fig.1.1) and land use change
(Rogers et al., 1999; Herzog, 2001; Davison et al., 2005; IPCC, 2007). GHG are gas
phase components of the atmosphere that contribute to the greenhouse gas effect,
where the radiant heat from the sun is trapping within the Earth’s atmosphere
resulting in the raising of temperature. Though the greenhouse gas effect is a natural
phenomenon and for some level the trapping heat of sun is essential for plants,
animals, and mankind to live, the level of GHG in the atmosphere has significantly
increased since the pre industrial time causing a rise in the Earth’s temperature. For
instance: carbon dioxide (CO2) from 280 to 382ppm, methane (CH4) from 715 to
1774ppb1, nitrous oxide (N20) from 270 to 320 ppb (NOAA, 2007).
In regard to CO2 level at atmospheric, it has risen since the pre-industrial revolution
days and still continues to increase. In conjunction with that, another fact that the
molecules of CO2 can remain in the atmosphere for up to 200 years aggravates the
GHG effect on earth. Moreover, the uneven distribution of CO2 emission conduce the
different mitigation action based on each country’s policy. Since the CO2 level in the
atmosphere keeps on increasing, scientists have recommended to set 450ppm of CO2
as a threshold. If the CO2 level increases beyond 450 ppm, the earth’s environment
1
ppb (parts per billion) is by mass.
1
becomes vulnerable to irreversible, detrimental impacts (Rossa et al., 2009). In order
to mitigate the increasing of CO2 level in the atmosphere, identification of the source
of CO2 emission is in need. The source of CO2 in the atmosphere is mainly from six
processes mentioned below (Roosa et al., 2009):
a. As by product of the conversion process from methane to CO2 in ammonia
and hydrogen plants;
b. From combustion of carbonaceous fuels;
c. As a byproduct of fermentation process;
d. From thermal decomposition of calcium carbonate (CaCO3);
e. As a byproduct of sodium phosphate manufacture;
f. Directly from natural CO2 gas wells.
Figure 1.1 Sources of global CO2 emissions, 1970-2004 (only direct emissions by sector)
(Source: Rogner et al., 2007 )
Since CO2 emission from fossil fuel use render to the biggest percentage of the total
GHG emission compared to other GHG emission (see fig. 1.2), eliminating the CO2
concentration in atmosphere in sustainable manner becomes an urgent matter to
alleviate the impact of climate change. Based on IPCC (2007) report, the impact of
2
climate change can be various, but the most highlighted is the rise of sea level and the
global mean temperature by 0.760 since the pre-industrial time. Further, increase in
global temperature will affect the pattern of precipitation that may result in climatic
disruption, changes in agricultural yields, glacier retreat, species extinctions, increase
in the ranges of disease vectors and others (Florides et al., 2009; Rossa et al., 2009).
This is another reason to reduce GHG emission, especially reducing the CO2 level
become importunate.
Figure 1.2 Global anthropogenic greenhouse gas emission covered by the UNFCC for 2004
(Source: Rogner et al., 2007)
In order to minimize the atmospheric CO2 level at atmospheric, a process of
replacement CO2 into repository that would be able to remain permanently
sequestered is introduced as Carbon Capture and Sequestration (CCS). Substantively,
CCS is a natural process that occurs through various ecosystems, for example forests
and oceans, where the quantity of carbon in Earth’s carbon cycle of land, ocean, and
air exchanges is ten times the rate of annual CO2 emission. Nevertheless, the natural
processes do not have the ability to keep the CO2 level in the atmosphere stable.
Therefore, as a result, the increasing level of CO2 keeps going (Rossa et al., 2009).
3
Regardless, there are several options to reduce CO2 level in the atmosphere, CCS is
considered as most viable ways in reducing CO2 emission, especially for CO2
emission that arises from electricity plants. CCS refers to the process of capturing
CO2 from the large scale emission sources such as exhaust of fossil fuel power plants,
exhaust of industrial plants, and then compressing or liquefying the captured CO2
before depositing it in geological formation or under ocean for long term storage. In
addition, CCS includes the conversion of CO2 gas streams into stable mineral
carbonate compounds by reacting CO2 with magnesium or calcium oxides (Herzog et
al., 2004; Dawson et al., 2009; Page et al., 2009). CCS is the only realistic way to
mitigate the climate change effect whilst we still can continue to use the fossil fuel to
meet our energy demand supply towards sustainable way (Imperial College London,
2010a). CCS has become an option since it allowed to continue the use of fossil fuel
while reducing the CO2 emission from fossil fuel use. Moreover, CCS can build on
existing technologies of power plant.
CCS has been widely applied by using chemical or physical absorption in large scale
petrochemical and petroleum industry and in small scale gas and coal fired power
plant. However, the technology requires a high cost and the cost itself is not
competitive with other solutions to climate change problem (Rossa et al., 2009).
Further, the problem is visible when we concentrate on the matter of high amount of
energy that is required in CCS process and the problem of CO2 leakage back to
environment, therefore the CCS was not able to address the issue of sustainability.
CCS using chemicals such as monoethanolamine (MEA) to absorb CO2 that has been
scrubbed from flue gases, would require higher energy penalty which is costly.
Energy penalty is defined as the energy requirement that is used to capture the CO2
from emission (Page et al., 2009). Meanwhile, CCS using physical absorption is done
4
by capturing CO2 at a higher pressure process (>12%vol), which is more cost
effective and less energy intensive compared with using chemical. Whether using
chemical or physical absorption, after the absorption process, the CO2 can be store
permanently either in geological features, mineral storage or under the sea. Mentioned
storage options also do not address the issue of sustainability since after some period
of time, it would leak back to the environment (Herzog, 2005). Moreover, direct
injection to ocean sinks would affect the local (near the point of injection) pH
seawater, such as reducing the average ocean pH by around 0.3 (Herzog et al., 2001).
The decrease in ocean pH in the end would affect the ocean environment that has an
acute impact to marine organisms, such as: phytoplankton, zooplankton, nekton, and
benthos at depths of 1000m (Adams et al., 1997; Auerbach et al., 1997; Israelsson et
al., 2009; Israelsson et al., 2010).
Therefore, to address the issue of sustainability, CCS by using photosynthesis agents
that capture CO2 in a sustainable manner become a way to mitigate greenhouse gases
emission without having the problem of leaking back to the environment.
In order to cope with the issue of sustainability, the CO2 capture that involves
biological and ecological processes is introduced.
A number of studies and a comprehensive review of the broad topic of CCS are not
the intent of this paper. Chapter 2 of this paper intends to give an overview of the
development of CCS technologies and briefly examines the current CCS technologies.
By highlighting the advantages and disadvantages of modern CCS technologies,
another type of CCS, that is by using biological agents appears as one solution to the
current add on CCS as it is able to address the issue of sustainability.
5
1.2 Research Problem
According to Burgermeister (2007), out of a total of 8 billion ton carbon, an average
of 3.2 billion ton carbon produced by human activities remains in the atmosphere, 2.2
billion ton stored in the ocean, and 2.6 billion ton siphoned off by land carbon sink,
which is mainly by forests. Since plants represent the highest capacity to carbon
sequestration compared to the geological site or ocean storage, focusing on the use of
plant as photosynthesis agent through light reaction to sequester carbon. Besides, land
carbon sink via agroforestry systems is known to be a better climate change
mitigation option than oceanic and other terrestrial options for the environmental
reason, such as helping to maintain food security and secure land tenure in developing
countries, increasing farm income, restoring and maintaining above-ground and
below-ground biodiversity, corridors between protected forests, as CH4 sinks also,
maintaining watershed hydrology, and soil conservation (Pandey, 2002).
Carbon captured by using photosynthesis agents has been widely presented in various
literatures, although most of the literature focused on agroforesty and reforesting
matter (Pandey, 2002; Masera et al., 2003; Harper et al., 2007). Albercht and Kandji
(2003) define agroforesty as any land-use system that involves the deliberate
retention, introduction or mixture of trees or other woody perennials with agricultural
crops, pastures and/or livestock to exploit the ecological and economic interactions of
the different components. Though the ability of agroforesty to sequester CO2 is being
widely recognized, the plant was exposed under CO2 atmospheric which is about
392ppm (CO2now, 2010).
Despite the literary discussion about the response of plant that has been exposed to
elevated CO2 (Liang and Maruyama, 1995; Levine et al., 2008; Allen and Vu, 2009;
6
Zhou et al., 2009), there is a knowledge gap regarding the response of plant if
exposed to very high CO2 levels, since previous study only used a CO2 level up to
1500 ppm. Those mentioned levels define as a near-optimal of metabolic consequence
for differential physiological and developmental response of plant; whereas CO2
levels up to 10,000 ppm are define as supra-optimal condition (Levine et al., 2008). In
fact, responses of plant through photosynthesis mechanism under very high CO2 level
have not been investigated extensively and comprehensively. Bernard et al. (2009)
investigated the response of the Allogromia laticollaris that have been subjected to
very high levels of CO2, started from 15,000; 30,000; 60,000; 90,000 and up to
200,000ppm. Allogromia latticollaris, also known as Foraminifera, is a large group of
amoeboid protists specimen and does not belong to C3 or C4 plant specimen. C3 plants
are plants where the photosynthesis pathway is evolved around the Rubisco CO2
fixing enzyme, thus result in the photorespiration. The photorespiration is occur due
to the carboxylation of the Rubisco enzyme is suffer from competed with oxygenase,
and thus limited the photosynthesis of C3 plants, especially at high temperatures. C4
plants are plants where the CO2 is actively concentrated around Rubisco in order to
preventing the photorespiration (Farazdaghi, H., 2011; Boom et al., 2002)
Although CCS technology is a good option for electricity power generation and
majority of electricity power generation used fossil fuel for combustion process, the
climate change mitigation act seems only to focus on the source of emission that
contributes towards the biggest percentage that is CO2 emission from power
generation. However, the small and middle category of percentage source of
emissions also needs to be paid attention to, such as from industry, small scale power
station, or portable generator, since in these mentioned sectors, the use of fossil fuel
also cannot be avoided. Moreover, the costs of current CCS technologies depend on
7
the CO2 emission that is produced from the power plant. If the CCS technologies
implement on the low and middle percentage source of CO2 emission, this will result
in the increase of CCS cost. Therefore, it is not advisable to implement CCS
technologies on low and or middle scale sources of CO2 emission.
Portable generators are widely used in various places where there is a lack of
infrastructure for electricity and water works, such as in a remote areas and islands.
Normally, the emission produced from portable generators is discarded to the
environment (Tanaka et al., 2010). A fossil fuel emission from power generation
typically contains 3-14% (v/v) CO2, 2% (v/v) O2, 500ppm (v/v) SOx, and 100300ppm (v/v) NOx (Yoshikara, 1996; Davison and Thambimuthu, 2005; Steeneveldt
et al., 2006). Since portable generators also use fossil fuel, such as diesel or gasoline,
the information of estimated fuel consumption is important in order to calculate the
CO2 emission that results from the combustion process. Table 1.1 (Diesel fuel
consumption) shows the estimated diesel fuel consumption based on generator size
and the load operation of generator.
Table1.1 Diesel Fuel Consumption
Generator
Size (kW)
75
100
125
135
150
175
200
250
300
350
400
500
600
750
1000
1/4 Load
(gal/hr)
2.4
2.6
3.1
3.3
3.6
4.1
4.7
5.7
1/2 Load
(gal/hr)
3.4
4.1
5
5.4
5.9
6.8
7.7
9.5
3/4 Load
(gal/hr)
4.6
5.8
7.1
7.6
8.4
9.7
11
13.6
Full Load
(gal/hr)
6.1
7.4
9.1
9.8
10.9
12.7
14.4
18
6.8
7.9
8.9
11
13.2
16.3
21.6
11.3
13.1
14.9
18.5
22
27.4
36.4
16.1
18.7
21.3
26.4
31.5
39.9
52.1
21.5
25.1
28.6
35.7
42.8
53.4
71.1
8
1250
1500
1750
2000
26.9
32.2
37.5
42.8
45.3
54.3
63.2
72.2
2250
48.1
81.1
(Source: EmergencyPower, 2010)
65
77.8
90.7
103.5
88.8
106.5
124.2
141.9
116.4
159.6
In addition, carbon content per gallon in gasoline is about 2,421 grams and for diesel
is about 2.778 grams. Hence, the CO2 emissions contained in one gallon of gasoline is
around 8.8 kg/gallon and 10.1 kg/gallon for diesel (EPA, 2010).
In response to sequester CO2 from power generation plant where mostly during the
operation use fossil fuel for combustion process, the need to use photosynthesis
agents that have ability to absorb CO2 up to that level is considered in our study. A
preliminary study was conducted by Kua et al. (2009) by using mung bean (Vigna
radiata), which is exposed to very high CO2 levels, starting at 50,000ppm to
8,000ppm of CO2 at laboratory scale in order to determine the optimal CO2 level for
mung beans that enables the specimen to remove CO2 in large quantities. One of the
objectives of this preliminary study was to find the effective starting point of CO2
level that can be introduced to specimens, so that the specimens are able to remove
CO2 by a large amount over 24hours of experiment. The result of this preliminary
study found that at a CO2 starting level of 8000ppm, the specific specimen was able to
remove the most CO2 amount given to the specimen, compare with other starting
point of CO2 level, i.e. 50,000ppm, 38,000ppm, 28,000ppm, and 18,000ppm.
Moreover the study revealed that at the highest peak of the CO2 removal rate of the
specimens, the specimens able to remove up to 92% of the CO2 introduced to them.
9
Although the preliminary study shows promising results, this preliminary study is still
not able to address some issues. For example, this study was conducted at laboratory
scale, where artificial light was provided constantly over 24 hours that enables the
specimen to perform the photosynthesis process over 24 hours constantly. The use of
artificial light for 24 hours means higher consumption of electricity. In the end, the
higher consumption of electricity will lead to the higher fuel consumption associated
with the power generation that resulted from more CO2 emission due to the
combustion process during power generation. Besides the limited volume of
desiccator engender the limited amount of specimens that can be put inside the
desiccator and therefore assumes that the CO2 gas is distributed evenly.
In conjunction with previous preliminary study, this study intends to fill the gap by
investigating the response of mung beans that are exposed to elevated CO2 levels at
the rooftop scale through a technology called Green Chimney. Rooftop experiment is
a scale up experiment from the preliminary study conducted by Kua et al. (2009),
therefore, the starting level of CO2 that needs to be introduced to the specimen is
8000ppm based on the preliminary study findings. Moreover, to fill the knowledge
gap from preliminary study, the artificial light is not required for the rooftop
experiment. In contrary, the natural light from the sun would only be available for 12
hours on average although the experiment itself would be conducted for 24 hours.
Hence, it would be interesting to investigate the CO2 removal rate of the specimen
over 24 hours if the specimen is introduced to high levels of CO2 on the rooftop where
the light would only be provided for 12 hours. The proposed technology exemplifies a
relatively easy, feasible and economically viable option into reducing CO2 fossil fuel
emission through a sustainable manner. Evidence is provided from the experimental
data, both from laboratory scale and rooftop scale.
10
1.3 Research Objectives
The key objectives of this research project are as follows:
a.
Measure the CO2 removal rates of photosynthesis agent (Vigna radiata, Water
hyacinth, Monstera deliciosa, and Peperomia tuisana) at starting point
corresponding to 8000ppm of CO2 level over a 24 hour period of time, under
controlled and uncontrolled (direct sunlight) luminance, and under controlled
(for about 30oC) and uncontrolled temperature (for about 40oC) conditions;
b.
Quantitatively assess the effect of elevated CO2 on plant as photosynthesis
agents;
c.
Identify any changes in the CO2 removal ability of the photosynthesis agents after
being exposed to high concentrations of CO2; and
d.
Theoretically deduce the likely CO2 removal GChim, by extrapolating from the
experimental results.
The short term objective of the project is to qualitatively assess the net CO2 reduction
by the photosynthesis agents. Meanwhile, the long term goal of this research project is
to examine the possibility of implementing the green chimney technology as a means
of carbon sequestration for emission from portable generators in a sustainable manner.
Moreover, the green chimney technology can be applied not only for portable
generators; indeed, the technology can be applied to industrial applications which use
fossil fuel for combustion. Instead of releasing the emission from the industrial site to
the environment, the emission can be sequestered via green chimney technology, thus
creating industrial-ecological cycle. In addition, both the short term and long term
impact to the carbon mitigation action aim to promote the sustainable and industrialecological use of flue gases for urban agriculture or horticulture.
11
1.4 Scope and Methodology
The scope of this research is focused on the response of photosynthesis agents and
limited to C3 plants i.e.: mung bean (Vigna radiata). C3 plants are chosen in
consideration of the fact that approximately 95% of Earth’s vegetation biomass is
dominated by C3 plants. Besides, C3 plants typically continue to increase the rate of
photosynthesis and biomass production with the rising of CO2 compared to C4 plants
(CO2 science, 2010a). Specific reasons for using mung beans as a sample of C3 plants
will be examined in Chapter 2.
Figure 1.3 shows the methodology of this study. The process started with a
preliminary literature review in CCS technology and the effect of elevated CO2 to the
photosynthesis agent. Presently, the preliminary literature review aims to identify the
knowledge gaps and to formulate the objectives of this study. In-depth literature
review enables configuration the theoretical framework that enables the formulation
of the hypothesis. A design of experiment was formulated in order to fulfill the
objectives of this study. Starting with the small scale laboratory experiment before
coming up with a bigger scale such as a rooftop scale, is our consideration when we
designing the experiment. Some series of experiments have been conducted in order
to collect data for analysis. The project report completed the research methodology.
12
Figure 1.3 Research Methodology
13
1.5 Organization of the thesis
The report is organized as follows. Chapter 1 is an introduction to describe the
background of this study and to give an outline on how the study has been conducted.
Chapter 2 reviews the literature on carbon capture and sequestration technology and
the effects of elevated CO2 on plants that support the theoretical theory for the study.
This chapter highlighted the current technology of CCS that has been used for power
generation plants and its consideration to the implementation of the technology.
Moreover, the literature about the effect of elevated CO2 gives some support finding
to this study. Chapter 3 provides the research methodology adopted to conduct this
study. It explains the research design, the data collection method and data collection
processes, where we used two types of experimental site, which is the laboratory scale
and scaled up to the rooftop scale. In Chapter 4, we present our data collection and
analysis of the data. We also highlighted also our finding, thus projecting the finding
to the possibility of implementing the green chimney technology into real scale.
Finally, the conclusions of this study and some proposed recommendations for future
development of the technology are discussed in Chapter 5. Chapter 6 provides the
suggestion of possible topics for novel study.
14
CHAPTER TWO
LITERATURE REVIEW
This chapter provides an overview of literature that has been review in order to
support the study that has been conducted. This chapter starts with an overview of the
current development of Carbon Capture and Sequestration (CCS), where review the
three main methods of capturing CO2 in power generations. It then reviews the other
method to removing CO2 from the atmosphere where it is more environmentally. The
next section explains the response of plants exposed to elevated CO2, which is varies
of each type of plants. Afterwards, the chapter covering the advantages of
hydroponics system since it is being used in the experiment. The last sections present
the review of Powder X-Ray Diffraction (PXRD) as a one method to test the plant
that has been used in the experiment.
2.1 Current Development of CCS
Triggered by the greenhouse gas problem that started to occur in the late of 1970’s,
the study of CO2 mitigation started in the early 1980’s at the Carbon Dioxide
Research Division (CDRD) under the U.S. Department of Energy. The studies
included the removal, recovery and disposal of CO2 in the ocean; CO2 disposal in
depleted, oil, coal, gas wells; CO2 disposal in solution mined salt domes; the effect of
improved energy efficiency and conservation on CO2 emission; the effect of fuel
substitution on CO2 emission, and using oxygen burning of fossil fuel with recycled
CO2 for recovery of CO2 from power plants (Steinberg, 1992).
15